
Stock Indices:
| Dow Jones | 42,270 |
| S&P 500 | 5,911 |
| Nasdaq | 19,113 |
Bond Sector Yields:
| 2 Yr Treasury | 3.89% |
| 10 Yr Treasury | 4.41% |
| 10 Yr Municipal | 3.31% |
| High Yield | 7.26% |
YTD Market Returns:
| Dow Jones | -0.64% |
| S&P 500 | 0.51% |
| Nasdaq | -1.02% |
| MSCI-EAFE | 17.30% |
| MSCI-Europe | 21.20% |
| MSCI-Pacific | 10.50% |
| MSCI-Emg Mkt | 8.90% |
| US Agg Bond | 2.45% |
| US Corp Bond | 2.26% |
| US Gov’t Bond | 2.44% |
Commodity Prices:
| Gold | 3,313 |
| Silver | 33.07 |
| Oil (WTI) | 60.79 |
Currencies:
| Dollar / Euro | 1.13 |
| Dollar / Pound | 1.34 |
| Yen / Dollar | 144.85 |
| Canadian /Dollar | 0.72 |
Macro Overview
Weariness among investors escalated towards the end of 2018 as uncertainty surrounding trade, the Federal Reserve, a government shutdown, and global economic growth lingered into the new year.
Even during the turbulent year of 2018, the U.S. economy continues its resilience into 2019, with unemployment at its lowest level in 49 years, wage growth reaching levels not seen since 2009 and consumer spending and industrial production remaining strong. A tight labor market along with moderate inflation has maintained an accommodating environment for consumers.
The year-end climate heading into 2019 became more challenging as equity markets reacted negatively to another rate hike in December along with two more expected hikes in 2019. Ironically, the market views the Fed hikes as a validation by the Fed that U.S. economic activity is healthy enough to endure further rate increases.
Global equity markets ended 2018 in negative territory with nearly every major index in both developed and emerging markets falling. China’s stock market was among the worst performer internationally as trade tensions took a toll on Chinese manufacturers and exporters. U.S. stock markets experienced volatility that had not occurred in several years resulting in a pullback for all major domestic equity indices in 2018.
Ongoing trade disputes and the imposition of new tariffs negatively influenced the markets and economic projections throughout year. Relations with China were forefront as the administration negotiated trade terms intended to better protect U.S. intellectual property and disparate tariffs. Growing U.S. oil production and an increase in supplies led to a drop of U.S. oil prices by 25% in 2018. The benchmark for U.S. oil, West Texas Intermediate (WTI), fell from $60 per barrel in the beginning of the year to $45 per barrel by year-end, simultaneously reducing the price of gasoline nationwide. According to the Federal Reserve Bank of New York, the likelihood of a recession remains relatively low with less than a 15% probability one will occur in the next year. The Fed has historically seen greater than 30% probabilities before each of the last seven recessions since 1970. (Sources: Federal Reserve Bank of New York, Treasury, Labor Dept., Bloomberg)
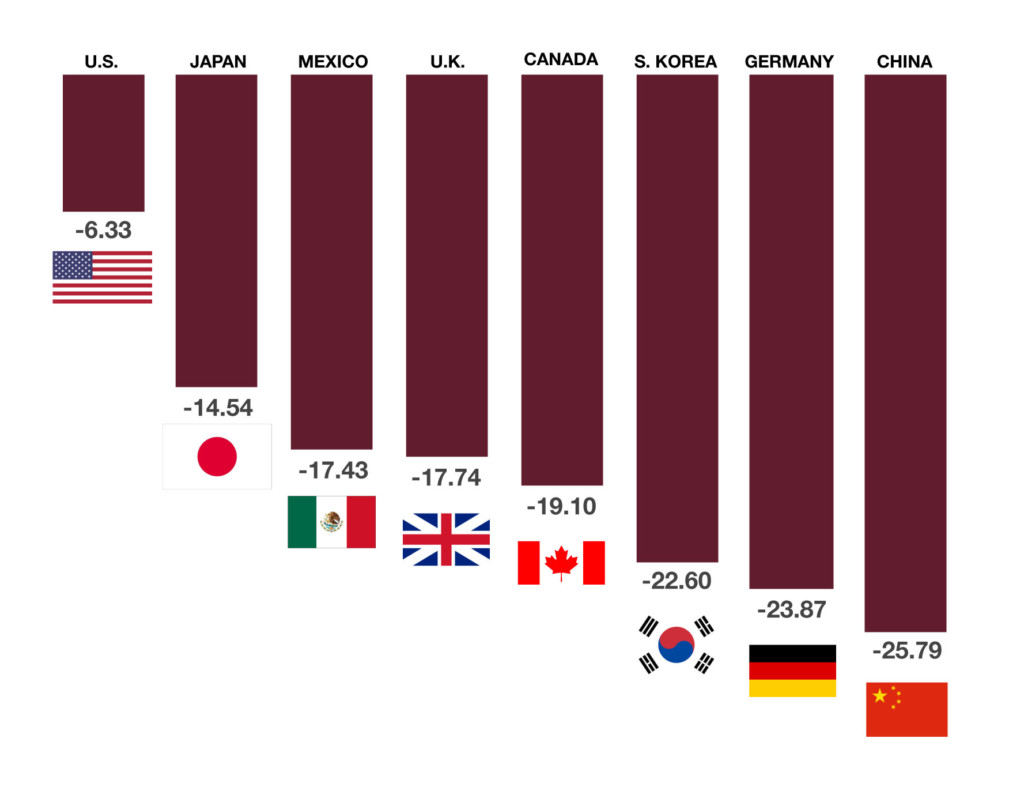 widespread negative returns for 2018 with both developed and emerging market indices falling. Domestic equities faired records according to data compiled by better than international stocks for the year as earnings optimism and a strong dollar helped stabilized U.S. markets.
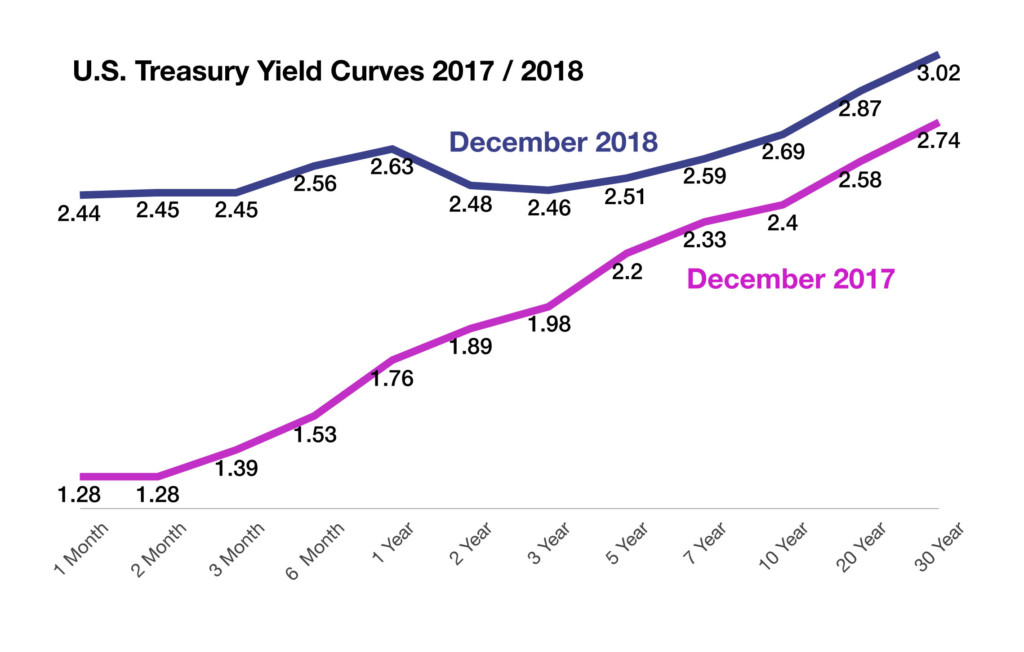
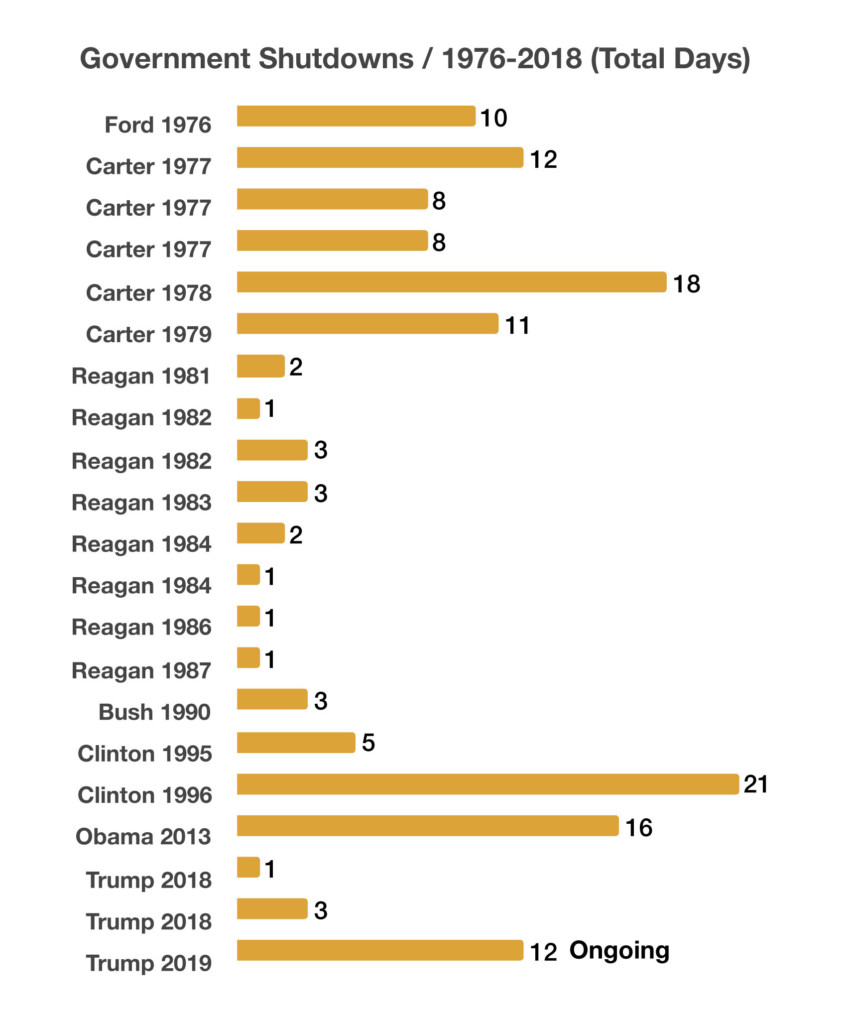 unknown, with lost wages, exports, and government services essential to the operation of private sector businesses being affected. How much the shutdown may have weighed on the economy may not be known until later in the year.
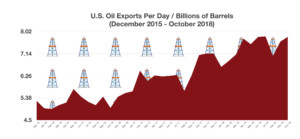 capabilities. Partially because of over supply, Congress agreed to remove the 40-year old ban on oil exports, thus allowing the U.S. to export some of its excess supplies. The onslaught of fracking and technological advances in drilling has led to increased U.S. production and supply growth. Saudi Arabia’s attempts to destabilize U.S. drillers with increased production and lower oil prices has essentially backfired. (Sources:IEA, U.S. Dept. of Energy, EIA.gov)
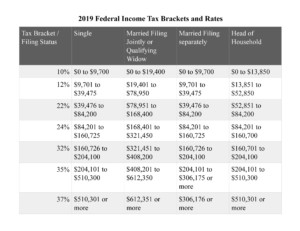 Decem
Decem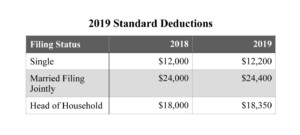 ber 31, 2018.
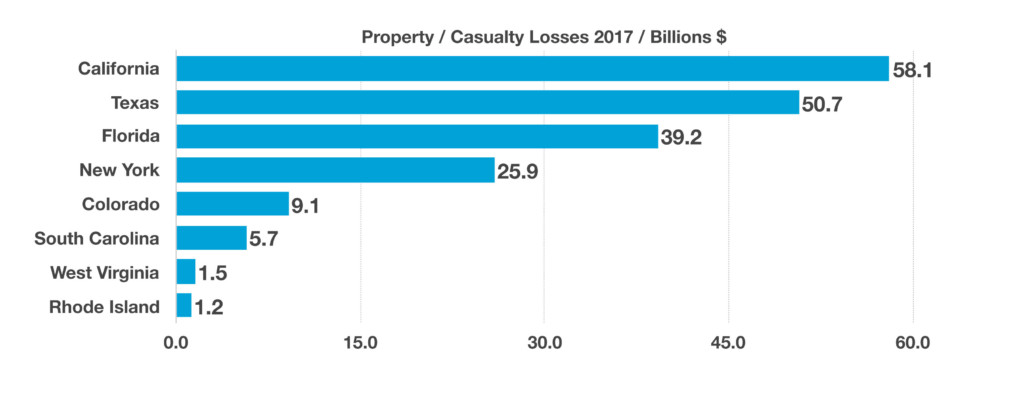 Insurance companies are intertwined and coverage costs are related. Some insurance companies spread their costs across all policyholders nationwide as opposed to centralizing higher premiums to one geographic region. Homeowners in coastal states from Texas and Florida to North Carolina are seeing rates rise faster than in other parts of the country, as the threat of future storms and flooding remains relatively high. In California, some insurance companies have designated several additional regions as high risk areas to insure. (Sources: NAIC, Insurance Information Institute)
 number of elderly are staying in their homes or living with their families. Many times, a son or daughter will move in with mom or dad and essentially become their part-time or full-time caregiver. Some elderly end up moving in with family members where they actually become part of the household. The challenge for family members that act as caregivers is the financial burden that may be imposed. An estimated 34.2 million adults provide some sort of unpaid care for elders aged 50 and older in 2015. Over 85% of these caregivers provide assistance directly for relatives. The average caregiver commits over 24 hours per week in providing care for elders. Even though there is no actual pay for family member caregivers, there is a tax break when done properly. Under the new tax rules, taking a personal exemption for a qualified friend or family member has been replaced by the larger standard deduction. However, the rules still allow caregivers to claim those receiving care as dependents as long as the following criteria are met for the person being cared for: