Market Update
(all values as of 04.30.2024)

Stock Indices:

Dow Jones 37,815
S&P 500 5,035
Nasdaq 15,657

Bond Sector Yields:

2 Yr Treasury 5.04%
10 Yr Treasury 4.69%
10 Yr Municipal 2.80%
High Yield 7.99%

YTD Market Returns:

Dow Jones 0.34%
S&P 500 5.57%
Nasdaq 4.31%
MSCI-EAFE 1.98%
MSCI-Europe 2.05%
MSCI-Pacific 1.82%
MSCI-Emg Mkt 2.17%
 
US Agg Bond 0.50%
US Corp Bond 0.56%
US Gov’t Bond 0.48%

Commodity Prices:

Gold 2,297
Silver 26.58
Oil (WTI) 81.13

Currencies:

Dollar / Euro 1.07
Dollar / Pound 1.25
Yen / Dollar 156.66
Canadian /Dollar 0.79
 

Macro Overview

A year after Covid-19 changed the course of travel, socialization, and financial markets, 2021 witnessed a much quicker rebound than had been anticipated. The equity market upswing caught many by surprise as it was not anticipated.

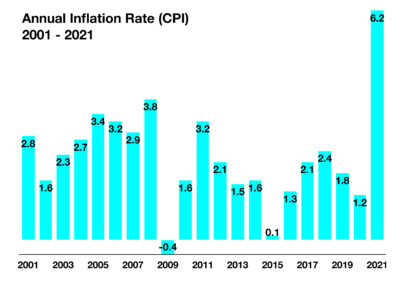
Inflation brought about by supply constraints and rising labor costs are expected to linger well into 2022, with little abatement as underlying inflationary pressures persist. Some economists are even expecting stagflation to become an issue in 2022 should economic growth stagger and inflationary pressures persist.

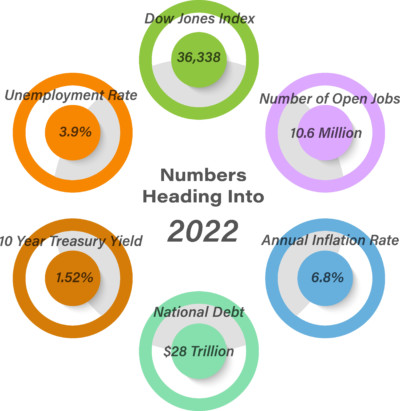
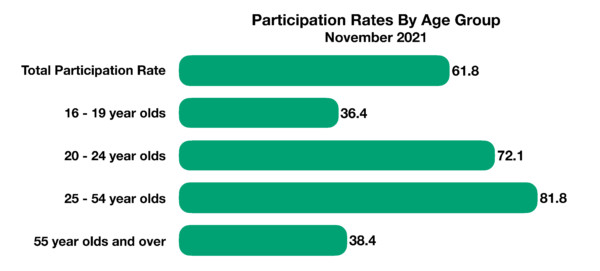
Labor shortages triggered by the pandemic continue into 2022, leading to wage inflation and difficulty for employers filling over 10 million open positions nationwide. Workers are quitting their jobs at record levels, transitioning to higher paying positions and new occupations.

Consensus is that the Federal Reserve is on course to start removing monetary stimulus from the economy and begin raising short term rates as soon as March, in order to curtail inflation. Fed governor Christopher Waller described current inflationary pressures as “alarmingly high”.

Global vaccinations and the end of lockdowns, in both developed and emerging countries, allowed the world economy to reignite and get back on track in 2021. However, the recent emergence of new coronavirus variants threaten to once again derail economic recovery efforts throughout the world.

Pandemic driven volatility due to uncertainty affected financial markets throughout 2021, distorting economic data and possibly misleading Federal Reserve members. Central banks from various countries worldwide have started to raise short term interest rates in their efforts to combat inflationary threats in both developed and emerging economies.

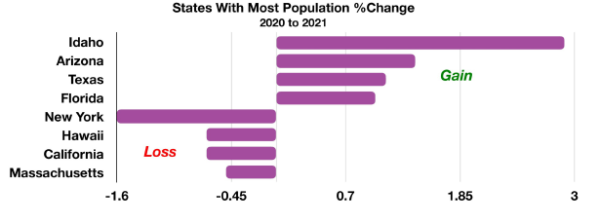
U.S. Census Bureau data revealed that for the first time ever that immigrants surpassed the number of births for the past census year which ended in July 2021. Population growth was driven by 245,000 entrants into the country, versus only 148,000 births.

Sources: Federal Reserve, Census Bureau, CDC, Labor Dept., Treasury Dept.


Rates Start Their Steady Climb – Fixed Income Overview

Various fixed income analysts expect a reversal in downward trending rates as the Fed prepares to start raising short term rates as early as the first quarter of 2022.

The Fed is on track to shrink its balance sheet of mortgage and treasury bonds sooner rather than later. The expectation is that the Fed will continue reducing or selling off portions of its $8.76 trillion balance sheet over the next few months. Markets view this dynamic as a form of tightening monetary policy, signaling the deliberate attempt to stifle inflation by slowing economic expansion.

The 10 year treasury bond yield rose in the final trading days of 2021 to 1.52%, up from 0.93% at the end of 2020. Corporate bond yields also rose for the year, yet not as significant as U.S. government bond yields. (Source: U.S. Treasury)

Equity Markets Surprised Many in 2021 – Global Equity Overview

All sectors of the S&P 500 Index posted gains in 2021, with the energy sector leading, following a dismal outcome in 2020. Real estate, technology and financial sectors were also leading sectors in 2021.

Domestic equity markets were resilient to the challenges brought about by the pandemic, fairing better than developed international and emerging equity markets in 2021. Massive fiscal and monetary stimulus aided U.S. based companies amid supply constraints and labor shortages.

U.S. companies continue to absorb higher production costs and pass them along to consumers in the form of higher prices while maintaining favorable profit margins. Such a scenario bodes well for stocks of companies that exhibit these characteristics. (Sources: S&P, Bloomberg)

States That Lost & Gained Population During The Pandemic – Lifestyle Trends

 As Covid infections swept the nation in 2020 and 2021, states differed on restrictions and guidance surrounding the pandemic, encouraging many to migrate to another state.

Health, jobs, housing and quality of life were all factors in influencing Americans to leave for other states. Deaths and births were also a factor in states’ population growth and declines, yet not as significant as migration.

From 2020 to 2021, Idaho, Texas and Florida were among the states that saw the largest population increases, while New York, California, and Massachusetts were among states with the most declines. (Source: U.S. Census Bureau)


Life Expectancy Drops – Demographics

Recently released data by the Center of Disease Control and Prevention reveal that life expectancy in the U.S. declined by 1.8 years in 2020. The three leading causes of death in 2020 were heart disease, cancer and Covid-19.

Life expectancy for all Americans in 2019 was 78.8 years falling to 77 years in 2020. Those aged 85 and older saw the most deaths, many experiencing medical complications from Covid-19. In 2020, Covid related deaths exceeded deaths caused by strokes, Alzheimers, diabetes, and kidney disease.

The U.S. Department of Health & Human Services tracks factors contributing to life expectancy including age, gender and race. The most recent data revealed that females are estimated to live to age 81 while males are expected to live to 76, a five year difference. Financial planners usually take this into account should one spouse / partner pass prior to the other along with the uncertainty as to how long the second will live.

Medical advancements and safer living conditions over the decades have led to a gradual increase in life expectancy. In 1860, life expectancy was 39, increasing to 69 in 1960, representing a 30 year life span increase in 100 years. (Sources: U.S. Department of Health & Human Services, CDC)

Record Mortgage Issuance Expected To Continue…For Now – Housing Market Overview

A robust housing market led to a record number of mortgages issued in 2020, with over  $4 trillion in mortgage loans issued as reported by the Mortgage Bankers Association. A rush to refinance and purchase is expected as rates start to rise in 2022. 

Continued low interest rates, work at home transitions, and rising wages all contributed to an ongoing demand for homes nationwide. Rising rates over the past two months have slowed the pace of refinances, yet purchases continue to materialize.

For some homebuyers, rising home prices have put homeownership out of reach, even with low interest rates and higher wages. The Federal Reserve Bank of Atlanta found that mortgages have become less affordable relative to income the most since 2008. It revealed that Americans needed about 29% of their income to pay a mortgage payment on a median priced home in early 2021, rising to 33% in October 2021. (Sources: Mortgage Bankers Association, Federal Reserve Bank of Atlanta)


Medical Positions Represent Highest Paying Jobs Heading Into 2022 – Labor Market Overview

 The U.S. Bureau of Labor Statistics compiles pay on occupations across various industries and has found that 14 of the nation’s top 20 paying occupations are in the medical field. Psychiatrists, surgeons, and anesthesiologists top the pay list along with airline pilots and chief executives.

Advancements in medical technology as well as changing demographics have created a growing demand for medical specialists and general practitioners. Medical industry positions can be either part of a private practice or hospital / medical group. (Source: U.S. Bureau of Labor Statistics)

Over $1 Trillion Paid Out In Social Security Benefits In 2021 – Retirement Planning

As of November 2021, over 69.9 million Americans received Social Security benefit payments, with over 51 million age 65 or older. The Social Security Administration estimates that Americans received over $1 trillion in Social Security benefit payments in 2021. Total annual benefit payments have nearly tripled in the past 13 years, up from $361 billion in 1997.

In 1940, the life expectancy of a 65-year old was 14 years, today it’s about 20 years. By 2036 there will be almost twice as many older Americans eligible for benefits as today, from 41.9 million to 78.1 million. Even the current drop in life expectancy to 77 years of age is not estimated to affect current projections much.

The latest annual report issued by the trustees of Social Security and Medicare revealed that by 2034, the program’s trust fund will be depleted. Depletion means that Social Security recipients will no longer be receiving full scheduled benefits. Recipients would receive about three-quarters of their scheduled benefits after 2034. Congress can eventually act to fortify the program’s finances, but it may be years before it actually takes effect and funds.

Social Security’s largest costs are attributable to Medicare, which represents over 76% of Social Security benefits. The report also mentioned that Medicare’s hospital insurance fund would be depleted in 2026.  The trustees noted that the aging population of the country has placed additional pressure on both the Social Security and Medicare programs. A decade ago, roughly 12% of Americans were age 65 or older, today 16% of Americans have already surpassed 65, the eligibility age for Medicare.

The Social Security Administration considers various factors in projecting its estimates, including fertility, immigration, wages, health, and economic growth. A recent drop in U.S. birthrates along with stagnant wages has placed additional burden on the viability of future benefit payments. (Sources: https://www.ssa.gov/oact/TR/2019/index.html)

 
Crypto trading platforms start issuing 1099-Misc and 1099-K forms

Year-End Tax Planning For Cryptocurrency Transactions – Tax Planning

As millions of investors dabbled in cryptocurrency this past year, the IRS has heightened its surveillance of transactions in order to tax gains. The pending infrastructure bill in Washington, Build Back Better, contains an entire section on identifying and taxing gains on cryptocurrency transactions. The rapid and extensive emergence of cryptocurrency transactions has brought about uncertainty surrounding taxing transactions as an asset, similar to a stock, rather than a currency. Some cryptocurrency trading platforms also pay interest on lended digital currency positions, creating yet another tax liability on the interest earned.

Since the federal government sees a tremendous tax revenue opportunity in taxing digital currency transactions, the IRS has already started to issue tax ramification guidelines applicable to such transactions. The U.S. government expects to raise about $28 billion over the next ten years by tracking and taxing transactions. Digital wallets, which hold crypto currencies, may be required to report holdings and transactions to the IRS, similar to traditional financial institutions. The IRS also plans to crack down on taxpayers not reporting gains from crypto transactions, as noted on the most recent IRS tax return forms. Some crypto trading platforms intend to start issuing 1099-Misc and 1099-K forms in order to comply with IRS reporting requirements.

As consumers become more comfortable with making payments with digital currencies, each transaction may become a taxable event. The ability to store cryptocurrency in a digital wallet, then use it for a purchase, may trigger a tax consequence if the currency is sold at a gain in order to make the purchase. The IRS is expected to require platforms providing digital wallets to maintain the cost basis on all currency transactions. Should a 1099 form not be issued by the digital currency platform used, then the IRS is suggesting that taxpayers maintain a record of all purchases and sells in order to properly report any taxable gains or losses. (Sources: IRS)

IRS Introduces New Tax Brackets & Standard Deductions For 2022 – Tax Planning

 Heading into the new year, the recent higher than expected inflation numbers will also be affecting tax rates for everyone. The IRS has adjusted 2022 tax brackets to reflect the most recent inflation data. Ironically, the adjustment for higher inflation will amount to lower tax rates for many taxpayers.  For those earning more in 2022 than in 2021, the applicable tax bracket may actually be lower than the prior tax year because of the inflation adjustment. Standard deductions and estate tax exclusions have also risen for tax year 2022. (Sources: IRS, taxpolicycneter.org, taxfoundation.org)

 
Annual inflation rate of 6.2% from October 2020 to October 2021

Release of Oil Reserves Hasn’t Reduced Gas Prices Much If Any – Oil Sector Review

The administration announced in November that it had authorized the release of 50 million barrels of oil from the strategic petroleum reserve (SPR) in order to help alleviate rising gasoline prices across the nation. Markets reacted to the release as non-consequential, since the 50 million barrels of oil amount to roughly 5 days of U.S. oil production.

Some industry advocates argued that additional production might be warranted in order to ease pricing pressures. OPEC, as well as U.S. based oil producers, are reluctant to ramp up production due to the threat of another sudden global slowdown similar to what occurred last March and April 2020. Oil prices fell below $20 per barrel and traded negative at times in April 2020 as demand for oil collapsed. A severe shortage of oil storage in the weeks following the demand collapse drove several drillers and producers out of business.

Ironically, the energy sector, which is primarily made up of oil industry companies, is the leading performing sector of the S&P 500 Index so far this year. (Sources: U.S. Energy Information Administration)

How Inflation Might Ease – Consumer Behavior

The pandemic pulled forward or accelerated an enormous amount of consumer spending that was pent up for months during lock downs and closures. As a result, demand for automobiles, homes, furniture, and appliances all skyrocketed, driving prices higher and evaporating inventories.

Much of the pulled forward demand is expected to ease especially among consumers and businesses that modified their business models in order to work from home. As the transition for millions has begun to settle and become complete, additional transitions are expected to be limited.

Elevated prices for essentials including food and gasoline will limit how much money consumers have for discretionary items such as movies, furniture, and automobiles. As discretionary income falls, so does consumer demand, alleviating inflationary pressures. Several economists are predicting a pullback in the inflation rate as consumers slow spending behaviors and overall demand eases.

The most recent inflation data revealed an annual inflation rate of 6.2% from October 2020 to October 2021, the steepest increase in 31 years. Economists and market analysts alike believe that inflation may be temporary for certain goods yet more lasting for others as consumers determine where to spend. (Sources: Bureau of Labor Statistics)

 
Labor Force Participation Rate Still Below Prior To Pandemic

Labor Force Participation Rate Still Below Prior To Pandemic – Labor Market Update

 Workers across all age groups are still not willing or able to work as they did before the pandemic. The participation rate is basically the percentage of the population that is either working or actively looking for work. That percentage has fallen to 61.8% as of November 2021, down from 63.3% in February 2020. The 1.5% difference may seem small yet still represents over 2.4 million workers that have essentially left the workforce. Those leaving the workforce include prime working age adults 25-54 years of age, as well as teenagers and 65 year old’s.

There are various reasons why workers leave the workforce including health, lack of skillsets, and retirement. With the onset of baby boomers retiring, succeeding generations will make up the majority of the workforce over the next few years. The pandemic brought about early retirement for many workers in their 60s and 70s, removing tens of thousands from the workforce and eventually will be filled by younger workers. (Source: U.S. Department of Labor)

Rates In Flux As Omicron Creates Uncertainty – Fixed Income Overview

The renomination of Fed Chair Jerome Powell for another four years is not expected to result in any changes to monetary policy objectives. With the emergence of the new Covid variant, the Fed now has the challenge of taming inflation while not stifling a sensitive economic recovery. Comments by the Fed Chair conveyed that the Fed will start raising rates once it has ceased buying treasury and mortgage bonds as a stimulus effort. It signaled that it may start that process before the third quarter of 2022.

Tapering objectives by the Federal Reserve may be modified should the latest Covid variant prove to hinder economic recovery, yet the Fed is still on track to add another $420 billion to its already inflated $8 trillion balance sheet.

Rates were in a state of flux at the end of November as short-term government bond yields rose simultaneously as longer term yields fell. Economists view this dynamic as a flattening yield curve representative of slowing economic growth. The yield curve flattened to levels not reached since the onset of the pandemic in 2020. (Sources: Fed, U.S. Treasury)