Robert Krueger

Alexander Randolph Advisory Inc.

8200 Greensboro Drive, Suite 1125

McLean, VA 22102

703.734.1507

www.alexanderrandolph.com

Market Update
(all values as of 06.28.2024)

Stock Indices:

Dow Jones 39,118
S&P 500 5,460
Nasdaq 17,732

Bond Sector Yields:

2 Yr Treasury 4.71%
10 Yr Treasury 4.36%
10 Yr Municipal 2.86%
High Yield 7.58%

YTD Market Returns:

Dow Jones 3.79%
S&P 500 14.48%
Nasdaq 18.13%
MSCI-EAFE 3.51%
MSCI-Europe 3.72%
MSCI-Pacific 3.05%
MSCI-Emg Mkt 6.11%
 
US Agg Bond -0.71%
US Corp Bond -0.49%
US Gov’t Bond -0.68%

Commodity Prices:

Gold 2,336
Silver 29.43
Oil (WTI) 81.46

Currencies:

Dollar / Euro 1.06
Dollar / Pound 1.26
Yen / Dollar 160.56
Canadian /Dollar 0.73

April 2021

Macro Overview

The prospect of resurgent inflation has developed into a growing concern for markets globally. Some believe that current inflationary pressures may be transitory and not lasting, while others contend that higher prices may become more permanent.

Rising fiscal deficits along with increasing levels of federal debt are prompting the administration to explore the most significant tax hikes since 1993. Tax increases are being considered for corporations, businesses structured as pass-through entities, estate taxes, and capital gains. Optimism surrounding a third round of stimulus payments along with rising vaccination rates fueled equity markets in March as an economic revitalization began to take hold. Major equity indices ended the quarter positively as companies saw a resurgence in activity and sales.

The pandemic has brought about modifications and changes to business models throughout numerous industries, many of which are passing along higher costs to consumers. Many of the higher cost trends are not being recognized by some government inflation gauges and not accounted for in forecasts. The suggestion that inflationary pressures are only temporary are being contested as a growing number of businesses are expected to make pricing changes permanent.

The IRS announced that it is extending the tax filing deadline to May 17th, allowing tax payers more time to assess the effects of COVID related changes for individual and small business filers.

In addition to stimulus payments, the $1.9 trillion bill passed in March, known as the American Rescue Plan Act of 2021, will provide an exemption on taxes paid on unemployment benefits up to $10,200. The IRS communicated that automatic refunds would be issued to those who have already filed their 2020 taxes and have paid taxes on unemployment last year.

Many economists believe that the third stimulus aid package may be excessive and inflationary, simultaneously being issued as economic activity is reigniting in parts of the country. Thus far, the total amount of the three stimulus bills combined since the pandemic began is over $5 trillion.

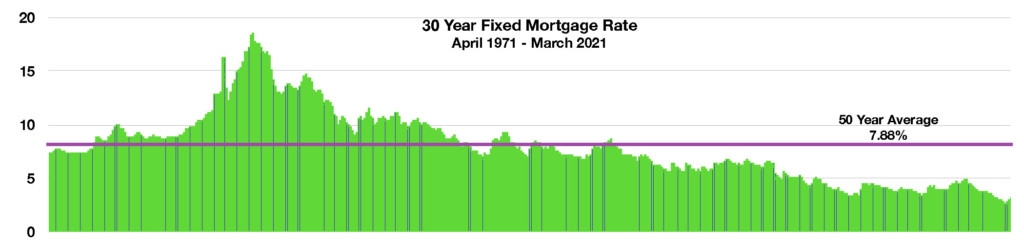
The rapid rise in mortgage rates since the beginning of the year has led to a slowdown on refinances nationwide. The 30-year fixed rate mortgage reached the highest level in over nine months at 3.17% as of March 25th, yet still at historical lows relative to the 50-year average for a 30-year fixed mortgage rate of 7.88%.

Sources: IRS, Federal Reserve, CDC, Congress.gov


Loans May Be Easier To Qualify For As Mortgage Rates Rise – Housing Market Review

Rising mortgage rates since the beginning of the year have slowed mortgage applications down. Should employment conditions improve allowing more to qualify for loans, then there could be a resurgence in refis and purchases for those that didn’t qualify last year. In addition, some lenders are expected to relax standards as volume declines, easing the loan qualification process. Optimistically, rates are still historically low relative to the 50-year average for 30-year fixed mortgage loans of 7.88%.

Fannie Mae is forecasting that mortgage companies are projected to originate 13% fewer home loans than last years’ record of $4.5 trillion in loans. Both refi and purchase volume are forecast to drop this year.

Even though rates have been rising, many homeowners may still benefit from a refinanced loan since rates are still well below their 50-year average. In addition, limited housing inventory has brought about demand for new construction in various parts of the country, creating new home purchase loans. New home construction, as measured by Housing Starts data tracked by the Federal Reserve, show that new home construction has started to rebound from the lows of the pandemic, ensuing in new home loans.

Sources: Mortgage Bankers Association, Fannie Mae

How Government Inflation Gauges Differ – Macro Economic Dynamics

The traditional gauge for inflation, known as the Consumer Price Index (CPI), is being challenged by yet another government produced measure known as Consumer Expectations. The most recent data released shows an inflation rate of 1.7%, as noted by the CPI compiled by the Bureau of Economic Analysis for February 2021. The Federal Reserve maintains its own inflation gauge, yet is based on consumer expectations of where inflation is headed. That inflation gauge ended February at 3.09%.

Many economists believe the Fed’s inflation gauge to be a more accurate indicator of actual inflation since it is directly based on consumer expectations. The traditional CPI extracts food and energy, ironically two of the most inflationary areas for consumers this past year.

Some of the items included in the CPI basket are housing, clothing, transportation, medical care, and education. The challenge of the CPI is that it takes a look-back approach rather than a look-forward approach which takes consumer expectations into account. Expectations also vary among age groups, where seniors are more concerned about medical care and transportation, while younger adults worry about apparel and housing.

Sources: BEA, Federal Reserve


Where Anticipated Tax Hikes May Hit – Tax Planning

While the three stimulus programs amount to over $4.5 trillion were mostly funded by government debt, the recently introduced $2.25 trillion infrastructure plan will be primarily funded by tax increases. Preliminary indications are that the anticipated tax hikes will target both corporations and high earning individuals. The tax increases may be the largest since 1993. The following are among the proposals currently being considered:

Raising the corporate tax rate to 28% from 21%;

Reducing tax preferences for pass-through entities, such as LLCs, S-Corps & Partnerships;

Tax increases for individuals earning more than $400,000;

Expanding estate taxes;

Higher capital gains tax rate for individuals earning $1 million or more.

The lingering concern is that individual tax payers that are small business owners may end up paying higher taxes even if their incomes are below $400,000. This could occur if the existing 20% pass-through tax deduction is eliminated or altered, essentially affecting about 95% of all businesses in the United States.

Sources: Taxpolicycenter.org

Yields Continue To Move Upward – Fixed Income Update

Yields rose across all fixed income sectors, with the 10-year Treasury yield reaching 1.74% as of March 31st, the highest level since January 2020. The onslaught of rising yields has been in conjunction with heightened inflationary pressures.

Some analysts and economists believe that interest rates will rise more slowly in response to inflation, allowing for gradually elevating bond yields. Higher bond yields have historically led to higher loan rates from mortgages to credit cards.

Sources: U.S. Treasury, Bloomberg

Higher Yielding Bond Alternatives  – International Fixed Income

Main reasons why China Bonds are currently attractive:

Extra yield—In today’s environment with many of the major economies operating in zero or close to zero interest rates, China is one of the few major economies that still offer yields significantly above zero.

Diversification—Chinese bond market returns have low correlation with other asset classes, making it very useful as an diversification asset in our view.

Relatively low currency volatility—The renminbi offers significantly lower volatility than currencies of other major economies making the volatility-adjusted unhedged total return attractive.

Source: MatthewsAsia Fund Management


Markets Gained On Optimism – Equity Overview

Optimism deriving from continuing fiscal and monetary stimulus efforts in addition to vaccination progress, drove equites higher in the first quarter. Major equity indices moved higher with the energy, financial and industrial sectors leading in the first quarter.

International developed market indices were mostly positive for the first quarter, with emerging market indices primarily flat to negative amid growing debt concerns. Rising inflation is stoking some hesitation among debt heavy global companies as costs to operate and borrow increase. As the cost of production materials has increased over the past few months, so has the concern as to how company earnings will be affected. The PPI Index, which measures wholesale production prices for companies has been rising steadily for the past year.

Sources: BEA, Bloomberg, Federal Reserve

What The Top 1% Really Owns – Demographics

Wealth, as measured by assets owned by individuals among all income brackets, surprisingly is not well perceived by most. Federal Reserve data show that the top 1% hold just over 11% in real estate related assets, while the bottom 50% hold over 50% in real estate. Data also reveal that the top 1% own nearly half of all equity and mutual fund assets, while the bottom 1% own only 2.5%.The vast disparity helps explain how the top 1% did so well during the pandemic, primarily due to rising equity valuations over the past year.

Fluctuations in asset values vary among asset types and the economic environment. Inflation has historically helped lift real estate values yet has hindered stock and bond values when too much was present. Income and wealth disparity has become a trending topic lately as the top 1% has garnered enormous gains during one of the most tumultuous periods in history.

As of the end of 2020, over $38.6 trillion of wealth was held by the top 1%, while the bottom 50% held just under $2.5 trillion in wealth. Federal Reserve data qualify the top 1% as those with a net worth valued above $11 million.

Sources: Federal Reserve