Stock Indices:
| Dow Jones | 40,669 |
| S&P 500 | 5,569 |
| Nasdaq | 17,446 |
Bond Sector Yields:
| 2 Yr Treasury | 3.60% |
| 10 Yr Treasury | 4.17% |
| 10 Yr Municipal | 3.36% |
| High Yield | 7.69% |
YTD Market Returns:
| Dow Jones | -4.41% |
| S&P 500 | -5.31% |
| Nasdaq | -9.65% |
| MSCI-EAFE | 12.00% |
| MSCI-Europe | 15.70% |
| MSCI-Pacific | 5.80% |
| MSCI-Emg Mkt | 4.40% |
| US Agg Bond | 3.18% |
| US Corp Bond | 2.27% |
| US Gov’t Bond | 3.13% |
Commodity Prices:
| Gold | 3,298 |
| Silver | 32.78 |
| Oil (WTI) | 58.22 |
Currencies:
| Dollar / Euro | 1.13 |
| Dollar / Pound | 1.34 |
| Yen / Dollar | 142.35 |
| Canadian /Dollar | 0.72 |
Macro Overview / February 2022
Market dynamics are shifting as the Federal Reserve outlines its execution of ending monetary stimulus in order to squash inflationary pressures. Analysts and economists are expecting market volatility to continue as the Federal Reserve prepares to embark on its interest rate increase initiative. Some believe that the Fed will successfully pull off a series of four possible rate increases this year culminating in a “soft landing” whereas a rise in rates to control inflation doesn’t stifle economic expansion.
Inflation reached the highest level in 40 years, annualizing 7% at the end of 2021. Several analysts and economists believe that inflation may be peaking and may actually reverse course in coming months. It is also plausible that the Fed’s rush to raise rates simultaneously as pandemic stimulus funds have evaporated, may slow economic growth more than anticipated and ease inflation precipitously.
Economists are suggesting that the post pandemic inflation the nation is experiencing is not being driven by excessive demand, but by limited supply of goods and workers. Nearly all prior inflationary periods have been driven by excess demand.
Supply constraints are still prevalent throughout the country, caused by multiple factors that neither the administration nor the Federal Reserve can alleviate. As higher prices evolve from the constraints, consumers modify spending behavior in order to accommodate inflationary tensions. The Atlanta Fed GDPNow model projects a substantial pullback in retail spending as consumers exhaust all remaining stimulus funds and minimize expenditures on costly discretionary goods.
Government data is showing that demand is falling faster than supply for various goods and services across the nation, alleviating inflationary tensions. Sales of products and services including furniture, clothes, electronics, appliances, sporting goods, and dining out have fallen over the past few weeks, indicating a slowdown in consumer expenditures.
A growing consensus among economists is the belief that pandemic stimulus funds and low vaccination rates have been the primary factors behind the drop in labor participation and a tight labor market. Wage inflation could eventually subside as more workers return to the workforce, thus helping to mitigate overall inflation pressures.
Financial market volatility intensified in January, as geopolitical tensions coupled with expectations of an imminent Fed rate hike drove equity and bond prices in extreme directions. Major equity and fixed income indices saw price declines in January.
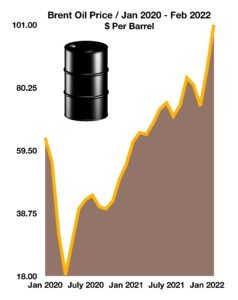
Crude oil prices posted their strongest January in decades as expanding global demand and limited supply propelled prices higher. Rising oil prices have also translated into rising gasoline prices nationwide, with some analysts expecting even higher prices heading into the summer months.
The Census Bureau, via its Household Pulse Survey, found that over 40% of unemployed individuals blame Covid related reasons for their unemployment. The same survey also identified that there were over 3.5 million workers absent from work in January due to illness, a record number. Labor market data has become a focal point for the Federal Reserve and financial markets, as distortions surrounding what the data is relaying about the actual economic health of the economy.
Sources: Fed, Labor Dept., www.census.gov/data/experimental-data-products/household-pulse-survey.html

 How Rising Oil Prices Can Stifle Global Growth – Oil Sector Update