3Q 2022 Newsletter
Market Update
(all values as of 04.30.2024)

Stock Indices:

Dow Jones 37,815
S&P 500 5,035
Nasdaq 15,657

Bond Sector Yields:

2 Yr Treasury 5.04%
10 Yr Treasury 4.69%
10 Yr Municipal 2.80%
High Yield 7.99%

YTD Market Returns:

Dow Jones 0.34%
S&P 500 5.57%
Nasdaq 4.31%
MSCI-EAFE 1.98%
MSCI-Europe 2.05%
MSCI-Pacific 1.82%
MSCI-Emg Mkt 2.17%
 
US Agg Bond 0.50%
US Corp Bond 0.56%
US Gov’t Bond 0.48%

Commodity Prices:

Gold 2,297
Silver 26.58
Oil (WTI) 81.13

Currencies:

Dollar / Euro 1.07
Dollar / Pound 1.25
Yen / Dollar 156.66
Canadian /Dollar 0.79
 

Macro Overview

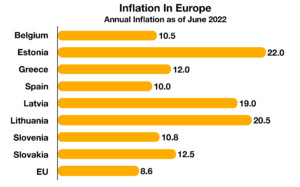
Attention has shifted from inflation to recession as housing, wages, interest rates, commodities, and consumer expenditures have all receded from their highs, an indication to economists that an economic slowdown or recession may be evolving. Numerous countries worldwide are restricting the export of food, adding to global supply constraints already causing shortages and hunger in various third-world countries. Such restrictions, which have been exacerbated by the invasion of Ukraine, are considered a form of food protectionism. The EU imposed a partial ban on crude oil imports from Russia in response to the invasion of Ukraine. With energy prices already soaring in Europe, the ban is expected to cause even further inflationary pressures throughout the European region. Consumers may not notice the price difference between gasoline and diesel at the pump, yet they will be indirectly affected by higher prices as transportation costs are passed along to consumers. Diesel is the primary fuel for railroads and trucking, which transport the bulk of consumer goods nationwide.

Equity indices had their worst first six months in decades, with the Dow Jones, S&P 500, and Nasdaq averages all posting negative returns. Elevated labor and material costs, recessionary concerns, and an increasingly faltering sentiment have fostered downward momentum. Russia missed payment on its government bonds in late June, which is considered a default by the international bond market. The last time Russia defaulted on its debt was in 1917, during the Russian Revolution. As a reminder, the Russian Revolution saw the abolition of the Russian monarchy and the beginning of Russia’s communist regime, a huge turn for the nation.

The Federal Reserve Bank of Atlanta estimates Gross Domestic Product (GDP) with a model it has been utilizing for years, with a very low average tracking error of just -0.3. The model, known as GDPNow, estimates GDP for the second quarter of the year at negative 2.1%, following another negative 1st quarter GDP of 1.6%. Many economists consider two consecutive quarters of negative GDP as indicators of a recessionary environment. Fed Chairman Jerome Powell said that the risk of a recession is heightened as rates continue to move higher, stating that a recession is not the Fed’s “intended outcome”, but that it is “certainly a possibility.” Some companies over the past few weeks have also announced hiring freezes and layoffs in response to slowing economic activity. Fortunately, the cutbacks have so far been limited to a few industries including technology, mortgage lending, and popular pandemic-era companies. Various companies are believed to have over-hired during the past two years when growth was more prominent and costs were still contained.

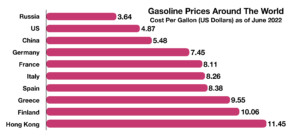
Gasoline prices eased a bit this past month with the national average for a gallon of regular gasoline falling to $4.87 at the end of June, down from $5.00 earlier in the month. As pricey as gasoline may seem, gasoline prices can be much higher in other countries, such as in Hong Kong where consumers are paying upwards of $11 per gallon. Sources: The Federal Reserve Bank of Atlanta, EuroStat, EIA, S&P, World Food Programme)

 
THE DOW JONES INDEX SUFFERED ITS WORST SIX MONTHS SINCE 1962

Equity Indices Have a Rough First Half – Domestic Equity Overview

Equity indices have had a difficult first half of the year, their worst in decades. The S&P 500 Index had its
worst first half in over five decades, the Dow Jones Index suffered its worst six months since 1962, and the
Nasdaq had its worst first six months ever.

Energy was the only positive sector in the S&P 500 for the first six months, while the other ten sectors
including health care, financials, communications, and real estate were negative. Consumer discretionary
and technology sector stocks were among the worst-performing sectors, with consumer staple stocks
among the better performers.

Second-quarter earnings, due for release in July, are expected to reveal how company profits fared with
exceptionally elevated material and labor costs earlier in the year. Analysts are also sensitive to a growing
consensus expecting a recessionary environment before the end of the year.

Sources: Bloomberg, S&P, Reuters, Dow Jones

Yields Hold Steady Until Fed Decides – Fixed Income Update

The yield on the 2-year Treasury bond fell to 2.84% on July 1st, the biggest drop since March 2020. Yields on
the 5, 10, and 30-year Treasury bonds also fell, indicative of deflationary trends.

Many analysts expect the Fed to raise short-term rates at least once more by 75bps in July, with a possible
pause thereafter. Some are even projecting the Fed to reverse course and start easing rates in 2023 should
the economy fall into a recession. (Sources: Treasury Dept., Federal Reserve)

What is ESG – Socially Conscience Investing – Part 1 of a 3 Part Series

As an investor, deciding what company to invest in can be daunting. ESG investing can significantly
influence and improve financial choices, but what really is it? Firstly, ESG stands for Environmental, Social,
and Governance. These are three aspects of companies that could be crucial to making intelligent
investments. ESG Investing is the financial philosophy where investors inspect these non-traditional
aspects of companies, an approach that has increasing popularity, and in some cases, success.

Environmental, social, and governance (ESG) have become focal points for companies, analysts, and
investors. The evolution of ESG has created a growing awareness among the public about how companies
formulate criteria for socially conscious decisions.

For decades, analysts and financial advisors determined how well companies were performing by their
earnings and revenue growth. ESG now injects a more subjective, non-traditional metric into how well
companies are being managed for the future impact of the environment and social consciousness.

Recent global events including the invasion of Ukraine by Russia and global warming trends have
compelled governments in Europe, Asia, and the U.S. to re-examine their energy initiatives as well as
mandates for corporations. Companies today are starting to be measured by how well they apply ESG
formats and follow their success. As a result, asset managers, mutual funds, ETFs, and advisors are
introducing portfolios and screening methods that identify which companies are implementing and
adhering to ESG guidelines.

Source: Staff Editorial

 
INFLATION RATE OF 7.6% FOR THE CPI-E IS LOWER THAN THE 8.6% RATE FOR THE CPI

Upper Earners Hold Most Savings On Hand – Consumer Behavior

Consumers are now saving less than before the pandemic, as stimulus assistance funds
and generous unemployment benefits have gradually evaporated, encouraging consumers to tap their
savings at an accelerating pace. The drop in savings has been especially prolific for those nearing
retirement. As markets have pulled back, so have retirement fund values, elongating the retirement
threshold for many.

Savings rates rose dramatically in 2020 as billions of dollars in stimulus relief payments
made their way into consumer accounts. Federal Reserve data found that households
spent only 40 percent of their payments, used 30 percent to pay down debt, and saved
about 30 percent on the initial round of stimulus payments. The spectacular rise in the
savings rate to nearly 34 percent in April 2020 was a validation of how much of the
payments went towards savings.

As additional relief programs along with
generous unemployment benefits became
effective, the savings rate remained
elevated through the end of 2021. The most
recent data show that the savings rate
dropped to 5.4 percent in May 2022, lower
than where it stood at roughly 7.5 percent
before the pandemic began.

A Fed analysis found that lower-income households tend to spend most if not all of their income and end
up having very little disposable income at the end of each month. Most lower-income households have
already depleted their pandemic surplus funds in savings and are also being squeezed by inflation as food
and energy prices continue to escalate. This has led to upper-income earners holding the most savings on
hand, while lower-income savings begin to dwindle. (Source: U.S. Bureau of Economic Analysis, St. Louis
Federal Reserve Bank, Marginal Propensity to Consume Working Paper; Federal Reserve Bank of Boston)

Inflation Can Be Different For Those Over 62 – Retirement Planning

Data compiled by the government via the Bureau of Labor Statistics (BLS) maintains a separate tally of
inflation for people over 62. The rarely heard index, known as the CPI-E, is a variation of the traditionally
recognized CPI (Consumer Price Index), but with an emphasis on goods and services mostly used by those
over 62 years of age. This past month, the recent release of the CPI-E and the CPI revealed an inflation rate
of 7.6% for the CPI-E versus an 8.6% rate for the traditional CPI over the past year.

The CPI-E assigns a larger weight to senior-related
expenses such as medical services and housing,
and a lesser proportion to education and
transportation. The index was first created in 1987
when Congress directed the BLS to assist in
identifying inflationary pressures among senior
citizens. The index currently represents roughly
25% of all U.S. consumers. (Source: BLS)

 
ESTONIA AND LITHUANIA HAVE SEEN INFLATION EXCEED 20%

What Falling Labor Productivity Means – Labor Market Overview

The most recent data released by the Labor Department revealed the largest quarterly drop in productivity
since 1947, decreasing at an annualized rate of 7.5%. The drop in productivity was concurrent with the
largest rise in labor costs since 1982. Both of these measures are also indicators of inflationary pressures
for both companies and consumers. Many companies have been passing along higher costs to consumers,
but can only do so for so long until competition forces companies to hold prices steady and absorb higher
costs. This can also lead to decreased levels of hiring and lower wages as companies struggle to maintain
profitability levels.
Data surrounding labor during the pandemic has been
considered unreliable and inconsistent by many economists,
meaning that the true effects of the COVID-19 pandemic and
worker retention are still not certain. An essential data set is
labor productivity, which is a measure of how efficiently
companies are utilizing workers to produce products and
services. This past month, the largest fourth quarter drop in labor productivity since 1993 was observed,
according to the Bureau of Labor Statistics, marking a historic decline in productivity.
Federal Reserve survey results, reported in the Fed’s Beige Book, have identified that a growing number of
manufacturers and industrial companies are increasingly moving towards automation, replacing previously
desired workers with robotic gear. Rising wages and a dwindling labor pool have forced some companies to
resort to machines instead of hiring workers. (Sources: Labor Department, Federal Reserve Beige Book;
https://www.federalreserve.gov/monetarypolicy/files/BeigeBook_20220601)

Inflation Varies From Country To Country In Europe – European Inflation

A tremendous surge of inflation has encompassed European countries as a result of the Russian invasion
of Ukraine. Essential energy and food products that have for years been imported from Russia and Ukraine
have elevated overall prices throughout Europe. Natural gas, petroleum, and numerous energy products
have risen roughly 42% in the past year, hindering economic growth and consumer sentiment in the 27-
member European Union (EU).

Overall inflation for the 27 countries making up the EU rose
8.6% in the past year, essentially identical to the inflation rate
in the United States. The Harmonised Index of Consumer
Prices, which measures inflation in the EU, saw the EU’s
inflation rate reach its all-time high in May of this year at 8.8%.
This figure is more than four times the EU’s average inflation
rate from 2000 to 2022, which was at a stable 2.03% and even
reached lows of -0.6% in 2015. Inflation has also been exceptionally harsh for Estonia and Lithuania, where
inflation has exceeded 20%. Supply constraints, energy costs, and imported foods have been among the
primary drivers of inflation in the EU.

Source: Eurostat; https://ec.europa.eu/eurostat/documents/2995521/14644614/2-01072022