
Stock Indices:
| Dow Jones | 42,270 |
| S&P 500 | 5,911 |
| Nasdaq | 19,113 |
Bond Sector Yields:
| 2 Yr Treasury | 3.89% |
| 10 Yr Treasury | 4.41% |
| 10 Yr Municipal | 3.31% |
| High Yield | 7.26% |
YTD Market Returns:
| Dow Jones | -0.64% |
| S&P 500 | 0.51% |
| Nasdaq | -1.02% |
| MSCI-EAFE | 17.30% |
| MSCI-Europe | 21.20% |
| MSCI-Pacific | 10.50% |
| MSCI-Emg Mkt | 8.90% |
| US Agg Bond | 2.45% |
| US Corp Bond | 2.26% |
| US Gov’t Bond | 2.44% |
Commodity Prices:
| Gold | 3,313 |
| Silver | 33.07 |
| Oil (WTI) | 60.79 |
Currencies:
| Dollar / Euro | 1.13 |
| Dollar / Pound | 1.34 |
| Yen / Dollar | 144.85 |
| Canadian /Dollar | 0.72 |
Macro Overview
Trade and tariffs disrupted markets in June as the U.S. Commerce Department announced tariffs on $250 billion worth of Chinese imports. The 25% tariffs will be imposed on 1,300 items encompassing a variety of products including aluminum, iron, gas turbines, snow blowers, milking machines, and dental drills.
A flattening yield curve, characteristic of rising short-term rates along with lingering long-term rates, startled fixed income markets. Higher interest rates reflect expectations of inflationary pressures and robust growth, while lower rates imply less inflation and dismal economic expansion. As expected by economists and the markets, the Federal Reserve raised its short-term key policy rate, the federal funds rate, by 25 basis points to 1.75% – 2.00%. The gradual rise in rates is seen as a normalization of interest rates as the U.S. economy continues to expand. The Fed is accelerating the rate of tightening with increases slated for 2019 and 2020 now expected to occur in 2018 and 2019.
Reports from various Federal Reserve district banks reveal that a robust economy, growing tariff pressures, rising wage costs, and a tight labor market are contributing to consumer inflation. The Atlanta Federal Reserve’s economic growth model, GDPNow, estimates GDP growth for the second quarter of 2018 at 4.5%, adding to inflationary pressures. The Fed also reported that household wealth reached $100 trillion for the first time ever, double of where household wealth was at the lows of the financial crisis in 2009.
 The Supreme Court ruled in June that public sector unions cannot charge fees to government employees who do not support the union and who do not want to pay. The decision is expected to further weaken the influence of unions, which have been in a decades-long decline.
Volatility in the second quarter didn’t deter equity indices, as the S&P 500 was up 2.9% and the Dow Jones was up 0.7%. The tech heavy Nasdaq advanced 6.3% for the quarter, driven by buyers seeking shelter from the imposed tariffs. A stronger U.S. dollar is starting to weigh on the technology sector as earnings may become affected.
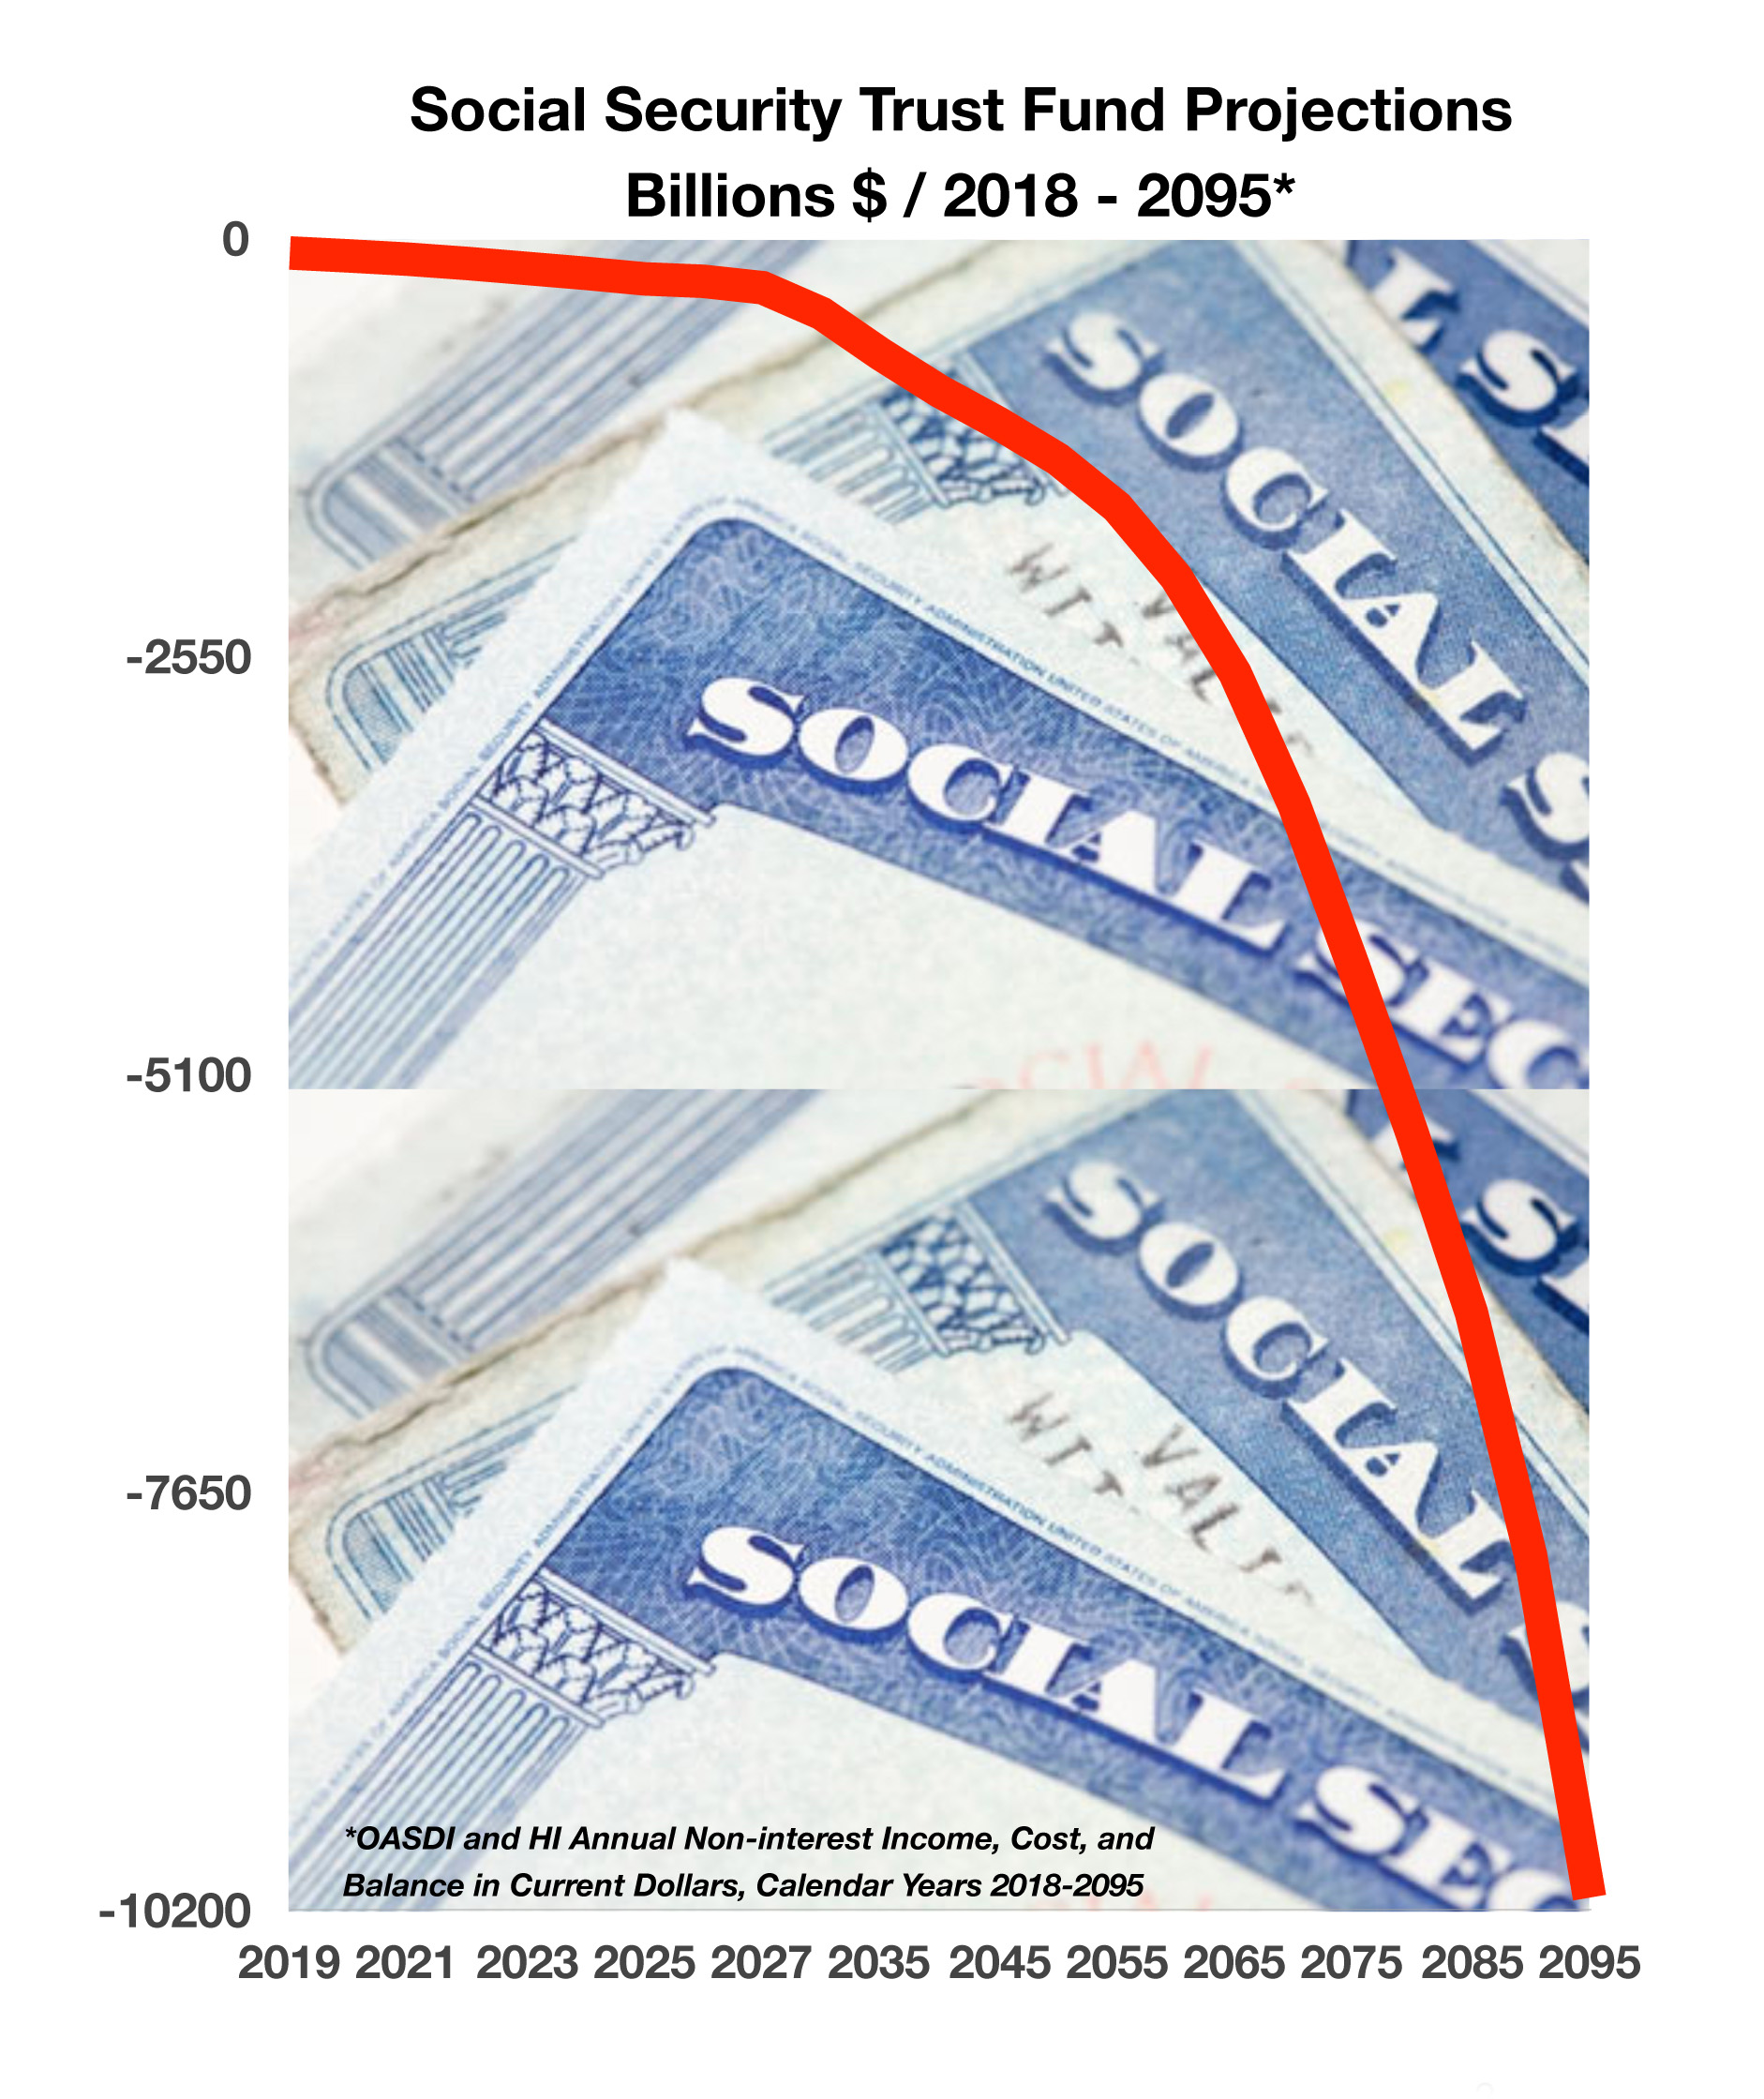
The Social Security program’s cost will exceed its income this year for the first time since 1982, forcing the program to access a $3 trillion trust fund to cover future benefits. It is estimated that the trust fund will be depleted by 2034, meaning that Social Security recipients may no longer be receiving full scheduled benefits. (Sources: U.S. Commerce Dept., Federal Reserve, U.S. Treasury, https://www.supremecourt.gov, Bloomberg, S&P,Dow Jones, Nasdaq, Social Security Admin.)
 8-year low.
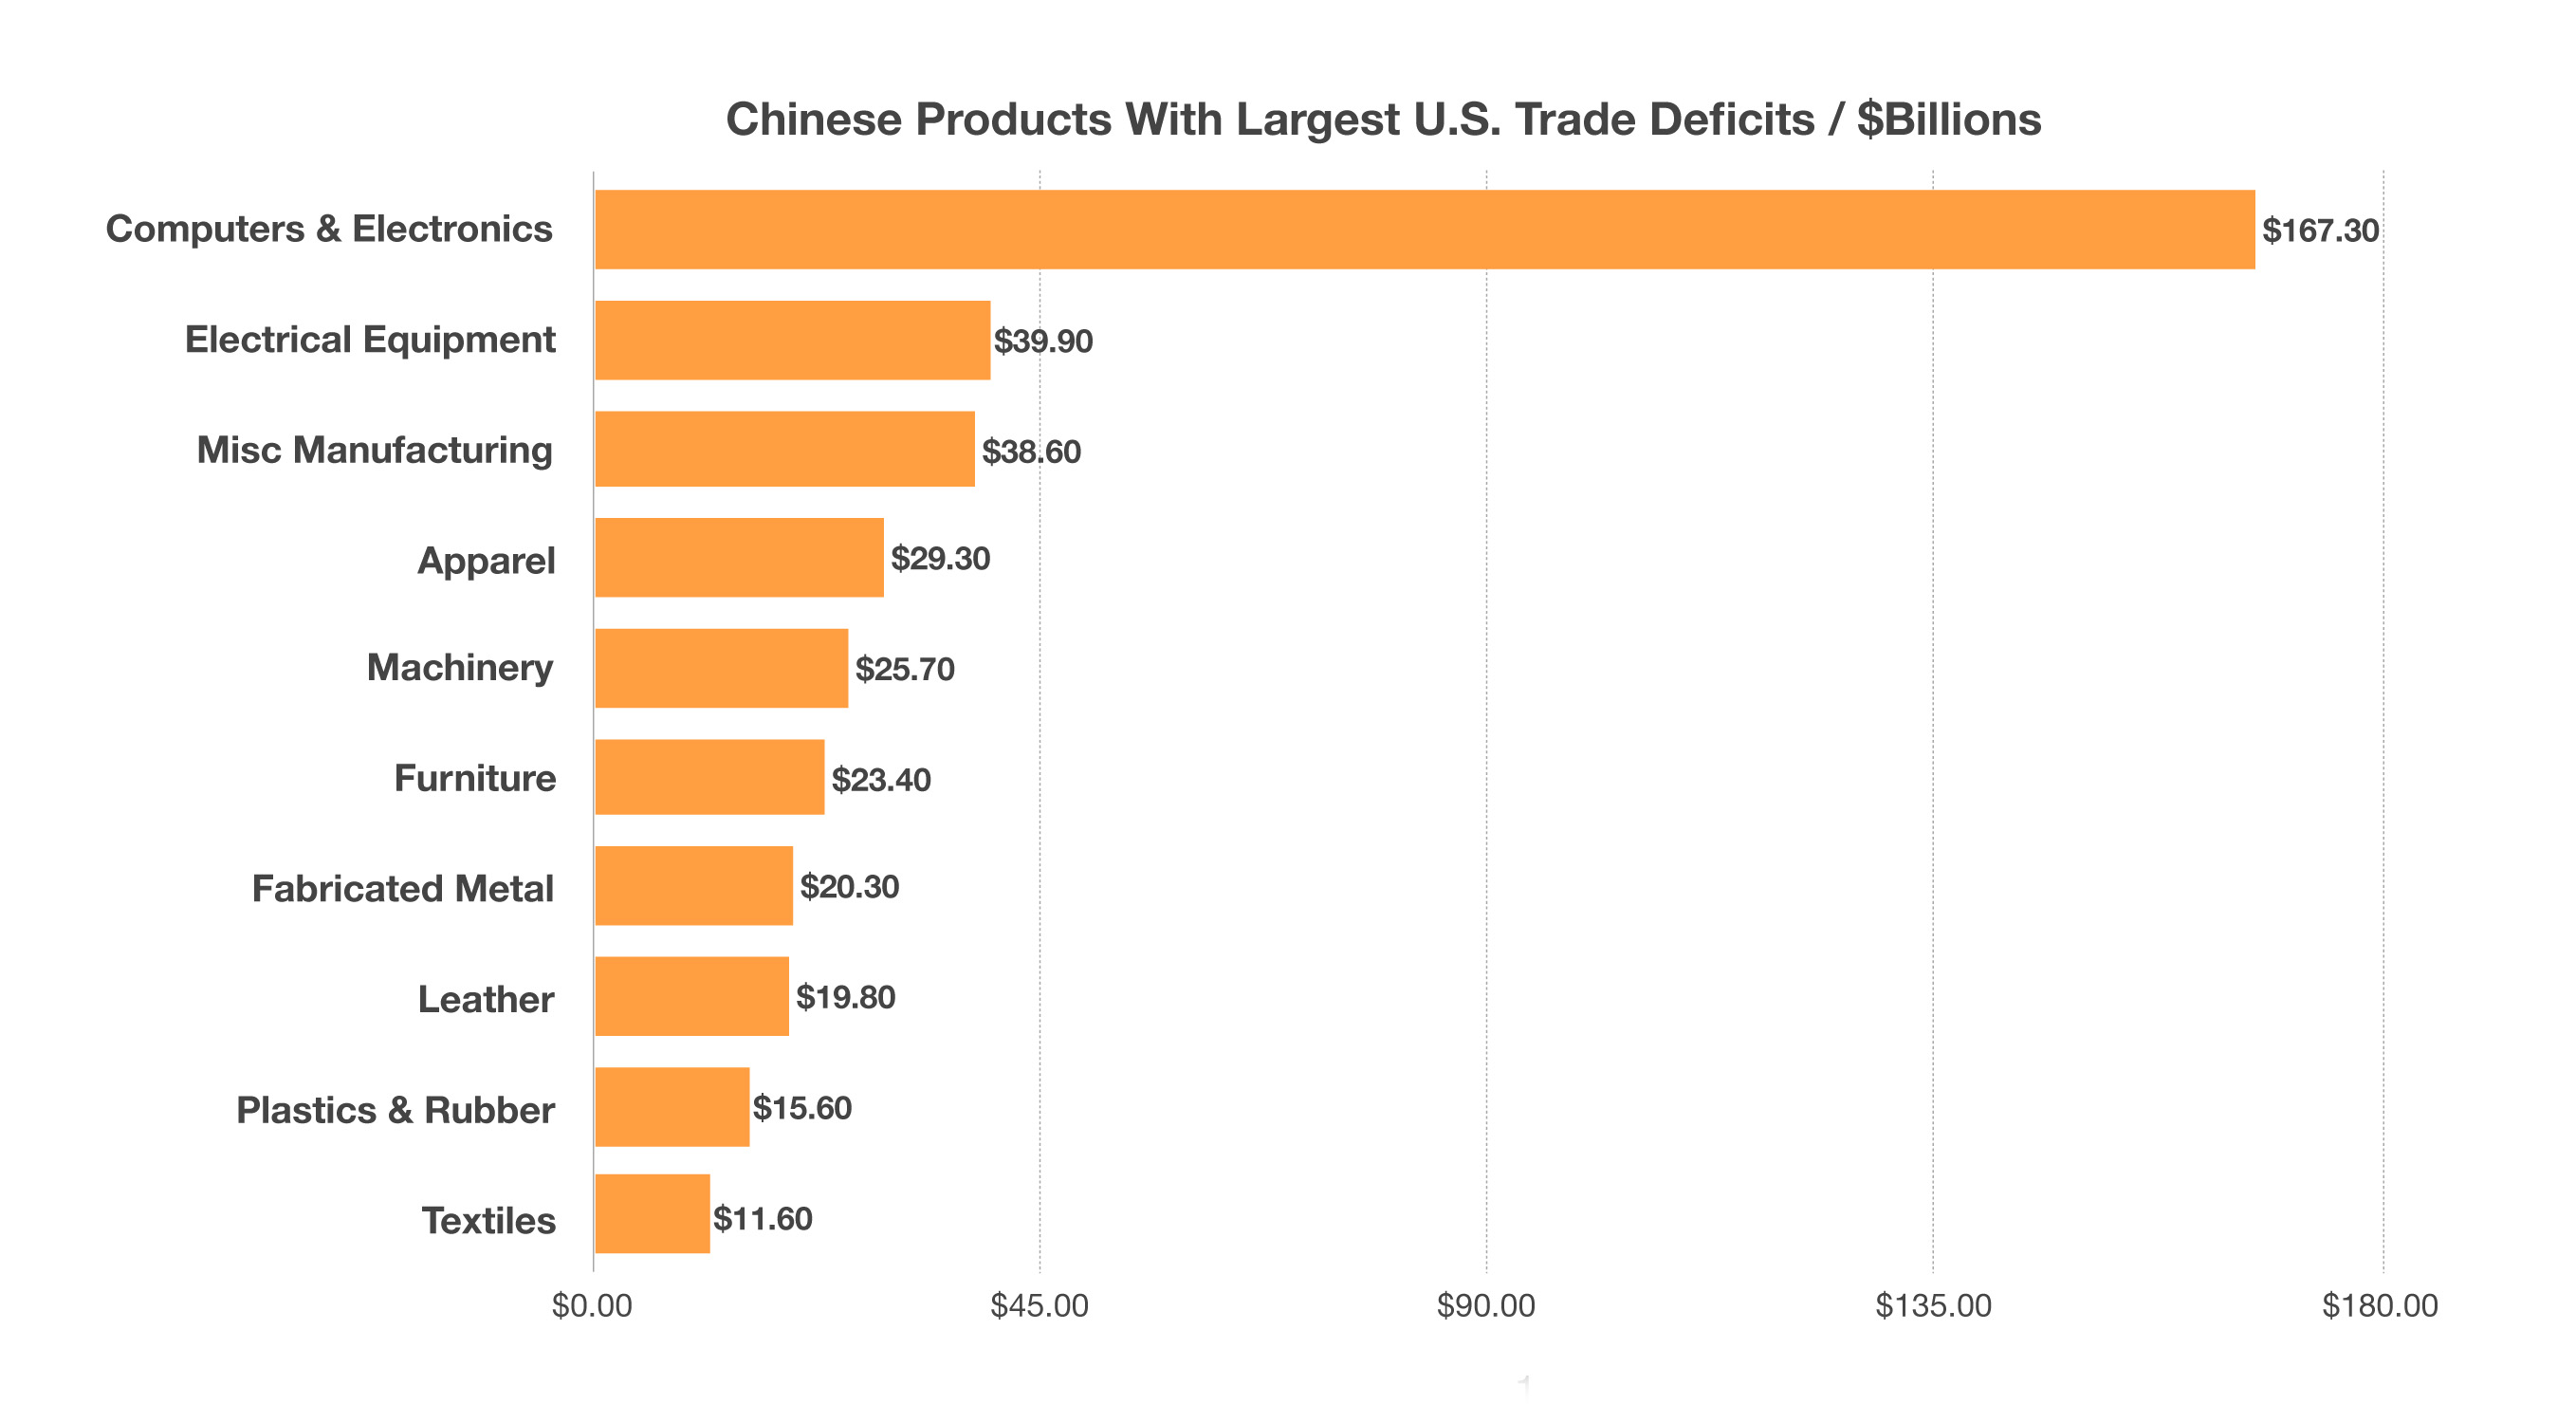
 Foreign manufacturers have skirted tariffs and manufacturing rifts over the years by having certain products assembled in the United States, but comprised of imported components. Hence the controversial tag noting “assembled in the USA”, which many consumers and consumer groups have found to be misleading. (Sources: U.S. Department of Commerce)