2Q19 Newsletter
Market Update
(all values as of 06.28.2024)

Stock Indices:

Dow Jones 39,118
S&P 500 5,460
Nasdaq 17,732

Bond Sector Yields:

2 Yr Treasury 4.71%
10 Yr Treasury 4.36%
10 Yr Municipal 2.86%
High Yield 7.58%

YTD Market Returns:

Dow Jones 3.79%
S&P 500 14.48%
Nasdaq 18.13%
MSCI-EAFE 3.51%
MSCI-Europe 3.72%
MSCI-Pacific 3.05%
MSCI-Emg Mkt 6.11%
 
US Agg Bond -0.71%
US Corp Bond -0.49%
US Gov’t Bond -0.68%

Commodity Prices:

Gold 2,336
Silver 29.43
Oil (WTI) 81.46

Currencies:

Dollar / Euro 1.06
Dollar / Pound 1.26
Yen / Dollar 160.56
Canadian /Dollar 0.73

Macro Overview

A change in the Federal Reserve’s stance on the direction of interest rates helped buoy equity and bond prices higher in March, allowing U.S. equity indices to post the strongest first quarter in nearly ten years.

The Federal Reserve scaled back its growth expectations for the U.S. economy and announced that it would hold rates steady with no additional rate increases this year. Economists interpreted the comments as a somber assessment of economic expansion, yet positively received by the equity and fixed income markets. The Fed mentioned trade disputes, slowing growth in China and Europe, and possible spillovers from Britain’s exit from the European Union were factors.

Short-term bond yields rose above longer term bond yields in March creating what is known in the fixed income sector as an inverted yield curve. Normally, short-term yields are lower than longer term yields, resulting in a normal yield curve. A persistent inverted yield curve would become more concerning should it linger for several quarters.

Concerns surrounding economic momentum in Europe became more prevalent as Europe’s central bank, the ECB, signaled that it would maintain interest rates below zero longer than anticipated. Slower growth in both exports and imports have been implying a slowdown throughout the EU, which is comprised of 28 European countries. The pending outcome on how and when Britain finally exits the EU is also adding duress to Britain’s trading and
business partners all over Europe.

Chinese government data revealed that exports heading to other countries worldwide fell over 20% in the past year. Data also showed that imports had fallen into China, realizing that Chinese consumers were scaling back demand from prior months.

Congressional leaders are considering legislation that would repeal the current age cap of 70.5 for contributing to IRAs as well as increase the required minimum distribution age for retirement accounts from 70.5 to 72. Such legislation, if passed, would be the most significant change to retirement plans since 2006. (Sources: Federal Reserve, Dept. of Labor, IRS, Treasury Dept., ECB)

Lower Rate Outlook & Trade Talks Elevate Stocks In First Quarter – Equity Overview

Optimism over progress on U.S. trade discussions with China seemed to overshadow concerns about a slowing economic expansion helping to propel equity indices towards the end of the third quarter.

Gains were broad for the S&P 500 Index with all 11 sectors ending higher for the first quarter, which has not occurred since 2014. Technology and energy stocks were among the best performing sectors for the quarter, encompassing a broad scope of industries and companies. A counterintuitive environment has driven stocks higher while the bond market is signaling slower growth. Some analysts are expecting a slowdown in corporate earnings growth as global demand projections have been trimmed. (Sources: S&P, Bloomberg, Reuters)

 
HEALTH HAS AFFORDED MANY THE ABILITY TO CONTINUE EMPLOYMENT INTO THEIR 60S & 70S

Inverted Yield Curve Puts Rates On Hold – Fixed Income Overview

The yield on the 10-year treasury fell to 2.41% at the end of March, down from its peak yield of 3.25% in
October 2018. The Fed’s shift from a tightening mode to a hold mode is interpreted by some economists
and analysts as a lack of confidence in economic growth.
Treasury yields inverted further as the 6-month treasury note yielded more than the 7-year treasury bond
in March. Inverted yields mean that shorter term rates are higher than longer term rates, translated by
markets as minimal economic expansion and inflation expectations.
A sustained inversion becomes more concerning should it linger for several quarters. Some are even
expecting a rate cut later in the year, if not in 2020, should economic data shed dismal projections.
Negative yields on some European government bonds reflect minimal growth expectations with subdued
inflation throughout the EU. An inverted yield curve in the U.S. may partially be the result of slowing
economic expectations in Europe and internationally.
The yield curve has been fairly flat over the past few months, meaning that the yield on shorter term bonds
have been similar to the yield on longer term bonds. This dynamic created some uncertainty for the Fed,
making it difficult to determine whether to raise rates or keep them the same.
Many believe that a divergence between stock prices and bond yields has evolved, where bond prices have
risen concurrently with stock prices. Stocks historically head lower when bonds prices head higher in
anticipation of slowing economic activity or lingering uncertainty. (Sources: Eurostat, Treasury Dept.,
Federal Reserve)
Workforce Getting Older – Labor Demographics

Demographics drive the domestic labor force propelled by both young and unskilled workers to older more
seasoned individuals. For decades, the baby boom generation commanded the nation’s workforce,
representing the single largest age group to hold jobs across all industries and sectors. As those same
workers have aged, a younger generation has assumed some of the gaps left by retiring boomers.
Over the years, Labor Department data found that those aged 16-24 have been making up a smaller
portion of the workforce. The Department projects that by 2026, only 11.7% of the labor force will be
comprised of 16-24 year olds, compared to 15.8% in 1996. Workers aged 25-54 are expected to make up
the bulk of workers, representing over 63% of the nation’s labor force, down from 72.3% in
1996. Department of
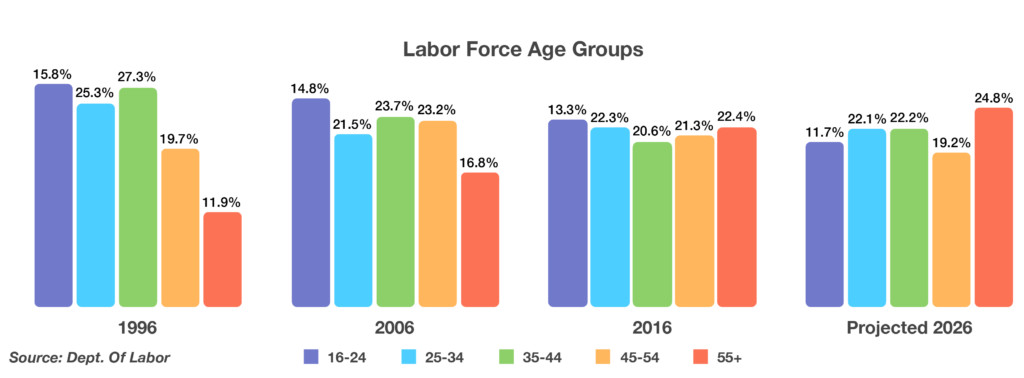
Labor data revealed that over a thirty year
period, those aged 55 and older will encompass 24.8% of the labor force in
2026, a stark increase from 11.9% in 1996. As American workers have aged over the decades, longer life expectancy and healthy lifestyles have afforded many the ability to continue employment well into their 60s and 70s. (Source: Department of Labor)

 
IRS IS EXPECTED TO REDUCE THE NUMBER OF TAXPAYERS SUBJECT TO PENALTIES BY 25% - 30%

IRS Gives Taxpayers A Break On Penalties – Tax Planning

The IRS issued some reprise resulting from underpayment on withholdings for 2018 taxes. Penalties have been waived for taxpayers in the past that underpaid on their taxes by no more than 90%. The IRS has lowered the threshold to 80%. The modifications enacted by the IRS is expected to reduce the number of
taxpayers subject to penalties by 25% to 30%. Taxpayers that have already filed their returns are still eligible for a waived penalty by filing Form 843.

Updated federal tax withholding tables released in early 2018 largely reflect lower tax rates and increased standard deductions passed under the new tax laws. This generally meant that taxpayers had less withheld in 2018 and saw more in their net paychecks. The problem arose when withholding tables couldn’t fully factor in other changes such as suspension of dependency exceptions and reduced itemized deductions. As a result some taxpayers ended up paying too little during the tax year, failing to revise their W-4 withholdings to include larger tax payments. This is where the penalties have primarily been imposed. Because the U.S. tax system is a pay-as-you-go system, taxpayers are required by law to pay most of their taxes during the year rather than waiting until the end of year. This can be done by either having taxes withheld from paychecks or by making estimated tax payments on a quarterly basis. (Sources: www.irs.gov/newsroom/irs-waives-penalty)

What Britain Leaving The EU Means – Brexit Overview

Turbulent and politically charged challenges between the British government and Parliament have resulted in numerous failures to finally execute Britain’s departure from the EU, known as Brexit.

The significance of Britain exiting the EU may eventually be substantial as other countries may decide to cast similar votes whether or not to leave the EU. Several of the existing members are anxiously awaiting the outcome of Brexit to determine how challenging both politically and economically it may be. As of the end of 2018, Britain represented roughly 13% of the EU’s total GDP, ranking second in terms of GDP after
Germany.

The EU (European Union) was established following the end of WW II in order to offer financial and structural stability for European countries. Since its establishment, the EU has grown to a membership of 28 countries abiding by various rules and policies set forth by the EU Council. One of the responsibilities of
member EU countries is to accept and honor immigrants and citizens from other EU countries as part of the human rights initiatives recognized by the EU. Immigration has been a topic of contention among various EU countries for some time. This was a decisive factor for Britain leaving the EU since its economy
and cities have been inundated by foreign-born immigrants seeking jobs and a better quality of life.

Since Britain has been part of the EU since 1973, it is expected that the unraveling of British ties from the EU could take years. Contracts,employees, and laws will all have to be revised, reshuffled, and rewritten in order to accommodate the divorce between the two.

Now that the British have decided on leaving the EU, many believe that another referendum could possibly be presented in France and other EU countries. The concern of a domino affect is very realistic, as several other EU members are experiencing similar frustrations as Britain. (Sources: EuroStat, EU Council


TOTAL STUDENT LOANS OUTSTANDING HAVE EXCEEDED $1.5 TRILLION

How Student Debt Affects Credit Scores – College Planning

As the cost of education has risen over the years, so has the reliance on student debt in order to help finance such expenses. The concern is that more and more students are graduating from college with large amounts of student debt and with no job intact.

The Fair Credit Reporting Act (FCRA) recognizes student debt as any other type of debt, equal to mortgage debt, auto loans, and credit card balances. Student loans can affect credit both positively and negatively. Since student loans have long repayment periods, consistent and timely payments can assist in building
and increasing credit scores. Having a mix of debt, such as a credit card, a car loan, and student loans can reflect positively as a broad mix of debt. Conversely, late payments and delinquencies on student debt can negatively impact credit scores and payment history.

Some parents and counselors are encouraging students to avoid excess student loans and to focus on applying for grants and scholarships instead. What is happening to much of student debt taken out is that parents and grandparents end up helping students make their debt payment. Data does show that some
college graduates end up carrying student loans well into their 30s, 40s, and 50s, burdening already strained finances and household expenses.

Student loan debt is now the second highest consumer debt held after mortgage debt, and higher than both credit cards and auto loans as tracked by the Federal Reserve. There are over 44 million borrowers nationwide of student loans, with an average balance owed of roughly $37,000. Student loans are held across a broad spectrum of the public, including all demographics and age groups in every state. Of growing concern are the amount of student loan delinquencies, which surpassed 10% of all student loans in 2018, with $31 billion in a serious delinquency status. Federal Reserve data reveals that the majority of borrowers have a loan balance of between $10,000 and $25,000, with 30-39 year olds holding most of the outstanding debt. (Source: Federal Reserve Bank of St. Louis)

 
485,000 WORKERS WENT ON STRIKE IN 2018...THE MOST SINCE 1986 Rates

Rates Hold Steady……For Now – Fixed Income Overview

The Fed intends to stop reducing its balance sheet this year, which influences the rise in rates, but still remains devoted to raising rates when economic data deems it. The markets interpret this strategy as a mixed signal, whereas the Fed may be unsure as to what direction the economy may actually head. The yield on the 1-year Treasury has been trending higher than the yield on the 5-year Treasury, creating what is know as an inversion, perhaps indicating slower economic growth.

Global government yields dipped to their lowest levels in months, with the German 10-year bund (bond) reaching near zero percent and the Japanese 10-year government bond falling below zero percent. Nearly $11 trillion of global debt securities reached negative yields in February, representing a reaction to slowing global growth and the Fed’s current hold stance. (Sources: Federal Reserve Bank, U.S. Treasury) Stocks Post Early Gains – Equity Update The S&P 500 posted its best two-month start for the year since 1991, with the information technology, energy, and industrial sectors leading the index. Volatility was mostly absent in February following several weeks of heightened market swings that drove uncertainty. Stocks were bolstered by the expectations of a formalized China trade deal and the shift in stance by the Fed to hold off raising rates. Sentiment in Europe has become more uncertain as negative yields on various bonds have become negative, meaning that economic growth expectations have weakened. As a key trading partner, the European Union (EU) comprised of 28 countries, has become an integral component of U.S. trading activity. Some analysts have noted that prices may have risen faster than growth expectations over the past two months, meaning that there will be greater emphasis on earnings over the next few weeks. (Sources: S&P, Bloomberg, Reuters)

2018 Saw An Increase In Striking Workers – Labor Market Overview

As occupations and trades evolved over the decades in the United States, so have the workers that have been on strike. The Bureau of Labor Statistics monitors and tracks the number of idle workers on strike nationwide, known as work stoppages. For over 200 years, strikes in the United States have usually evolved
from a specific group of workers or labor group. This past year, educational service workers including teachers and office staff for schools, accounted for over 90% of all workers on strike in 2018. Other industries whose employees were
also on strike in 2018 included healthcare, hospitality, and information. Incidentally, 2018 saw the most number of workers strike since 1986. Workers in America have been going on strike since the days of the Thirteen Colonies. Among one of the nation’s earliest strikes was the chimney sweepers’ strike of 1763, which occurred in Charleston. Other significant strikes that happened during the 1700’s included tradesman such as tailors, printers, weavers, and river pilots. The 1800’s saw numerous occupational strikes as well, many of which have become obsolete, such as shoebinders, bookbinders, cigar makers, cloakmakers, and pullmen.(Source: BLS)

 
UNREIMBURSED MEDICAL EXPENSES MUST EXCEED 10% OF AGI IN ORDER TO DEDUCT

Europe Buys More From China Than It Does From The U.S. – International Trade

Over the years, Chinese exports have inundated not only the United States, but the European Union (EU) as well. Similar to the trade imbalances with the U.S., the EU also has trade imbalances with China. China has become a significant influence on the EU and its trading characteristics, garnering more trade expansion
than with the U.S. China is now the EU’s second-largest trading partner behind the United States, while the EU is China’s largest trading partner. The U.S. represents about 17% of the EU’s total trade, while China currently makes up about 15% of the EU’s total trade.

The EU, like the U.S., wants to ensure that trade with China is fair,
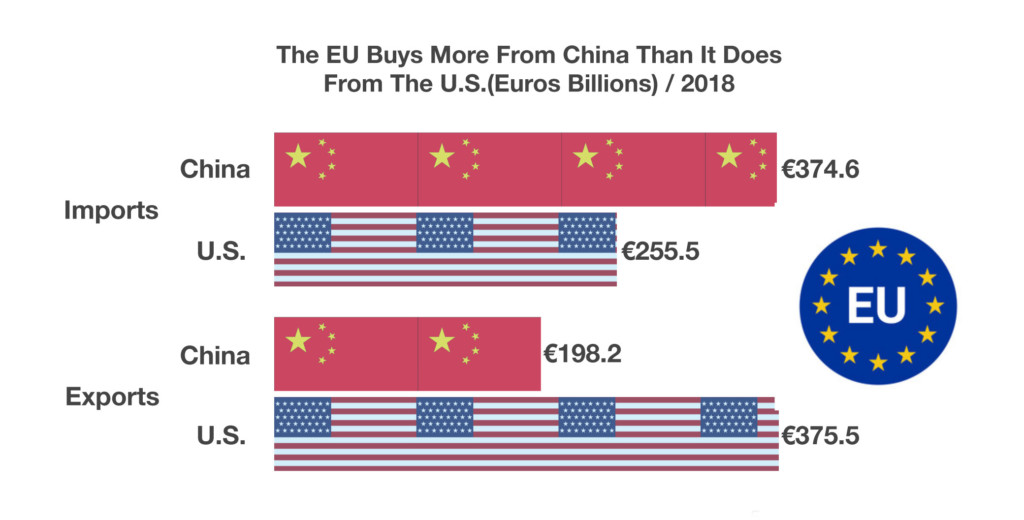
respects intellectual property and meets its obligations as a member of the World Trade Organization (WTO). The majority of the imports into the EU from China include consumer goods, machinery, shoes, and clothing. The bulk of exports from the EU to China are automobiles, planes, and chemicals. (Sources: U.S. Department of Commerce, EuroStat, CIA Factbook)

Tax Rule Changes To Be Aware Of When Filing – Tax Planning

This tax season is the first year where all of the changes and provisions passed under the Tax Cuts & Jobs Act are affecting both individual taxpayers and companies with broad changes for deductions and tax rates. The changes, effective January 1, 2019, affect most every tax payer filing as an employee or self-employed business owner. Some of the tax provisions enacted by the new tax act will be temporary, while others permanent. Affecting essentially every taxpayer is the increase in the standard deduction, which is meant to simplify the tax preparation process by replacing itemized deductions with a larger standard deduction.

A provision in the tax code known as indexing will affect 2019 Tax Brackets & Rates, which is essentially an inflation adjusted modification to account for rising inflation trends. For 2019, income brackets increased by roughly 2% across all income levels. Income brackets for capital gains have also increased slightly for 2019. With personal exemptions eliminated under the new tax law, a larger single standard deduction was devised in order to streamline returns for taxpayers. Standard deduction amounts increased slightly for 2019. For both employees and self-employed individuals, IRA and Qualified Plan contributions have increased as well for 2019.

Other significant changes occurring for 2019 include:

Estate Tax Exemption increases from $11.18 million to $11.40 million in 2019.; Elimination of the ACA penalty for not having health insurance becomes effective ; Unreimbursed medical expenses must exceed 10% of AGI in order to deduct; Alimony is no longer deductible for the payor and no longer taxable for the recipient for divorce decrees issued after December 31, 2018.(Sources: https://taxfoundation.org, IRS.gov

 
IT IS ESTIMATED THAT NEW DEBT ISSUANCE FOR 2019 WILL BE $ 1.4 TRILLION

Global Uncertainty Drives Demand For U.S. Treasuries – Fiscal Policy

The prospect of an increasing deficit has led to an increase in debt issuance by the Treasury due to an expected shortfall of tax revenue. The Treasury issues debt in order to fund the ongoing operations of the U.S. government. Some of the recent tax measures passed by Congress are expected to reduce revenues while increasing spending, which will in turn be funded by issuing new Treasuries. The debt management process is comprised of both the issuance of new debt and the retirement of preexisting debt. Should the Treasury issue more debt than it is retiring, there is a net increase in the amount of debt outstanding. Over the past 18 years, the Treasury has issued an average of $505.4 billion of debt each month, while also retiring or simply paying off an average of $454.8 billion every month. This deficit has been a subject of constant political debate. A heightened supply of Treasuries follows tax cuts and in

creased government spending, along with growing entitlement payments and higher service costs for government debt. The Treasury Department’s total net new issuance in 2018 amounted to $1.34 
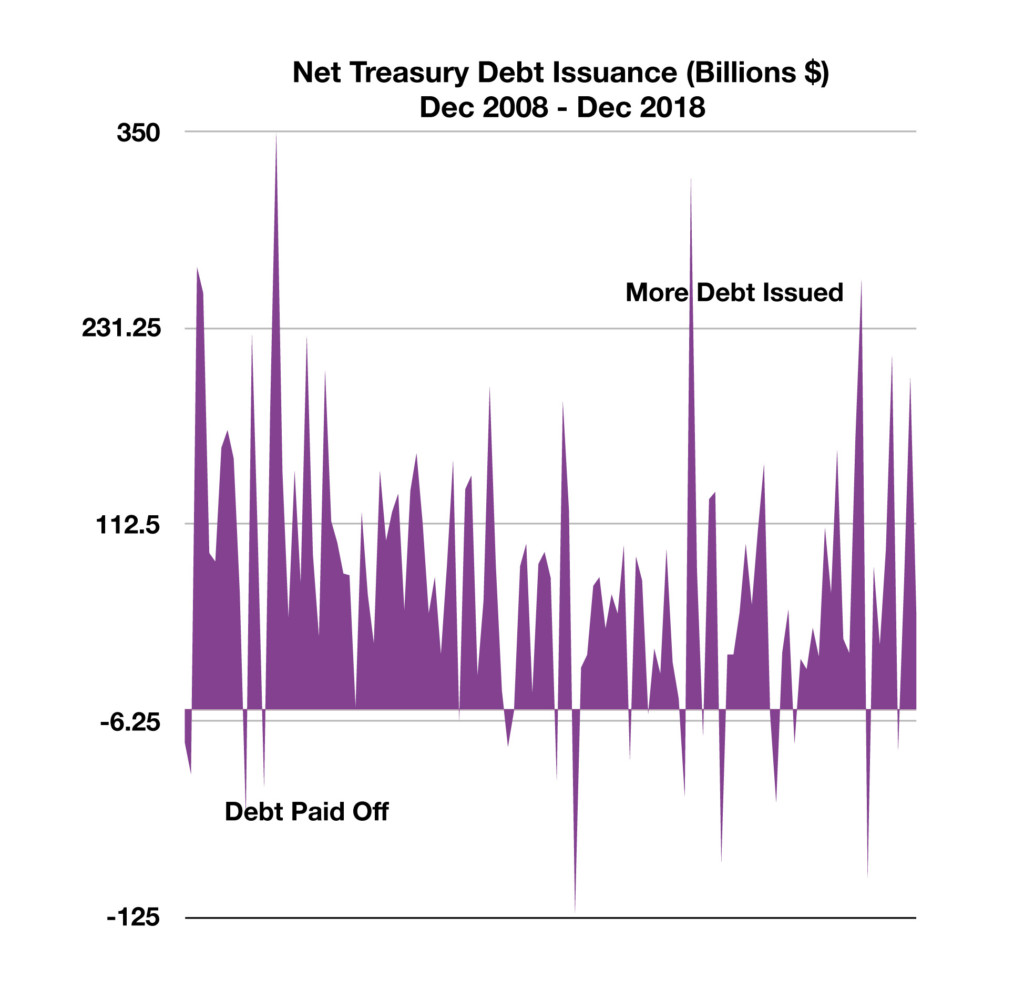
trillion, more than double the 2017 level of $550 billion. It is estimated that new debt issuance for 2019 will be $1.4 trillion, then range from $1.25 trillion to $1.4 trillion over the next four years. Despite the increased flood of new government debt supply, demand has surprisingly kept up as an insatiable demand from abroad continues to drive investors to the liquid and transparent market of U.S.government debt.(Sources: U.S. Treasury Department)


Consumers Opt For Auto Loans Rather Than Mortgages – Consumer Credit

Data released by the Federal Reserve Bank of New York found that Americans have been borrowing more for automobiles and less for homes. While new mortgages fell to their lowest levels since 2014, car loans have been steadily increasing. A weakening housing sector along with tepid wage growth has affected mortgage demand over the past few quarters. Consumers who have been discouraged by a slowing housing market have instead
stayed put and purchased new home goods and cars with their improving credit.Auto loans have been making up a faster growing segment of consumer debt than mortgages. Mortgage loans still make up the single largest debt payment for consumers nationwide, with auto payments the second largest. (Source: fred.stlouisfed.org)