3Q Newsletter
Market Update
(all values as of 04.30.2024)

Stock Indices:

Dow Jones 37,815
S&P 500 5,035
Nasdaq 15,657

Bond Sector Yields:

2 Yr Treasury 5.04%
10 Yr Treasury 4.69%
10 Yr Municipal 2.80%
High Yield 7.99%

YTD Market Returns:

Dow Jones 0.34%
S&P 500 5.57%
Nasdaq 4.31%
MSCI-EAFE 1.98%
MSCI-Europe 2.05%
MSCI-Pacific 1.82%
MSCI-Emg Mkt 2.17%
 
US Agg Bond 0.50%
US Corp Bond 0.56%
US Gov’t Bond 0.48%

Commodity Prices:

Gold 2,297
Silver 26.58
Oil (WTI) 81.13

Currencies:

Dollar / Euro 1.07
Dollar / Pound 1.25
Yen / Dollar 156.66
Canadian /Dollar 0.79
 

Macro Overview
The ongoing trade dispute between the U.S. and China escalated in May as the U.S. signaled that it had not finalized a deal yet with China. The lack of a deal led to the U.S. announcing an increase in tariffs from 10 percent to 25 percent on $200 billion of Chinese imports.

The U.S. Department of Commerce began assessing Chinese imports arriving at U.S. ports with a 25% tariff at 12:01 AM on June 1st. The tariff increase affects a broad range of imported products, including modems, routers, furniture, and vacuum cleaners. Additional tariffs were also proposed by The Office of the United States Trade Representative on essentially all remaining imports from China, valued at about $300 billion.

The proposed tariff increases by the United States caused China to retaliate against the U.S. with its own tariff proposals on U.S. goods including alcohol, swimsuits, and liquefied natural gas (LNG). The Chinese government may apply additional tariffs to more impactful products including food, energy and aircraft products from the U.S.

The recent market downturn has primarily been due to the uncertainty of the trade disputes and the effects of tariffs on the U.S. and international economies. Analysts believe that the equity market pullback along with the pending trade disputes have raised the possibility of an interest rate cut by the Federal Reserve later this year.

Longer term U.S. Treasury bond yields fell to their lowest levels since 2017. Combined pressures from the trade disputes to the pending Brexit turmoil in Europe has fostered increasing demand for U.S. Treasury bonds, which has resulted in higher bond prices.

The fixed income market is looking at the probability that economic weakness will lead to the Federal Reserve to actually cut interest rates sometime this year in order to bolster the U.S. economy. Many believe that the Fed needs to move quickly in order to shore up growth at the first sign of any economic contraction.

Mortgage rates fell below 4% for the first time since early last year helping to stabilize housing market activity. The average mortgage rate on a 30-year fixed conforming loan was 3.99% at the end of May, as tracked by Freddie Mac, the lowest since January 2018. Falling mortgage rates tend to entice buyers to sell their homes and trade up to larger homes with bigger mortgage balances, a boom for the housing market.

The most recent unemployment data revealed that unemployment unexpectedly fell to a 50 year low this past month to 3.6 percent, the lowest since 1969. Historically, a low unemployment rate tends to drive consumer confidence higher and act as a buffer during economic uncertainty.

Canada, Mexico, and the United States introduced legislation that would replace the North American Free Trade Agreement (NAFTA) and establish a new trade treaty among the three countries to be referred as the U.S.-Mexico-Canada Agreement (USMCA). Existing tariffs on steel and aluminum imports from Canada would be eradicated. Canada is the second largest foreign supplier of steel and aluminum to the United States. Sources: Dept. of Commerce, Treasury Dept., Freddie Mac, IMF

 
Macro Overview Continued

Stocks and bonds rose in June as lower rates drove equities higher and international diplomatic tensions elevated bond prices. Indications by the Fed that there may be a rate cut later in the year helped sustain stock prices near record levels.

The G20 met in Osaka, Japan, at the end of June where trade tensions between the U.S. and China were on the forefront of global concerns. The U.S. and China reached a temporary truce over the trade war as the leaders from both countries agreed to re-start negotiations that had fallen apart earlier on. The de-escalation of trade tensions between the two countries led to heightened optimism surrounding global economic growth. Central banks from around the world will weigh as to how much a trade truce or settlement might impact other economies globally.

The 10-year Treasury bond yield fell to 2.00% at the end of June, with several bond analysts expecting it to fall below the psychological 2.00% level. Yields dropped lower in Europe with Austria issuing 100-year government bonds with a yield of 1.17%. Highly rated, positive yielding government bonds are in enormous demand globally as investors seek income from viable and reliable sources.

Mortgage rates dropped again in June to 3.73% on a 30-year fixed conforming loan, helping to sustain the housing market. The low rate environment has also fostered an inexpensive source of capital for U.S. and international companies, allowing for expansion and hiring as demand reappears.

Commodity prices including oil, gold, and iron ore all elevated in the first half of 2019, with most of the gains occurring in June. Rather than a traditional sign of inflation, falling inventories of oil and iron ore have pushed prices higher as demand has remained constant.

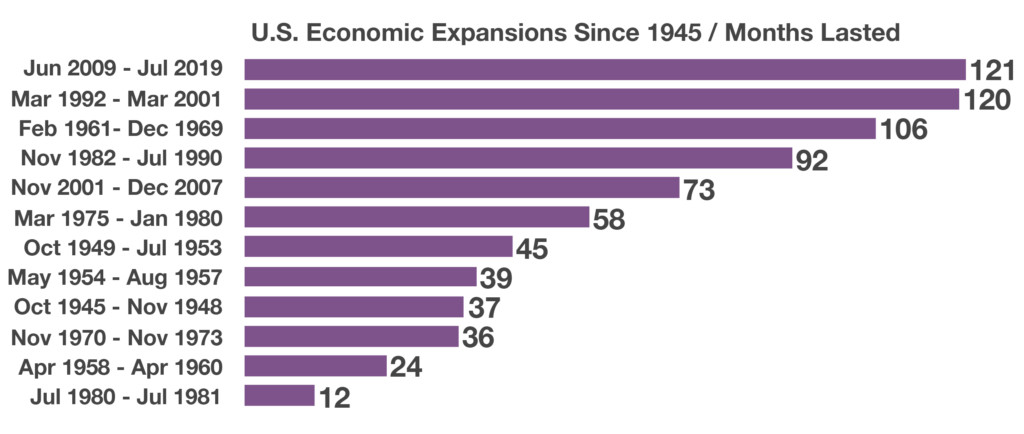
The U.S. Bureau of Economic Analysis found that the current economic expansion is the longest on record since 1945. The economic expansion that began in June 2009, following the depths of the financial crisis, has now lasted 121 months as of the end of June. The second longest economic expansion lasted 120 months, running from March 1992 until March 2001 when the dot-com bubble burst. There have been 12 economic expansion periods since the end of World War II in 1945 lasting 12 months or longer. (Sources: BEA, Freddie Mac, U.S.Treasury, g20.org, Bloomberg, Federal Reserve)

 
$10.6 TRILLION WORTH OF GLOBAL DEBT IS NOW IN NEGATIVE YIELDING TERRITORY

Rates Drop Rapidly Amid Inverted Yield Curve – Fixed Income Update
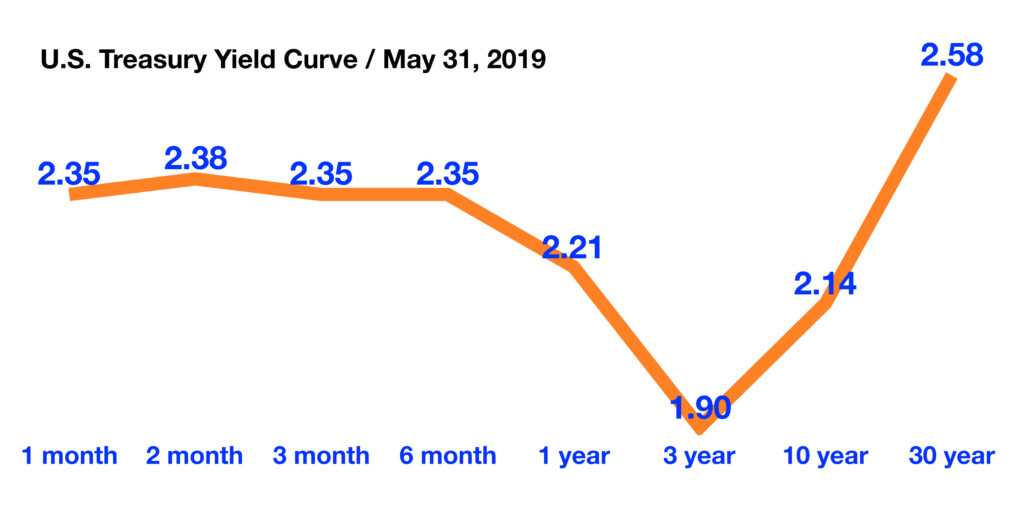
Markets tend to look at the yield curve in order to find clues as to what the expectations are about future economic growth and inflation. The yield curve is essentially the current yield on government Treasury bonds from 3-month maturities to 30-year maturities. At the end of May, the 1, 2, 3, 6 month and 1-year notes all yielded more than the benchmark 10-year bond. When shorter term bonds are yielding more than longer term bonds, it is known as an inversion or inverted yield curve.

Economically sensitive copper and oil prices fell in May, perhaps signaling weaker global growth activity. Such dynamics in the commodities market tends to push yields lower internationally. Some analysts believe that a continued escalation of trade disputes with countries in addition to China will crimp global economic growth and force the Federal Reserve to lower interest rates.

Total global debt as of the end of 2017 was $184 trillion, as monitored by the International Monetary Fund (IMF). Global bond yields fell in May with an estimated $10.6 trillion worth of debt now in negative yielding territory, the highest since 2016.

Some fixed income analysts are projecting lower yields later this year due to slowing economic expansion, continued demand for U.S. government debt, and an increasing probability that the Fed will eventually lower rates. (Sources: IMF, Treasury Dept., Federal Reserve)

Yields Drop Further In June – Fixed Income Update
The 10-year Treasury bond yield dropped below 2% for the first time since November 2016. The 10-year
Treasury continues to trade at a lower yield than the 3-month Treasury bill, signaling an inversion, which is
when shorter term maturity bonds yield more than longer term bonds. The Federal Reserve communicated
its confidence with the labor market and rising wages for lower paid workers as positive for the U.S.
economy, but noted that inflation is still mundane and below expectations. Its concern is slowing global
growth with anemic economic expansion in other parts of the world. Such concerns may lead to dismal
expansion with the need to eventually reduce rates to help prop up economic growth. (Sources: U.S.
Treasury, Federal Reserve)

 
THE USPS DELIVERED MORE THAN 146.4 BILLION OF MAIL IN 2018

Changes Proposed For 401k Plans & IRAs – Retirement Planning
This past month the House of Representatives passed the SECURE Act, which will introduce various changes to retirement plans including IRAs and 401k plans. The act was approved by the House in May and is expected to be approved by the Senate and become law relatively soon. One of the most significant revisions to IRAs introduced by the legislation is repealing the prohibition on contributions to a traditional IRA by an individual who has attained age 70 1/2. The legislation doesn’t propose a revised maximum contribution age, yet states that more Americans continue working beyond traditional retirement age. So essentially, there will no longer be an age limit on IRA contributions. A modification to 401k plans that will affect eligibility requirements for part-time workers is a major change. Longer term part-time employees will no longer be excluded from 401k plans, allowing part-time workers the ability to save and accumulate savings towards retirement. Annuity payments will become an option for retirees when leaving their job and taking their retirement savings. In addition to opting for a rollover of retirement assets to an IRA or other qualified plan, retirees will be able to choose annuity payments as well. The Required Minimum Distribution (RMD) age for IRAs will increase from age 70 1⁄2 to 72. This is beneficial for those retirees that don’t need the income from their IRAs or rollover IRAs until later, thus minimizing the tax liability on distributions that would have been required at age 70 1/2. Safe Harbor provisions will be simplified for 401k employer plans in order to facilitate plan administration as well as allowing greater flexibility to employers and employees. Such changes will eventually increase participation in employer sponsored retirement plans, an objective of the SECURE Act. (Source: House Committee on Ways & Means; https://waysandmeans.house.gov)

Here’s What The U.S. Buys The Most Of From China – Trade Overview
In the past twenty-plus years, China has evolved from a heavy equipment machinery exporter to a prominent leader in technology product exports. Large international conglomerates have established an enormous manufacturing presence throughout China, utilizing its cheap labor and quick turnaround times. China’s manufacturing plants are among the most modern in the world, producing large capacities almost entirely for export.

As the world’s appetite for electronic devices has grown, so has China’s ability to manufacture and export these devices. As a product exporter, China is able to manufacture and export finished products worldwide. In addition, China is also an exporter of components, which may be used in the manufacture and assembly of products in other countries, such as the United States. By exporting components in addition to finished products, China is able to hedge against tariff issues and labor costs should they become a factor. (Sources: WTO, IMF, U.S. Dept. of Commerce)
 
THE U.S. IMPORTED $93 BILLION WORTH OF VEHICLES FROM MEXICO IN 2018

What The U.S. Imports From Mexico – Trade Overview
The administration has proposed tariffs up to 25% on imported products from Mexico in order to stem
illegal immigration from the country. Some argue that imposing such a tariff would make certain imported
products more expensive for American consumers.

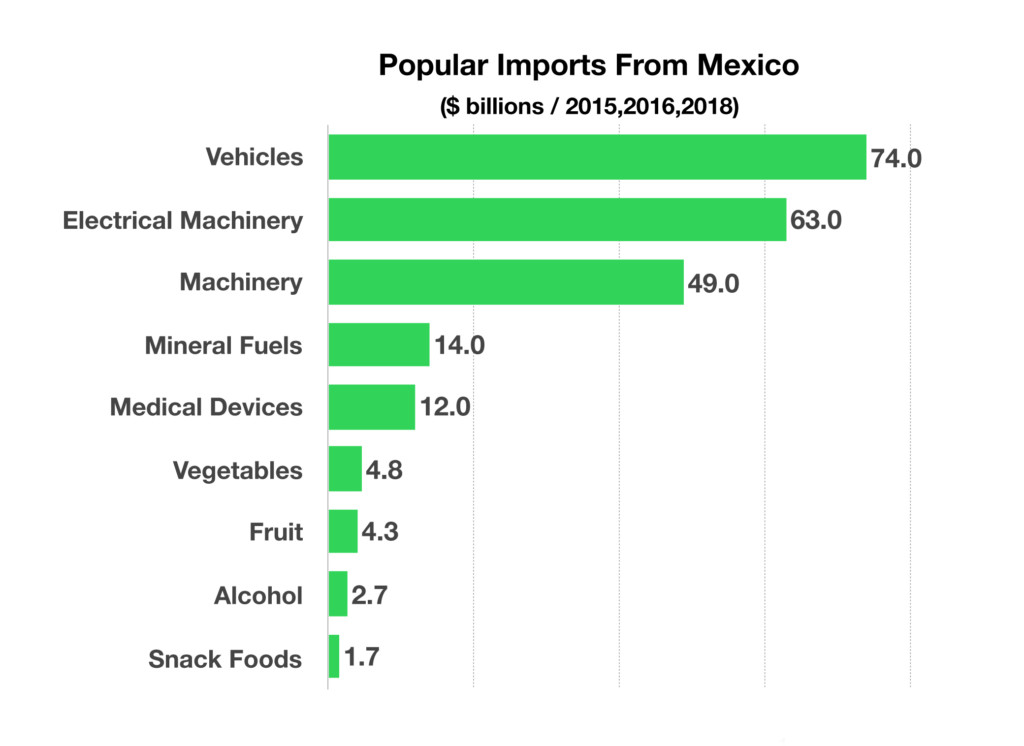
The U.S. imported $93 billion worth of vehicles from Mexico in 2018, with auto parts accounting for the
single largest type of product imported from Mexico valued at over $51 billion in 2016, making the
automotive industry an integral component of trade with Mexico. Interestingly enough, exports headed
from the U.S. to Mexico are primarily for use in the automotive industry, with machinery, fuels, and plastics
making up the largest portions.

Agricultural and food products imported from Mexico, such as vegetables, fruit, snack foods and alcohol, totaled over $17 billion in 2018. Mexico is currently the world’s largest exporter of beer, exporting $3.6 billion of the alcohol to the U.S. in 2018. Proposed tariffs on Mexican imports are expected not to take effect until June 10th in order to give Mexico ample time to respond or negotiate terms. (Sources: Dept. of Commerce, BLS, Office of the U.S. Trade Representative)

Stocks Rebound In June – Equity Overview

Stocks and bonds registered the first half of the year with formidable gains propelled by an expected rate cut by the Fed later in the year. It was the best first half of the year since 1997 for equities, with the Dow Jones Industrial Index, S&P 500 Index, and the Nasdaq nearing new highs.

Equities were also driven higher in June by a relief in trade tensions between the U.S. and China as the expectation that the Fed will eventually cut rates sometime this year. Historically, a low rate environment is favorable for equities in the form of inexpensive capital for expansion and loans.

The rebound in stock prices in the first half of 2019 from the turmoil that hindered markets in December 2018 has been one of the strongest rebounds in decades.

The Federal Reserve gave large U.S. banks the approval to repurchase their own shares and lift dividends, part of the Comprehensive Capital Analysis and Review process set in place by the Fed. Large money center banks as well as smaller regional banks were restricted from buying back their own shares as well as increasing dividends in order to fortify bank balance sheets following the financial crisis. (Sources: Federal Reserve, Dow Jones, S&P, Bloomberg, Reuters)

 
THE 10-YEAR TREASURY BOND DROPPED BELOW 2% FOR THE FIRST TIME SINCE NOVEMBER 2016

What Expenses Seniors Have After Retirement – Consumer Demographics
Demographics play a significant role in how much we spend and how we spend it. Spending is primarily dictated by age where different needs and life essentials change and evolve as consumers grow older. The challenge for many retirees now is the fact that we are all living longer, with U.S. life expectancy of 78.7 years as of 2018. As more Americans reach their 80s and 90s, medical and assisted living expenses become a much larger component. Housing, transportation and food are the three largest expenses incurred by all age groups. As consumers move from their late 20s into their 30s, we earn more money and families start to grow. Expenditures on transportation, health care and entertainment become prevalent as households grow with children. Education is also another significant expense for many younger families, where the average cost of higher education tuitions has steadily increased over the years.

As we earn more, we also tend to save more in our 30s, 40s, and 50s by contributing to 401k plans and retirement savings. At 70.5 years of age, Required Minimum Distributions (RMDs) kick in, imposing a tax on retirement savings, which reduces as withdrawals increase when we age each year. The biggest challenge most retirees have is trying to replace lost employment income with retirement savings and Social Security. A widely accepted rule of thumb is that one will need to replace anywhere from 70% to 90% of the income when still employed, in order to maintain the same standard of living.

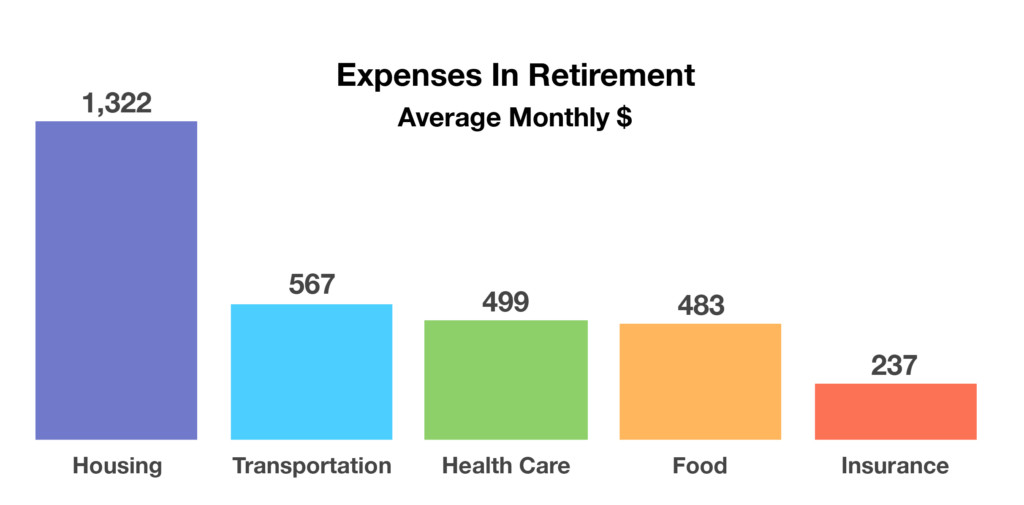
The Bureau of Labor Statistics has identified the largest expenses that seniors have once in retirement. Expenses such as housing, food, and transportation are based on what a retiree spends on average in various essential categories nationwide. Housing, transportation and health care are the three largest expenses for retirees as well as all other age groups. (Sources: Social Security Admin., U.S. Census)

 
IDENTITY THEFT AND STOLEN FUNDS ARE BECOMING A GROWING RISK

IRS Scams – Consumer Awareness of TD Ameritrade Phone Calls
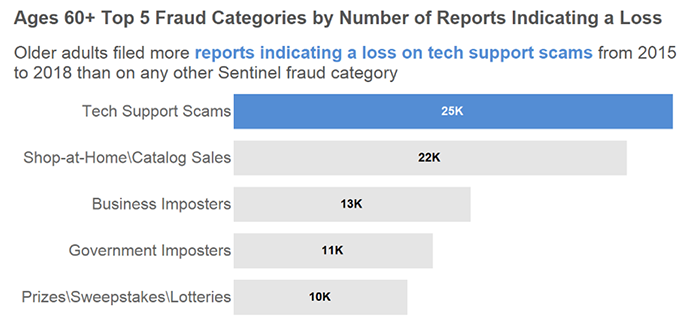
Identity theft and stolen funds are becoming a growing risk as thieves have devised clever methods of masking IRS communications. Various government entities have identified some of the most prevalent scams.

TD Ameritrade Scam: Fraudulent phone call appearing to come from TD Ameritrade will ask for your account number and then have you change your pin.

Refund Scam: Fraudulent emails, appearing to come from the IRS, notify you that you are eligible for a tax refund, but need to provide sensitive bank details in order to receive the funds.

Fund Scam: Inherited Funds, Lottery Winnings, & Cash Consignment Scams.

Email Scam: Emails claiming to come from the U.S. Department of Treasury, notify you that you will receive millions of dollars if you follow the instructions in the email.

SS Scam: An identity thief could use your social security number to fraudulently file a tax return and claim a refund. You could be completely unaware that your identity has been stolen until your return is rejected for e-filing or you get a notice or letter from the IRS.

Rejected e-File: An electronically filed return is rejected because the social security number belonging to you, your spouse, or a dependent has already been used on a tax return.

Suspicious IRS Items: You receive a fraudulent notice from the IRS stating that more than one return was filed in your name for the year.

You have a balance due, refund offset, or initiation of collection action for a year when you did not file.

IRS records indicate that you received wages from an employer you didn’t work for.

You should respond immediately to the name and phone number printed on the IRS notice or letter. You should also complete Form 14039, Identity Theft Affidavit. Do not give anyone your account numbers/social security numbers if they call you. (Source: IRS.gov, consumer.ftc.gov, treasury.gov).

 
DO NOT GIVE ANYONE YOUR SOCIAL SECURITY NUMBER OR ANY ACCOUNT INFORMATION

Here are things the to review and do to help protect your account information.

Electronic Security measures:

Other measures:

Research and Reporting sources: