Stock Indices:
| Dow Jones | 44,094 |
| S&P 500 | 6,204 |
| Nasdaq | 20,369 |
Bond Sector Yields:
| 2 Yr Treasury | 3.72% |
| 10 Yr Treasury | 4.24% |
| 10 Yr Municipal | 3.21% |
| High Yield | 6.80% |
YTD Market Returns:
| Dow Jones | 3.64% |
| S&P 500 | 5.50% |
| Nasdaq | 5.48% |
| MSCI-EAFE | 17.37% |
| MSCI-Europe | 20.67% |
| MSCI-Pacific | 11.15% |
| MSCI-Emg Mkt | 13.70% |
| US Agg Bond | 4.02% |
| US Corp Bond | 4.17% |
| US Gov’t Bond | 3.95% |
Commodity Prices:
| Gold | 3,319 |
| Silver | 36.32 |
| Oil (WTI) | 64.98 |
Currencies:
| Dollar / Euro | 1.17 |
| Dollar / Pound | 1.37 |
| Yen / Dollar | 144.61 |
| Canadian /Dollar | 0.73 |
Macro Overview
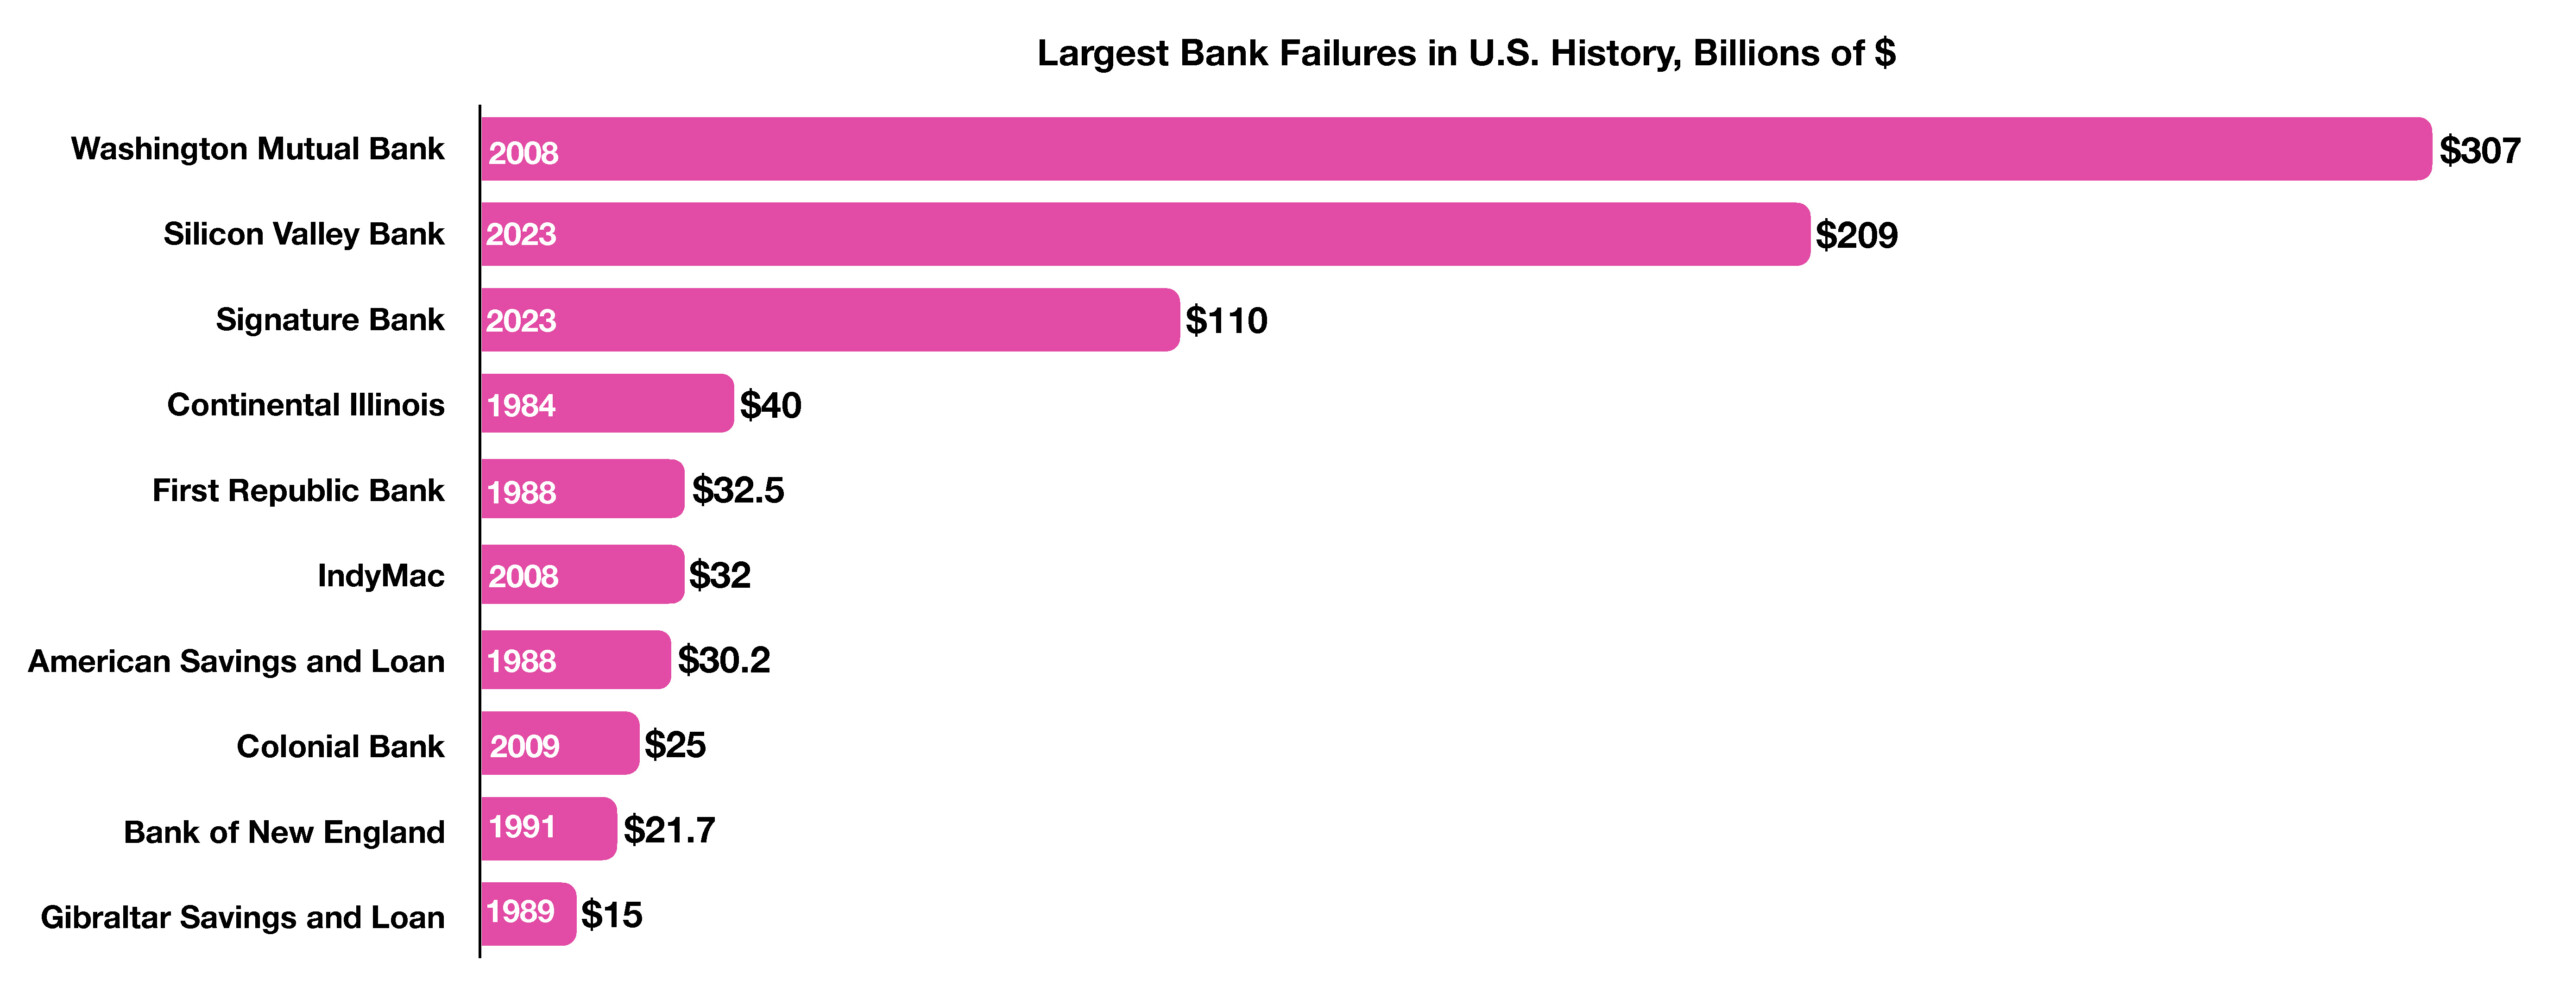
The failure of two regional banks unsettled equity and fixed-income markets in March. Financial contagion risks were at the front of mind, as the closure of Silicon Valley Bank and Signature Bank generated turmoil throughout the banking sector. The recent banking crisis may affect the Federal Reserve’s interest rate increase trajectory, as rapid rate increases were a contributing factor in triggering the banking mayhem.
Many bank analysts assess that the recent bank failures are more contained than the widespread financial crisis of 2008, when numerous institutions were affected. Some economists are forecasting the likelihood of heightened recessionary risk should additional banks fail as interest rates continue to rise.
For context, the banking sector issues that occurred in 2008/2009 was systemic, with a broad impact across many institutions that shared risk exposure to products that included mortgage-backed securities (MBS).
The volatile events in March precipitated a migration to bonds, creating a drop in interest rates which partially offset inflationary pressures. Falling rates are often indicative of a slowing economic environment, with a possible recession should economic activity significantly curtail. The Fed will determine whether to continue its aggressive fight against excessive inflation with higher interest rates, depending on updated economic data and how the bank crisis unfolds. There is a growing consensus that the Fed may be ready to halt raising rates because new data is showing that inflation has started to cool off.
The Fed’s latest survey on the economy, the Beige Book, reported that overall loan demand is falling, bank credit standards are tightening and delinquency rates are edging higher. The survey identified rising rates as a significant factor in inhibiting consumer borrower sentiment.
Millions of taxpayers are expected to file for an extension this year. The deadline for 2022 tax filings is April 18th, and those requesting an extension will have until October 16, 2023. As always, the IRS reminds taxpayers that an extension is for filing and is not an extension to pay taxes owed. (Sources: Bureau of Labor Statistics, Federal Reserve Bank of St. Louis, Federal Reserve Bank of New York, U.S. Treasury)
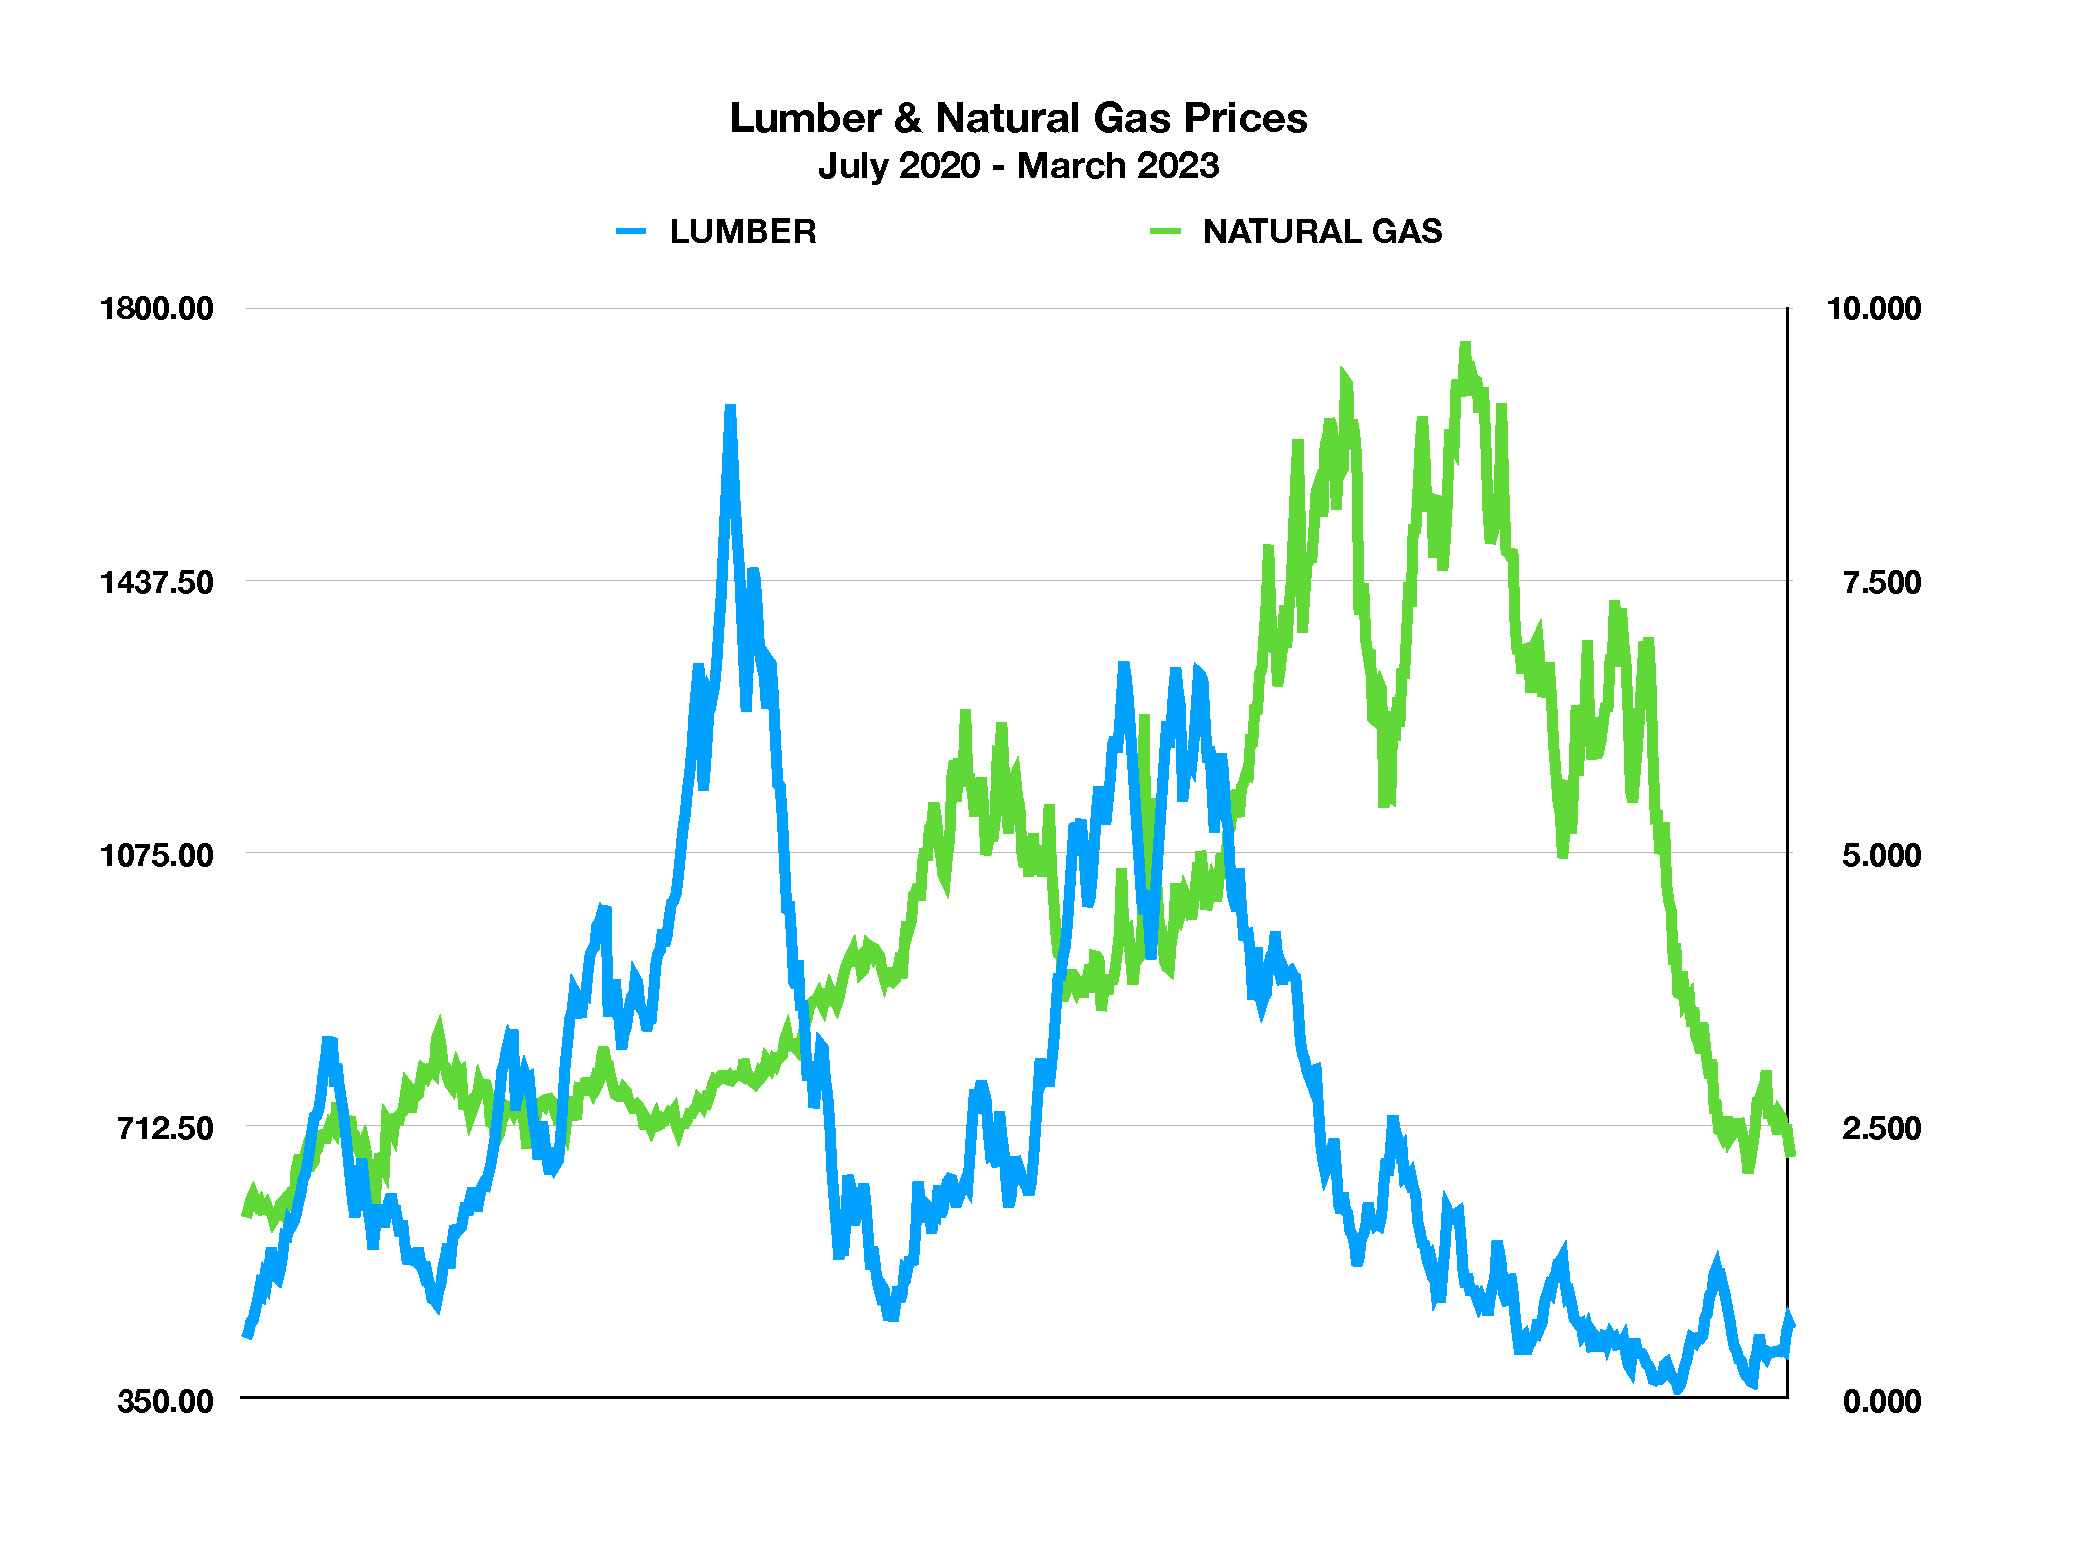 Another resource exhibiting similar trends is natural gas, exhibiting increasing supplies and falling demand. As European nations cut off Russian gas as a result of the war in Ukraine, the export of U.S. natural gas rose significantly and raised prices for natural gas domestically. In the U.S., natural gas consumption fell throughout March, with diminishing demand for natural gas expected to continue to drive a return to normal prices, following a price trend similar to that of lumber. (Sources: U.S. Energy Information Administration, NASDAQ, S&P Global Commodity Insights)
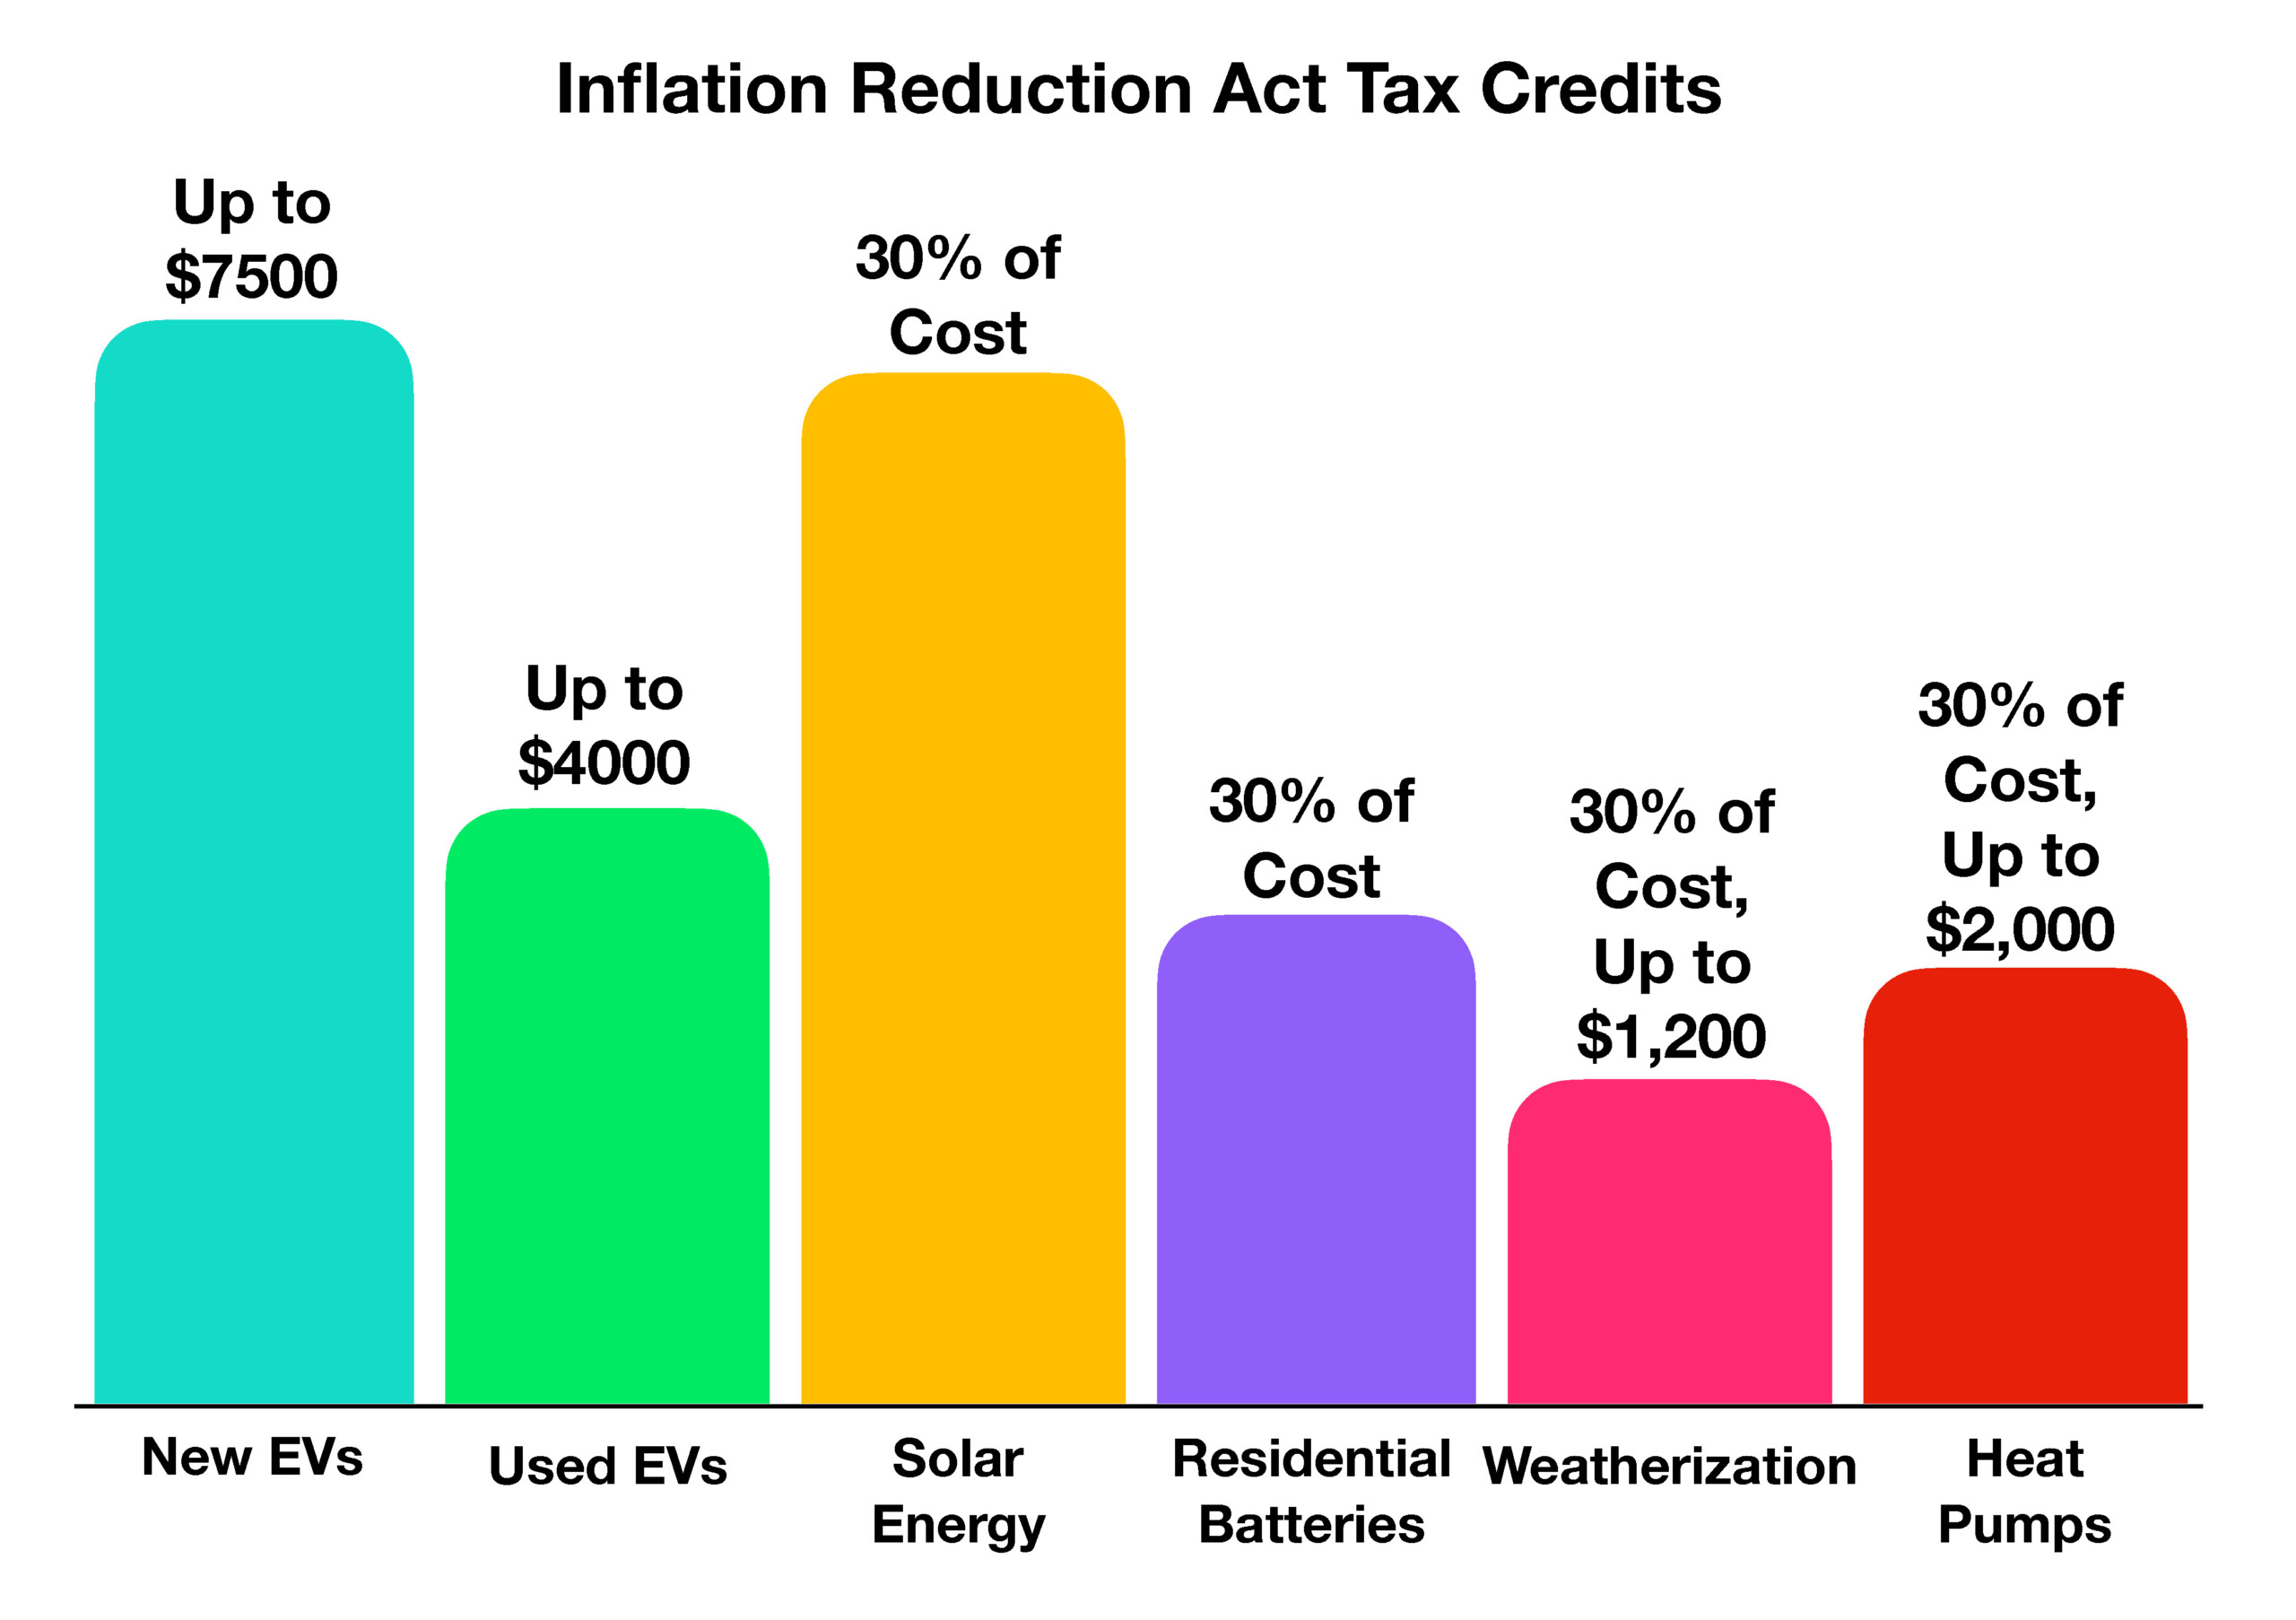 Heat pumps also receive sizable incentives through the act. Low-income households will receive a rebate of 100% for the cost of a heat pump, while moderate-income households will receive 50% of the heat pump expense. Homeowners can qualify for a 30% tax credit up to $2,000 for home energy efficiency projects, which covers heat pumps. For weatherization, homeowners can receive a tax credit of 30% for up to $1,200 per year. For households installing residential batteries, a tax credit of 30% is available for the equipment and installation cost. (Sources: U.S. Congress, Internal Revenue Service, U.S. Department of Energy)
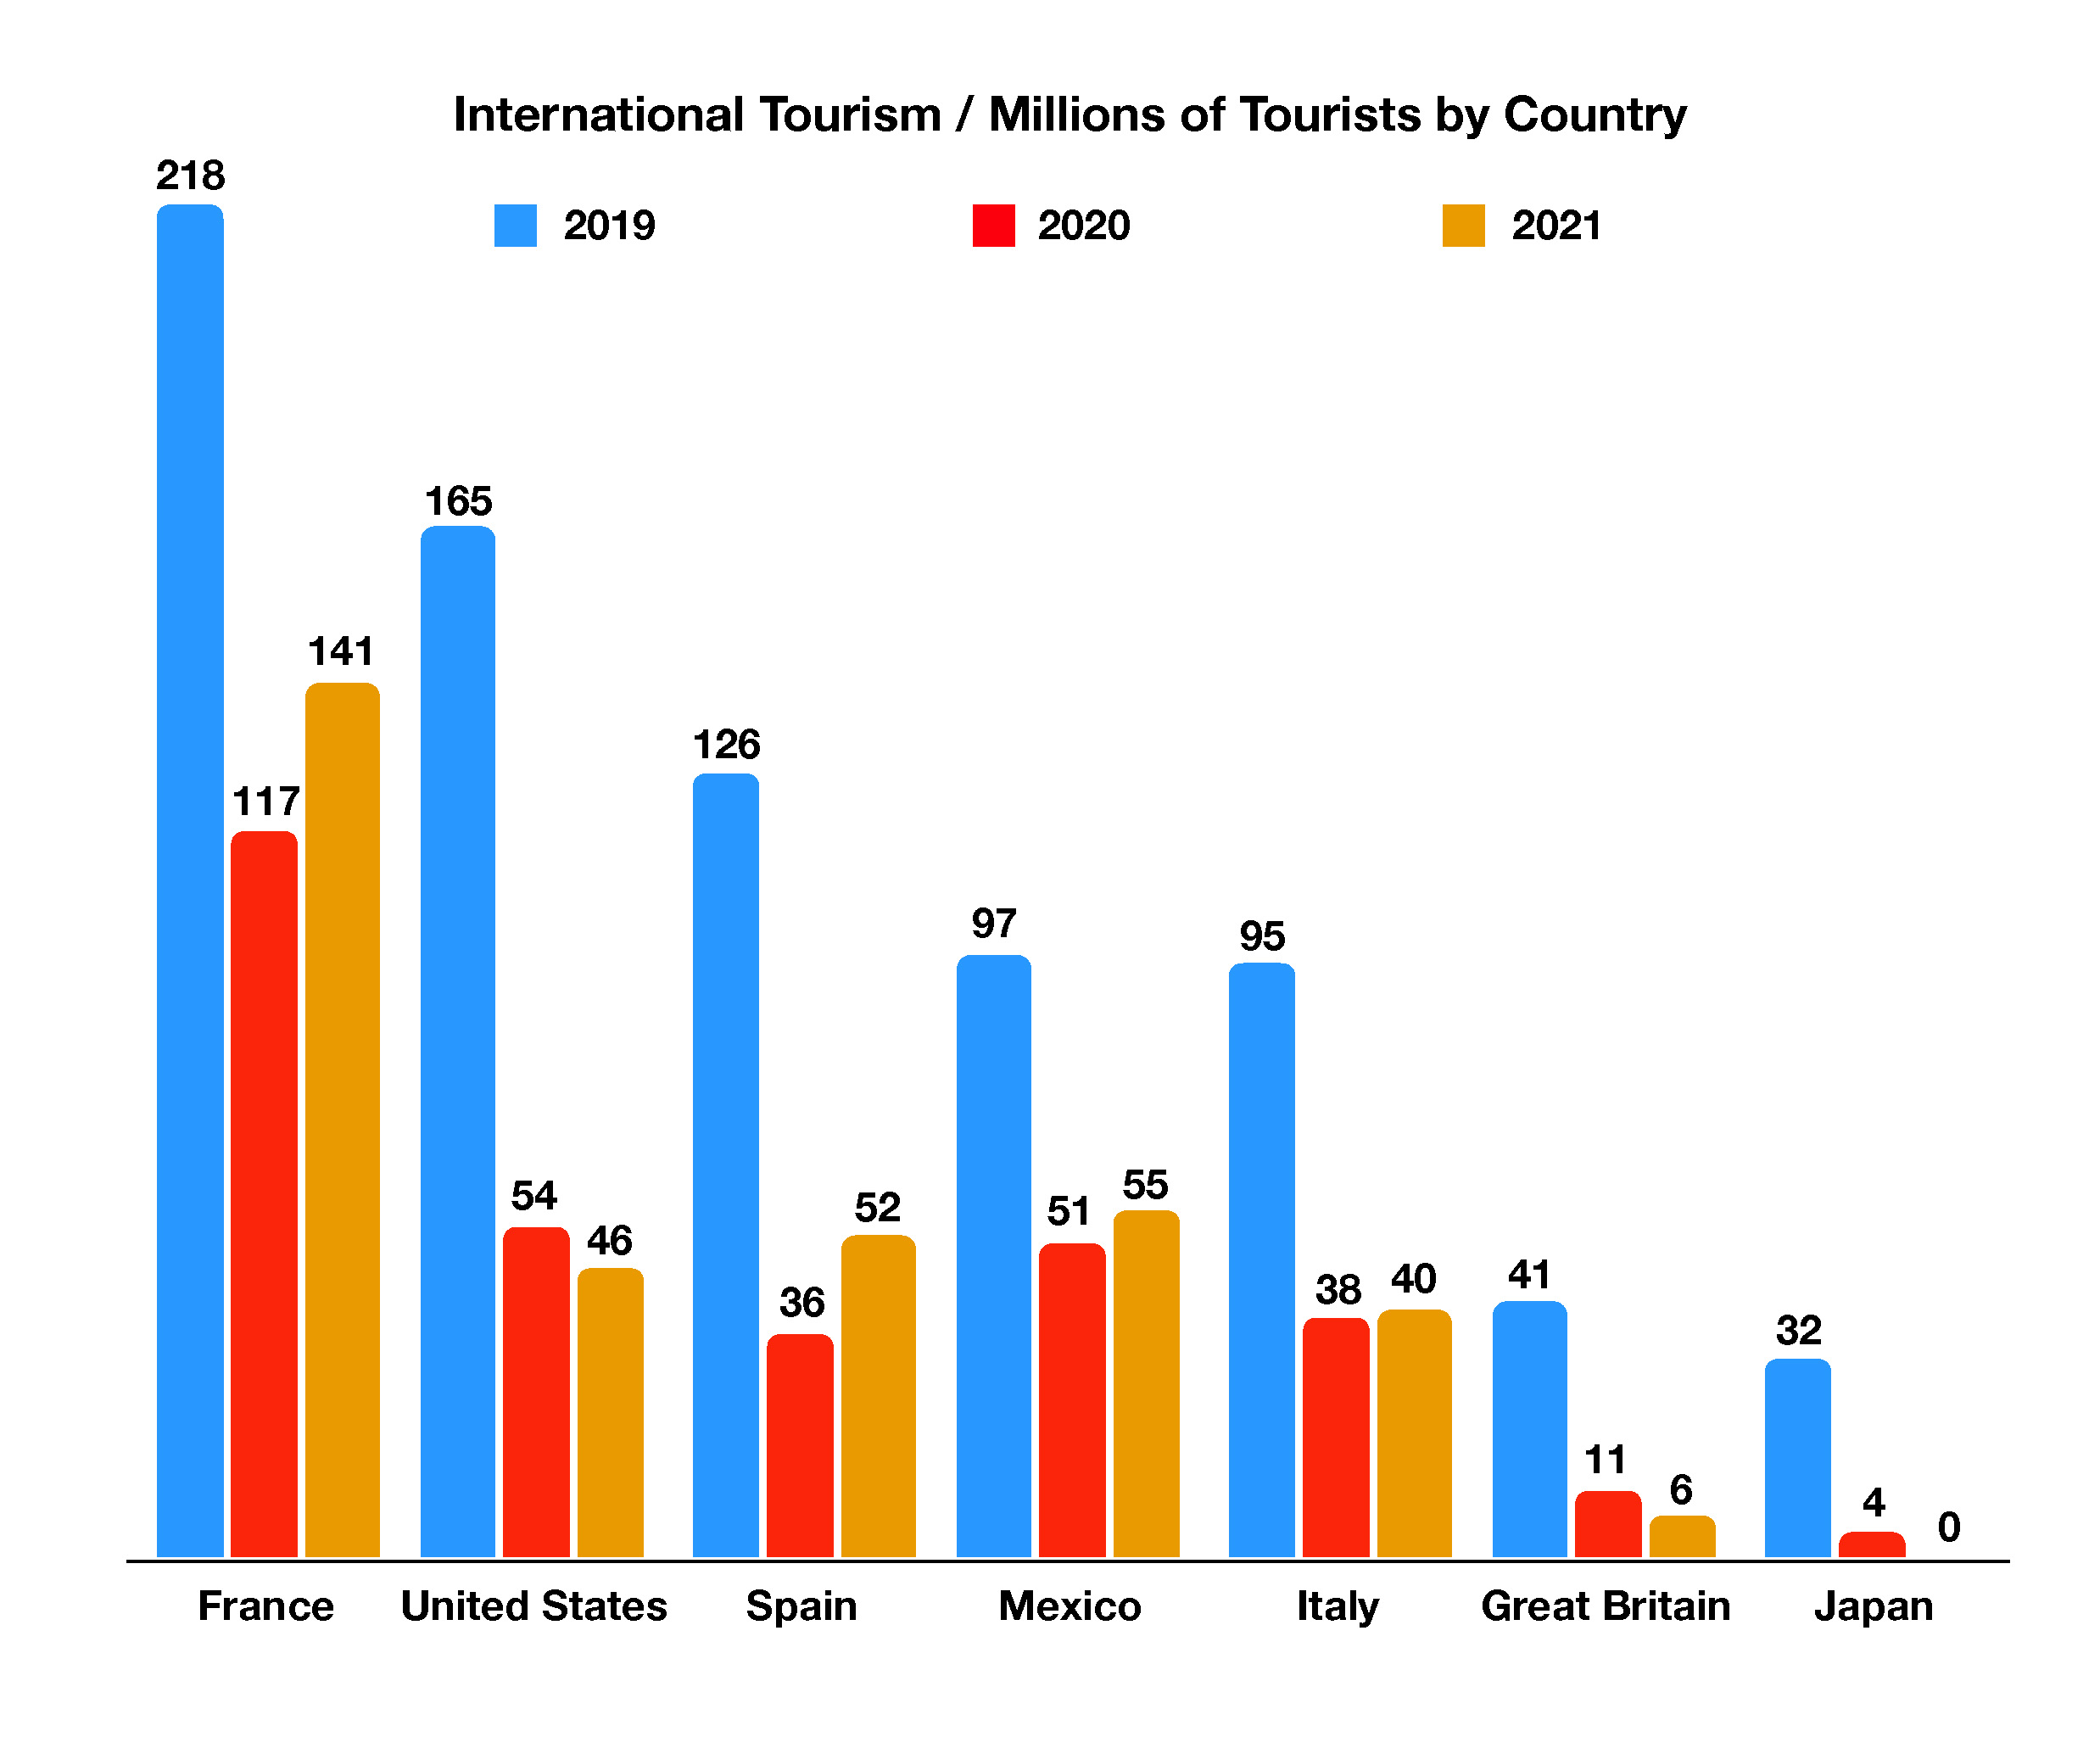 Despite international tourism still suffering the effects of the pandemic, both 2021 and 2022 saw improvements. As for domestic travel within the United States, the TSA reported the most domestic travelers in July 2022 since December 2019, a dramatic rise from the abysmal lows of mid-2020.