Ocean Park Capital Management
2503 Main Street
Santa Monica, CA 90405
Main: 310.392.7300
Daily Performance Line: 310.281.8577
Dow Jones | 41,563 |
S&P 500 | 5,648 |
Nasdaq | 17,713 |
2 Yr Treasury | 3.91% |
10 Yr Treasury | 3.91% |
10 Yr Municipal | 2.70% |
High Yield | 6.92% |
Dow Jones | 10.28% |
S&P 500 | 18.42% |
Nasdaq | 18.00% |
MSCI-EAFE | 9.72% |
MSCI-Europe | 9.81% |
MSCI-Pacific | 9.34% |
MSCI-Emg Mkt | 7.44% |
US Agg Bond | 3.07% |
US Corp Bond | 3.49% |
US Gov’t Bond | 2.95% |
Gold | 2,535 |
Silver | 29.24 |
Oil (WTI) | 73.65 |
Dollar / Euro | 1.10 |
Dollar / Pound | 1.31 |
Yen / Dollar | 144.79 |
Canadian /Dollar | 0.74 |
Ocean Park Investors Fund rose 4.34%* in March, while the S&P 500 rose 3.51% and the NASDAQ Composite rose 6.69%. The fund’s technology holdings—especially semiconductor stocks such as Nvidia and Advanced Micro Devices—were particularly strong.
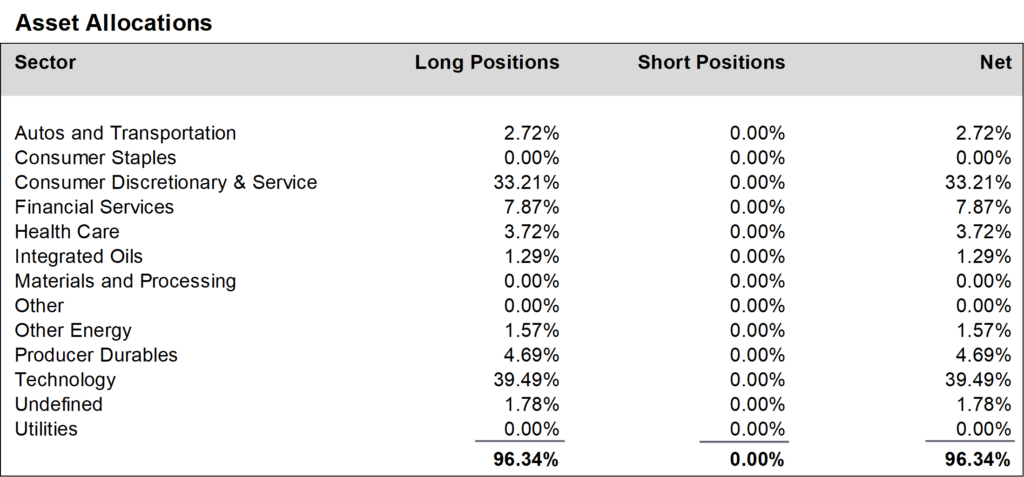
During March, we increased positions in the consumer discretionary and service sector and the technology sector and reduced positions in the financial services sector. We finished the month at about 96% net long, up from about 93% in February.
Daily updates on our activity are available on our Results Line, at 310-281-8577, and current information is also maintained on our website at www.oceanparkcapital.com. To gain access to the site enter password opcap.
*These results are pro forma. Actual results for most investors will vary. See additional disclosures on page 4. Past performance does not guarantee future results.
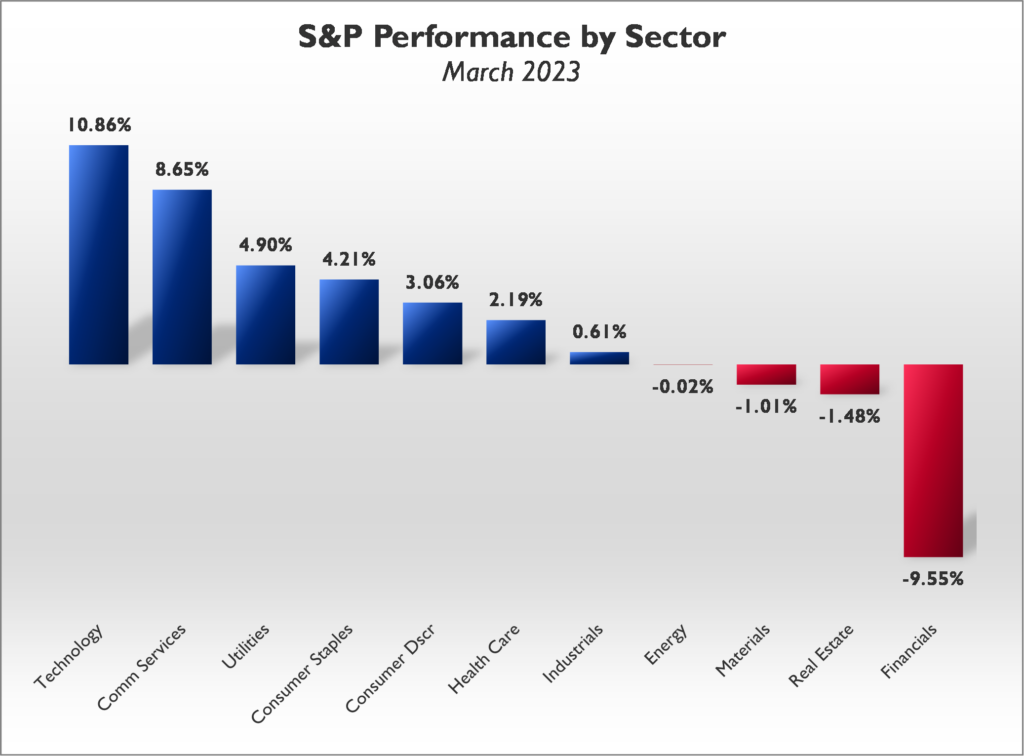
Seven of eleven sectors in the S&P 500 rose in March, with technology the best gainer. Financial stocks were the worst losers. Continuing the trend in January and February, growth stocks again outperformed value. Volatility was noteworthy, as the S&P 500 moved more than 1% on 11 of 23 trading days.
Economic headlines in March were uninspiring. Housing was solid but manufacturing, factory orders, and retail sales were weak. Unemployment rose slightly to 3.6%. Inflation as measured by the Consumer Price Index declined to 6.0% year-over-year, as expected.
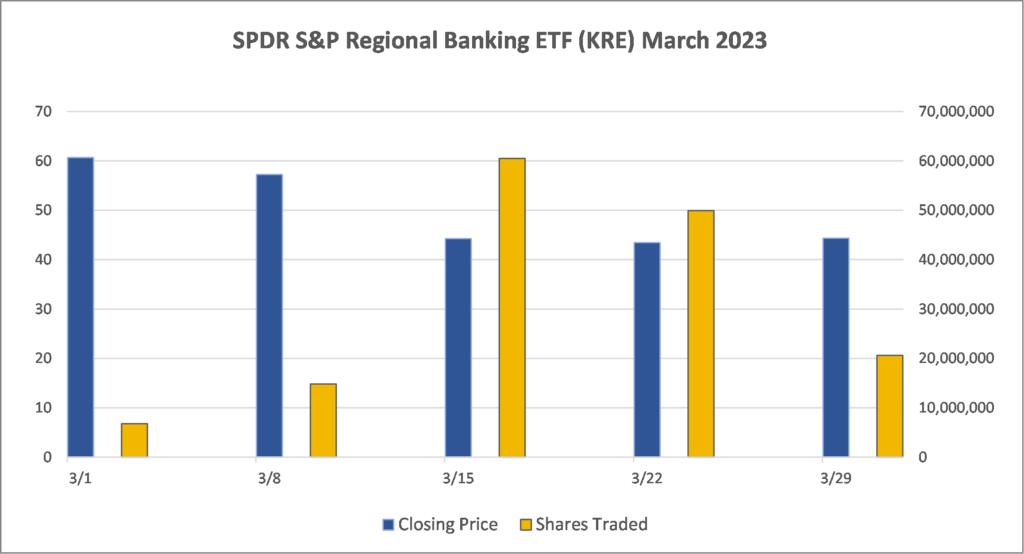
The big news was the collapse of Silicon Valley Bank and Signature Bank. Their balance sheets were weakened by large volumes of low-interest government securities that had lost significant value as interest rates increased. Depositors panicked, resulting in a run on the banks which threatened to expand to the broader financial system. Markets were rattled, but quick action by the Treasury Department and the Federal Reserve kept the damage contained.
Prior to the banking crisis, there was concern that the Fed might raise rates by 0.50% at its March meeting. As events unfolded, perhaps to calm markets further, the Fed raised rates by only 0.25%. Analysts are now projecting that the Fed will be lowering rates by the end of 2023, and that a recession is likely. For its part, the Fed still projects that GDP will grow in 2023—albeit minimally, by 0.4%–thus avoiding a recession.
Performance data for OPI reflect the reinvestment of dividends and other earnings on the fund’s assets. Performance data for the major indices reflect only changes in the value of those indices, and would be higher if dividends were included. However, the index data do not reflect fees that would be paid to index fund managers and transaction costs that would be incurred when their component stocks are bought or sold, while OPI’s data do reflect quarterly fees and expenses incurred by the fund. The information provided is believed to be reliable, but its accuracy or completeness is not warranted. This material is not intended as an offer or solicitation for the purchase or sale of any stock, bond, mutual fund, or any other financial instrument. The views and strategies discussed herein may not be appropriate and/or suitable for all investors. This material is meant solely for informational purposes, and is not intended to suffice as any type of accounting, legal, tax, or estate planning advice. Any and all forecasts mentioned are for illustrative purposes only and should not be interpreted as investment recommendations.