Ocean Park Capital Management
2503 Main Street
Santa Monica, CA 90405
Main: 310.392.7300
Daily Performance Line: 310.281.8577
| Dow Jones | 46,341 |
| S&P 500 | 6,528 |
| Nasdaq | 21,590 |
| 2 Yr Treasury | 3.79% |
| 10 Yr Treasury | 4.30% |
| 10 Yr Municipal | 3.08% |
| High Yield | 7.25% |
| Dow Jones | -3.58% |
| S&P 500 | -4.63% |
| Nasdaq | -7.11% |
| MSCI-EAFE | -1.12% |
| MSCI-Europe | -3.54% |
| MSCI-Far East | 2.45% |
| MSCI-Emg Mkt | -0.10% |
| US Agg Bond | 0.29% |
| US Corp Bond | 0.11% |
| US Gov’t Bond | 0.11% |
| Gold | 4,692 |
| Silver | 75.43 |
| Oil (WTI) | 102.43 |
| Dollar / Euro | 1.14 |
| Dollar / Pound | 1.32 |
| Yen / Dollar | 159.66 |
| Canadian /Dollar | 0.71 |
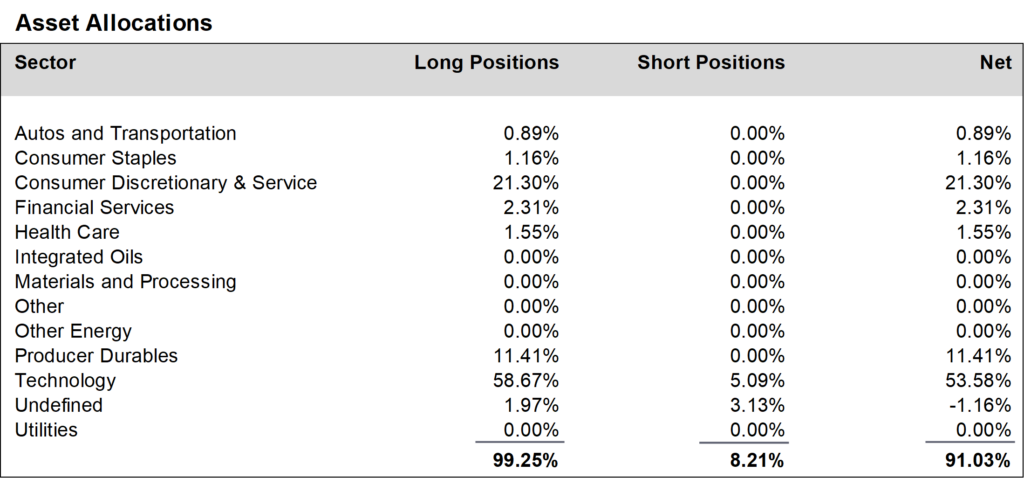
Stocks sold off broadly in March as investors reacted to uncertainties created by the war In Iran. Ocean Park Investors Fund fell 3.62%* while the S&P 500 fell 5.09% and the NASDAQ Composite fell 4.75%. Our results were aided by strategic short hedges in technology ETFs (QQQ and SMH) which reduced our market exposure to about 91% by month’s end.
These hedges were significant for two reasons. First, they reduced exposure to sector-wide selloffs without requiring sales of much-favored, long-held individual winners. Second, they allowed us to avoid realizing the large capital gains tax that would result if we had sold portions of individual stocks.
Daily updates on our activity are available on our Results Line, at 310-281-8577, and current information is also maintained on our website at www.oceanparkcapital.com. To gain access to the site enter password opcap.
*These results are pro forma. Actual results for most investors will vary. See additional disclosures on page 4. Past performance does not guarantee future results.

March was a difficult month for U.S. equities, with broad market indices giving back a meaningful portion of their early-year gains. Ten of eleven sectors in the S&P 500 declined. Energy was the only winner as the war in Iran caused oil prices to skyrocket. Value stocks outperformed growth. Volatility was high as the S&P 500 moved more than 1% on 9 of 22 trading days.
Macroeconomic and geopolitical conditions added to market stress in March. In addition to ongoing concerns about growth, inflation, and monetary policy, markets were buffeted by heightened geopolitical risk related to the war with Iran, which contributed to sharp moves in oil, interest rates, and day-to-day equity volatility. These developments reinforced a more defensive investor posture across global markets and increased the premium placed on disciplined risk management.
Economic data during the quarter remained mixed, with positive but slower growth and uneven inflation readings contributing to uncertainty about the path of Federal Reserve policy. Corporate earnings reports were generally adequate, but guidance in several cyclical and rate-sensitive industries remained cautious. In this environment, the portfolio has remained focused on companies with strong balance sheets, durable competitive positions, and exposure to long-term technology trends rather than short-cycle macro forces.
Performance data for OPI reflect the reinvestment of dividends and other earnings on the fund’s assets. Performance data for the major indices reflect only changes in the value of those indices, and would be higher if dividends were included. However, the index data do not reflect fees that would be paid to index fund managers and transaction costs that would be incurred when their component stocks are bought or sold, while OPI’s data do reflect quarterly fees and expenses incurred by the fund. The information provided is believed to be reliable, but its accuracy or completeness is not warranted. This material is not intended as an offer or solicitation for the purchase or sale of any stock, bond, mutual fund, or any other financial instrument. The views and strategies discussed herein may not be appropriate and/or suitable for all investors. This material is meant solely for informational purposes, and is not intended to suffice as any type of accounting, legal, tax, or estate planning advice. Any and all forecasts mentioned are for illustrative purposes only and should not be interpreted as investment recommendations.