Dow Jones | 44,130 |
S&P 500 | 6,339 |
Nasdaq | 21,122 |
2 Yr Treasury | 3.94% |
10 Yr Treasury | 4.37% |
10 Yr Municipal | 3.27% |
High Yield | 6.86% |
Dow Jones | 3.73% |
S&P 500 | 7.78% |
Nasdaq | 9.38% |
MSCI-EAFE | 15.67% |
MSCI-Europe | 18.44% |
MSCI-Pacific | 10.55% |
MSCI-Emg Mkt | 15.60% |
US Agg Bond | 3.75% |
US Corp Bond | 4.24% |
US Gov’t Bond | 3.72% |
Gold | 3,346 |
Silver | 36.79 |
Oil (WTI) | 69.38 |
Dollar / Euro | 1.15 |
Dollar / Pound | 1.33 |
Yen / Dollar | 148.58 |
Canadian /Dollar | 0.72 |
Macro Overview
Markets swung as uncertainty deepened over the impact of tariffs on corporate earnings and consumer sentiment. Economists and analysts say it remains difficult to quantify how much tariffs have dented profitability or shifted consumer behavior.
Prices for a range of goods rose in June, a sign some companies may be passing higher tariff costs to consumers. The Consumer Price Index climbed 2.7% from a year earlier, up from May’s 2.4% increase, Labor Department data show. Furniture, toys, and clothing—categories particularly sensitive to tariffs—posted outsized gains.
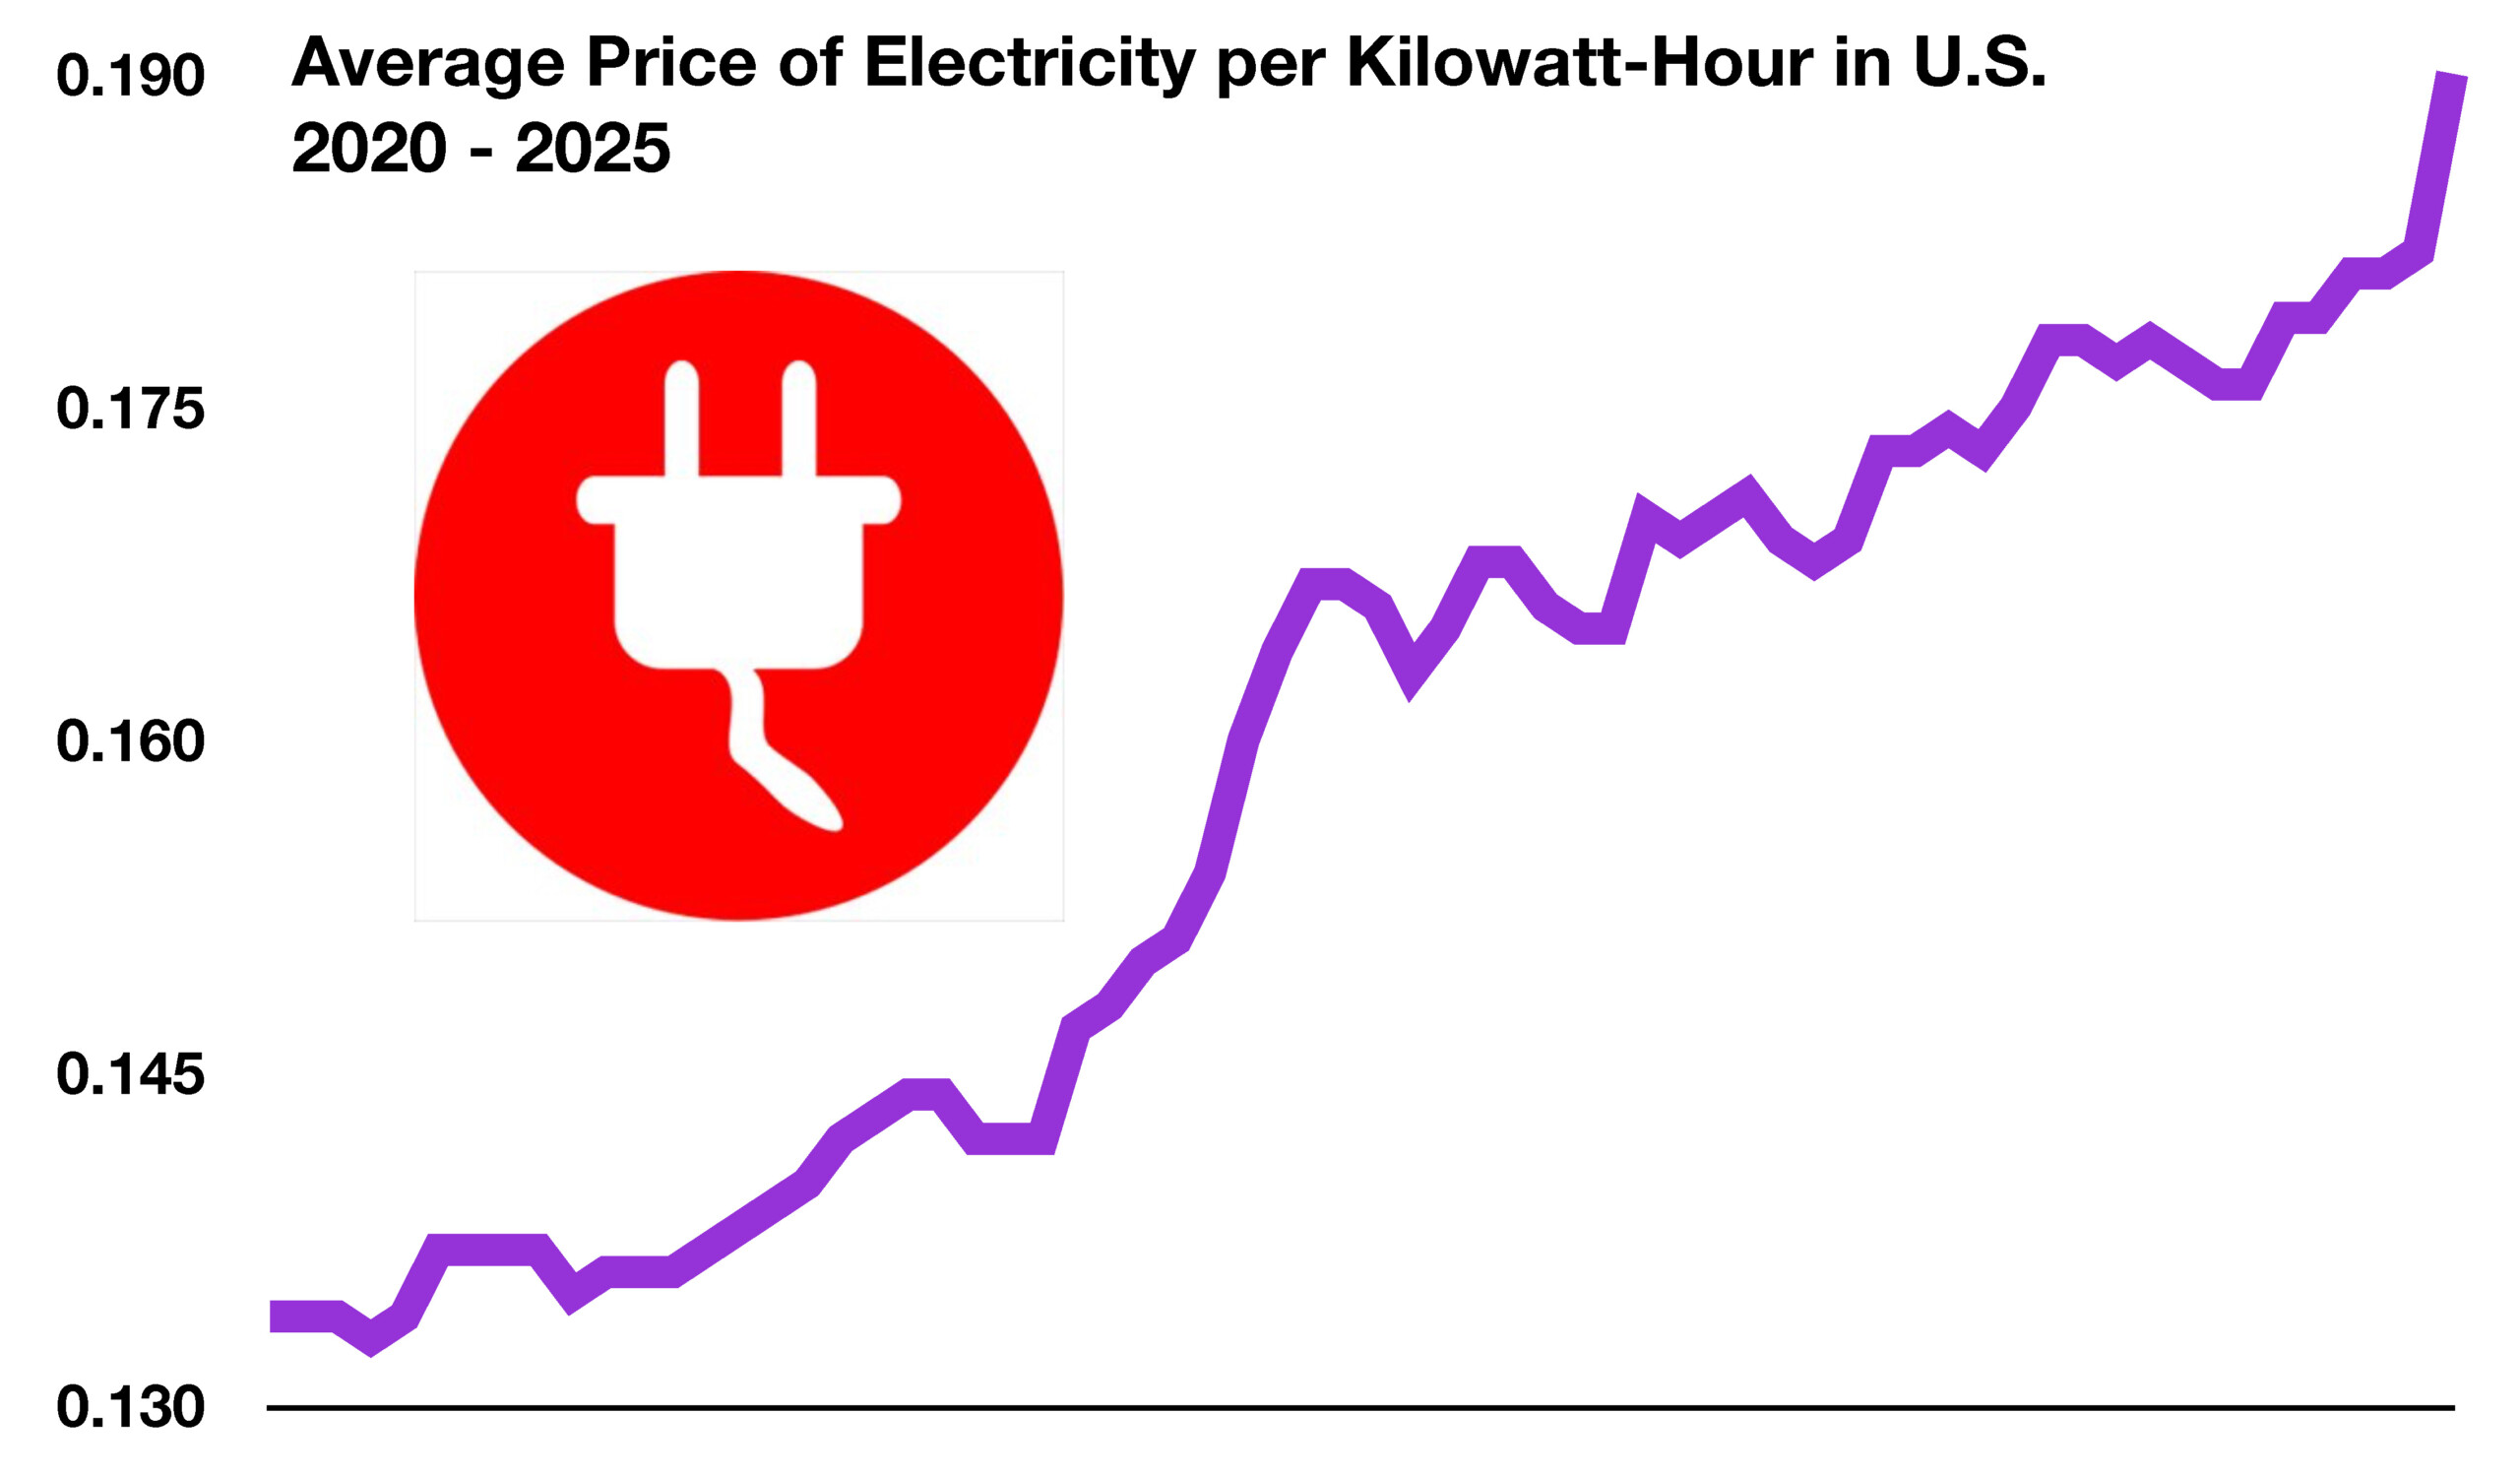
Deregulation and surging demand for electricity and natural gas, fueled by the build-out of artificial-intelligence infrastructure such as data centers, are creating growth prospects for the traditionally slow-growing utility sector.
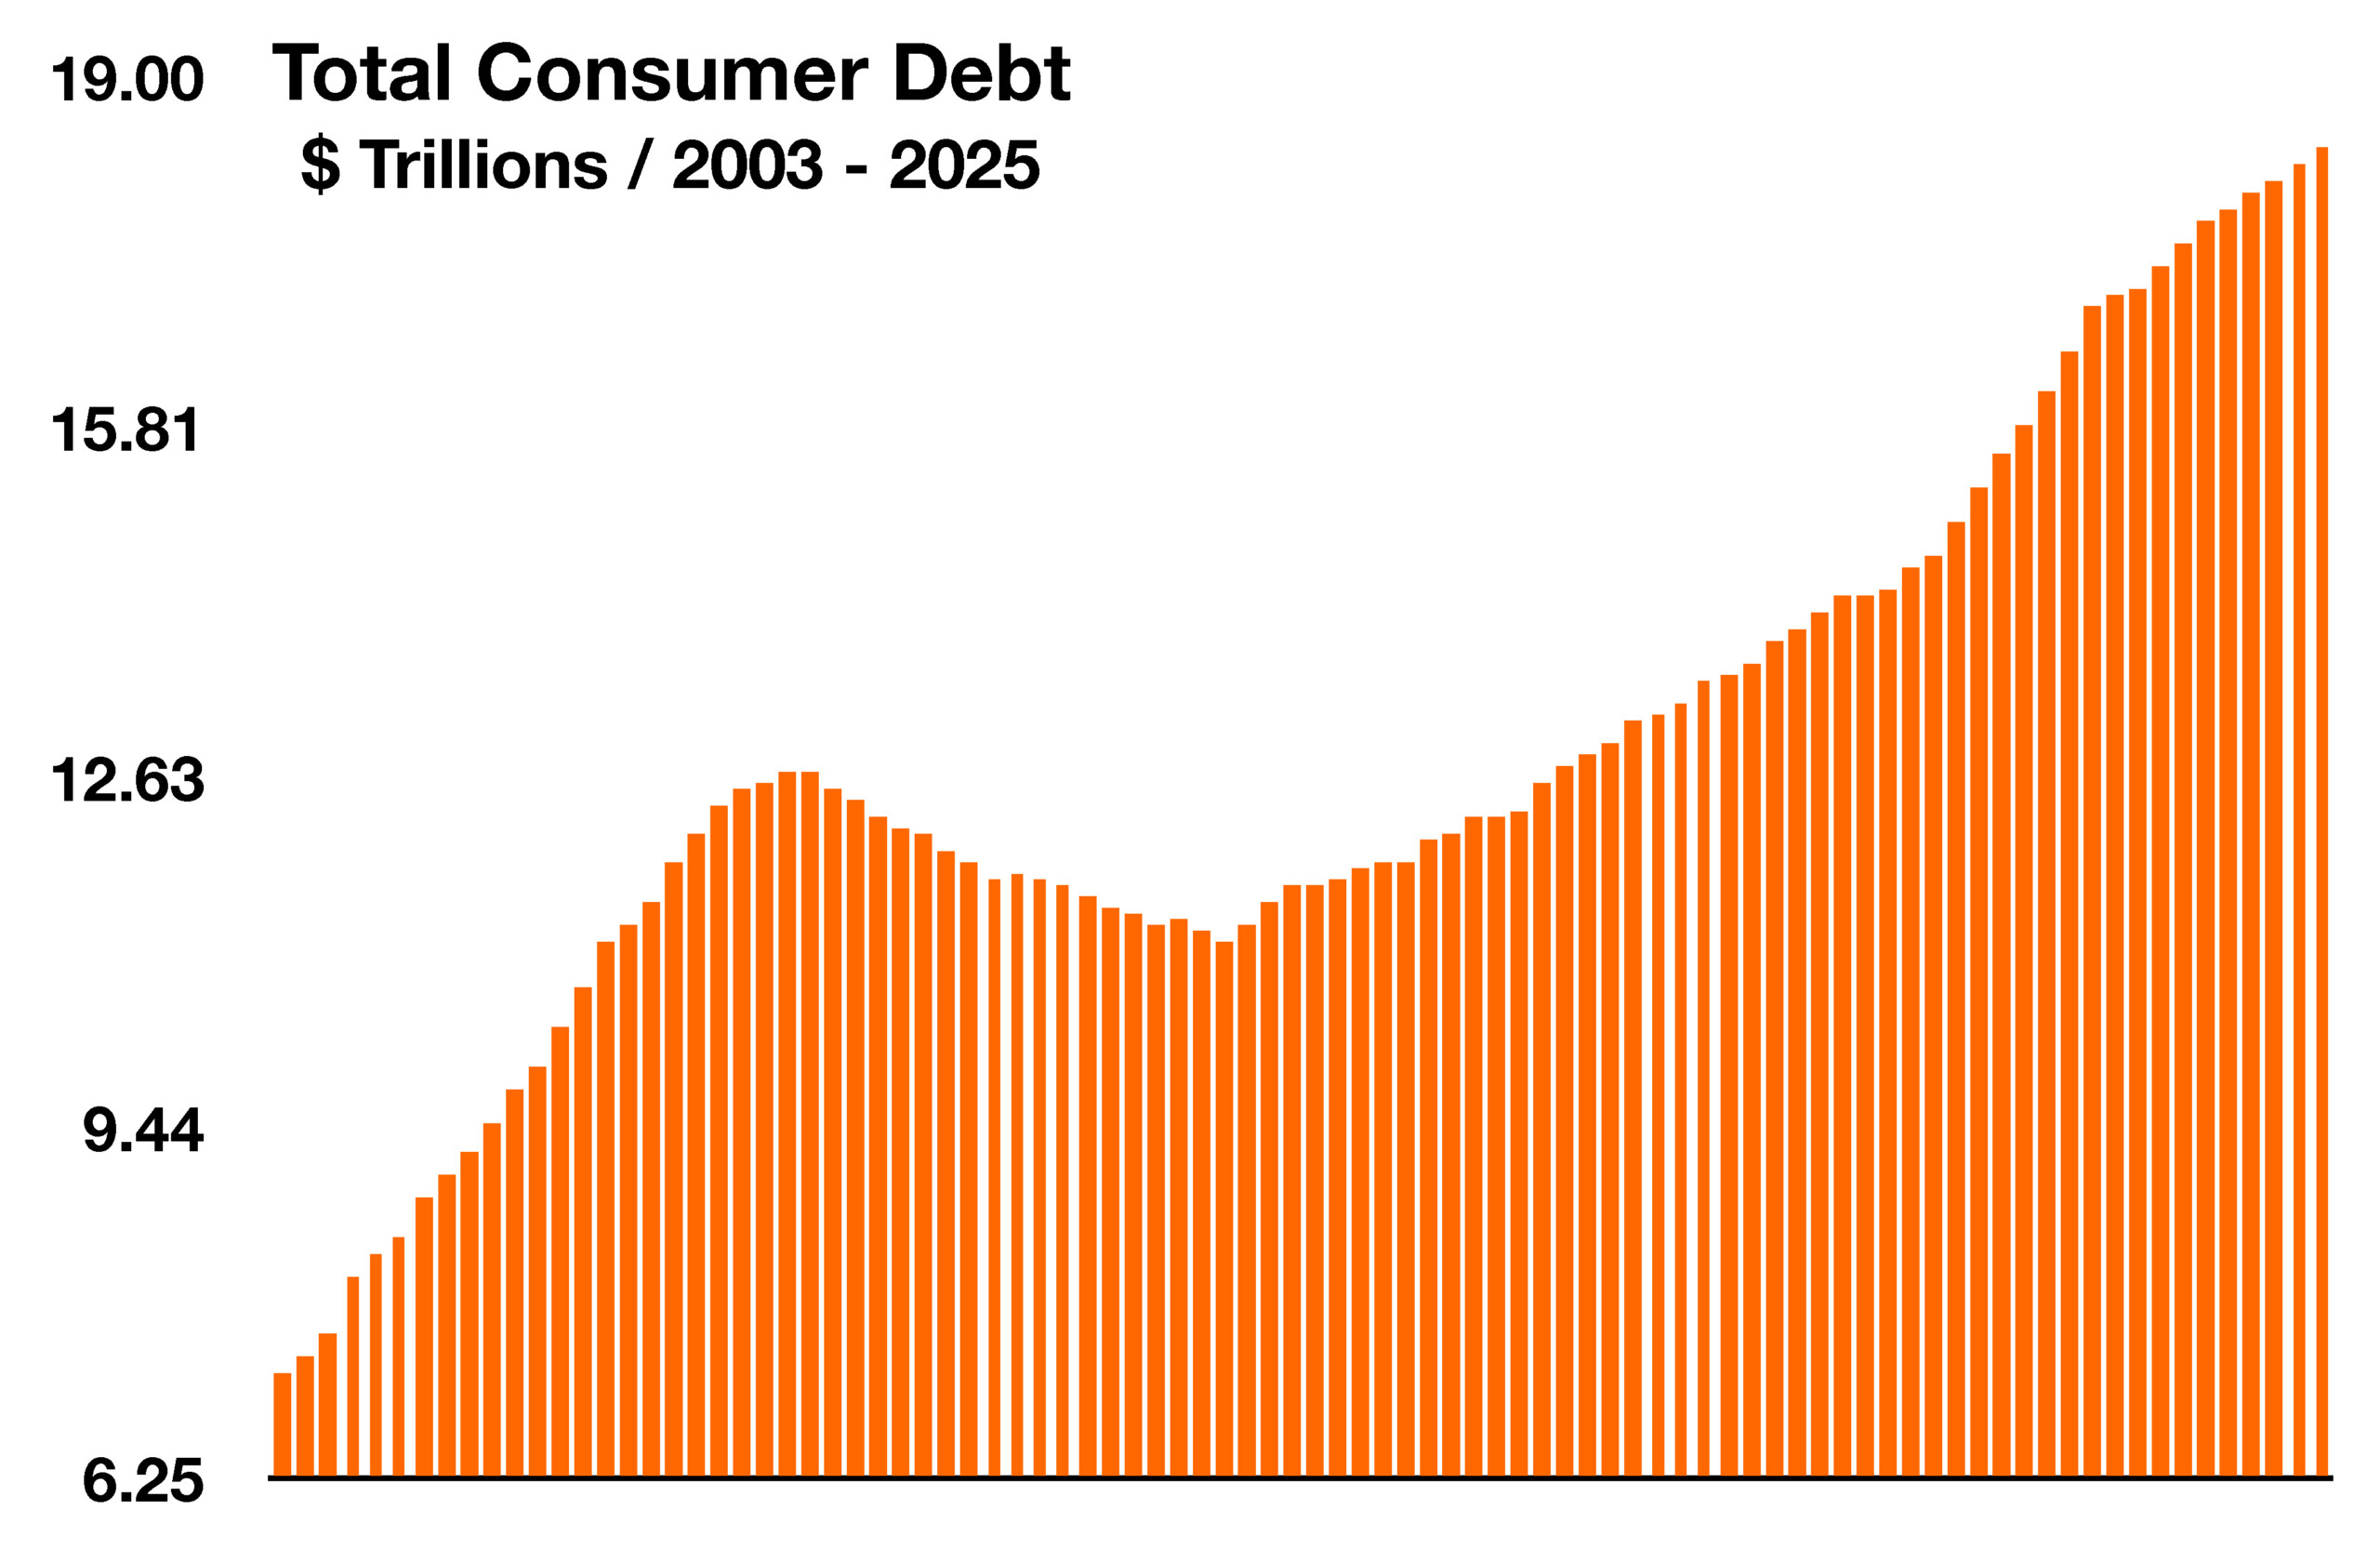
The U.S. economy expanded at a 1.2% annualized rate in the first half of 2025, while consumer spending rose just 0.9%, pointing to a slowdown across industries.
Equities wavered in July as investors weighed how much of the new tariffs companies are absorbing versus passing through to customers. Corporate earnings reports reveal a split: some firms are swallowing the costs, while others are hiking prices.
Questions over the Bureau of Labor Statistics’ data-collection methods have fueled skepticism about the accuracy of employment and labor-force figures. Since the pandemic, key government indicators have undergone frequent and sometimes dramatic revisions, clouding the economic picture. The integrity of this data remains a cornerstone of the U.S. Treasury market.
Roughly half of retirees pay taxes on Social Security benefits, which help finance Medicare and future payouts. Lower tax rates and recent provisions are expected to cut revenue to both programs, according to the Committee for a Responsible Federal Budget. The Social Security Trust Fund could be unable to pay full benefits as soon as 2032, a shortfall driven by a declining birthrate and longer life spans, which mean fewer workers are supporting more beneficiaries.
Technology companies have announced more than $1.5 trillion in U.S. investment commitments so far this year, betting on favorable policy outcomes on tariffs and digital-trade rules. The spending spans factory construction, research and development, and hiring.
Sources: BLS, U.S. Treasury, Bloomberg, SS.gov, CRFB, WhiteHouse.gov
Rates Uncertain Pending Next Fed Decision – Fixed Income Update
Fixed-income markets delivered mixed results in July as Treasury yields swung on concerns over inflation and slowing growth. Long-term yields dipped late in the month after weaker-than-expected employment data from the Bureau of Labor Statistics sent investors into bonds, lifting prices and pushing yields lower.
The disappointing jobs report effectively did some of the Federal Reserve’s work, driving down yields without the central bank taking action. Labor-market data remains a key driver for bonds, as signs of cooling employment often point to softer consumer spending and easing inflation pressures.
The average rate on a 30-year fixed conforming mortgage fell to 6.72% on July 31 from 6.91% at the start of the year. Any Fed rate cuts would likely provide further support to the housing market by lowering borrowing costs. (Sources: FreddieMac, U.S. Treasury, BLS)
Equities Navigate Tariffs In July – Domestic Stock Overview
Despite persistent trade tensions and macroeconomic uncertainty, U.S. equities extended their gains in July. The S&P 500 and Nasdaq advanced, buoyed by strong corporate earnings and renewed consumer confidence, showing resilience to trade and data headwinds. Information technology, utilities, and industrials led sector performance, while others delivered mixed results.
Weaker employment data raised concerns for equity markets, as fewer companies are hiring and job seekers face increasing difficulty securing positions. Such labor-market trends can dampen economic growth while easing inflationary pressures. (Sources: Bloomberg, S&P)
How Autos Have Become More Fuel Efficient Over The Decades – Auto Industry Overview
Technological innovation has transformed the auto industry, making vehicles both more efficient and electronically sophisticated. Advances have boosted horsepower while reducing fuel consumption, with modern four-cylinder engines now matching the output of the V8 “fuel hogs” of the 1970s and 1980s.
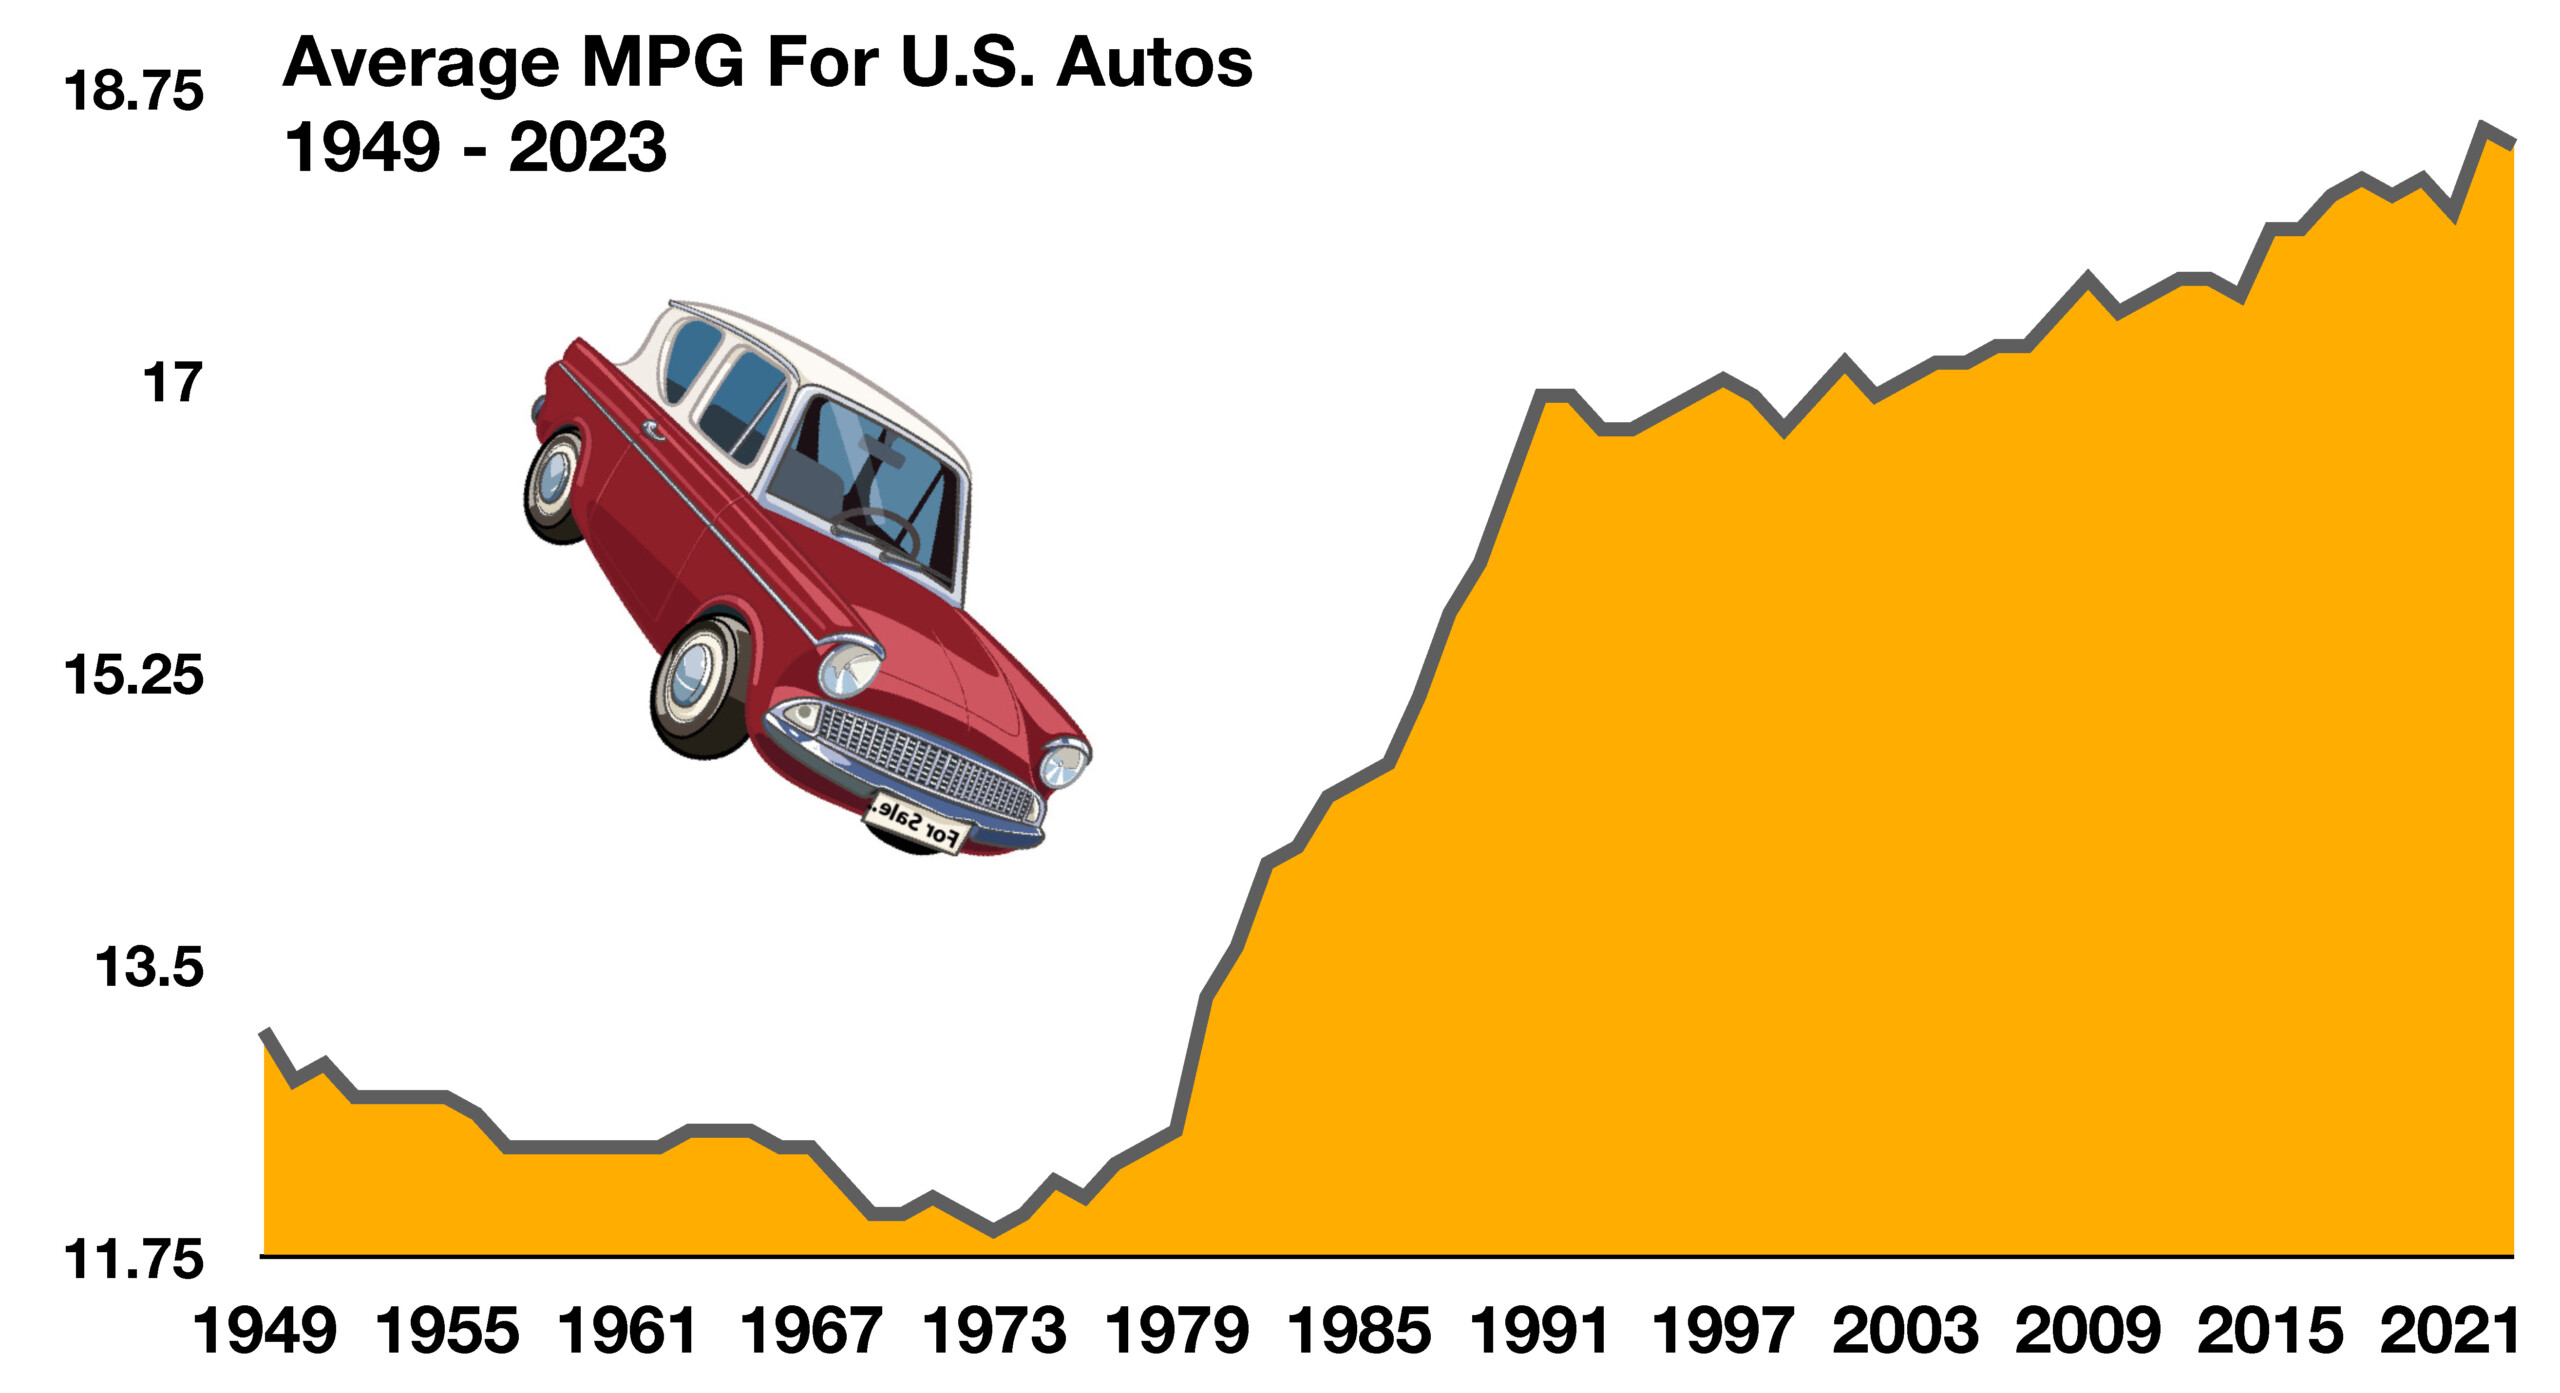
Data from the U.S. Energy Information Administration, which has tracked fuel use since 1949, shows a steady decline in consumption per vehicle, translating into improved miles per gallon. The average vehicle achieved roughly 13 MPG in 1949; the most recent data puts that figure at 18.4 MPG. (Sources: U.S. EIA)
Artificial Intelligence (AI) Is Elevating The Cost of Electricity – Energy Sector Update
The rapid expansion of artificial intelligence across the economy is driving a surge in electricity demand. AI relies on vast server farms packed with high-speed semiconductor processors that require enormous amounts of energy to process data. These facilities—data centers—are often located in remote or extreme climates, but their power needs increasingly compete with residential demand nationwide, contributing to higher utility bills.
As the U.S. power grid strains to meet the needs of consumers, data centers, and manufacturers, the push to expand generation capacity has reached unprecedented levels. Electricity prices in U.S. cities began to outpace historical trends in 2021, coinciding with a sharp increase in new data center construction. The average facility consumes nearly as much power as a small city.
Data centers accounted for roughly 4.4% of total U.S. electricity consumption in 2023, and the Department of Energy projects that share could climb to between 6.7% and 12% by 2028.
(Sources: U.S. Dept. of Energy, Federal Reserve Bank of St. Louis)
What The European Union Exports To The U.S. – International Trade
The United States imports a broad range of materials and finished goods from Europe, with total European Union (E.U.) shipments to the U.S. surpassing $570 billion in 2024. Leading the way are pharmaceuticals and medical products, valued at about $127 billion, followed by automobiles and automotive parts at roughly $57 billion. Machinery, optical products, electrical components, and organic chemicals also represent significant export categories.
Trade with the E.U. stands apart from other partners due to the bloc’s unique structure: 27 member countries with diverse economies and political leadership. Trade negotiations are handled collectively by the president of the European Commission, who speaks for the entire union.
Rising labor costs in Europe have prompted several European automakers to shift some production to the U.S. in recent years. Current trade talks include incentives aimed at encouraging further relocation of manufacturing to American soil. (Sources: EuroStat, U.S. Dept. of Commerce)
Turmoil With The Government’s Employment Data – Government Agency Overview
The dismissal of the Commissioner of the Bureau of Labor Statistics (BLS) has raised questions about how employment data is collected and what prompted the termination. The financial community largely accepted the firing as justified, amid growing concerns over the accuracy of government data—critical for shaping fiscal and monetary policy.
Employment data collection has faced challenges since the onset of the pandemic in 2020. What was once a face-to-face survey of businesses and HR departments shifted to an online questionnaire plagued by confusing questions. The BLS surveys roughly 121,000 businesses and government agencies, covering about 631,000 worksites. Conducted monthly, the survey draws on payroll records to track employment, hours worked, wages, overtime, and part-time status. These figures form the basis of the widely followed monthly Employment Situation report, which guides decisions by the Federal Reserve, the White House, analysts, and economists.
The president’s decision to remove the BLS commissioner followed unusually large downward revisions to employment gains for May and June. While revisions are common, the scale of the adjustments—showing the economy added 33,000 jobs over those two months instead of the previously reported 291,000—sparked concerns over data credibility. Some economists attribute the dramatic revisions to delayed responses from smaller companies to BLS surveys.
(Sources: BLS, OEWS, Office of Survey Methods Research (OSMR)
Consumer Debt Slowly Rising – Household Finances
In recent months, consumers have adjusted their spending habits, cutting back on discretionary items like TVs and furniture while turning to more affordable brands and products. Persistent price increases have strained budgets, as wages have lagged behind rising costs. To cover essential expenses, many consumers have increasingly relied on debt. Total outstanding consumer debt climbed to $18.38 trillion in the second quarter of 2025, up from $14.3 trillion at the start of the pandemic in early 2020.
Consumer debt includes mortgages, credit card balances, home equity lines of credit, and student loans. Credit card debt represented 6.5% of the total in the second quarter of 2025, up from 5.3% three years earlier. Economists closely monitor rising consumer debt as a key indicator of potential financial stress on household spending. (Source: Federal Reserve Bank of St. Louis)