
Ocean Park Capital Management
2503 Main Street
Santa Monica, CA 90405
Main: 310.392.7300
Daily Performance Line: 310.281.8577
| Dow Jones | 52,485 |
| S&P 500 | 7,489 |
| Nasdaq | 25,373 |
| 2 Yr Treasury | 4.28% |
| 10 Yr Treasury | 4.75% |
| 10 Yr Municipal | 3.32% |
| High Yield | 7.16% |
| Dow Jones | 9.20% |
| S&P 500 | 9.41% |
| Nasdaq | 9.17% |
| MSCI-EAFE | 9.80% |
| MSCI-Europe | 7.55% |
| MSCI-Far East | 15.35% |
| MSCI-Emg Mkt | 18.62% |
| US Agg Bond | -0.69% |
| US Corp Bond | -0.83% |
| US Gov’t Bond | -0.80% |
| Gold | 4,121 |
| Silver | 58.50 |
| Oil (WTI) | 84.52 |
| Dollar / Euro | 1.14 |
| Dollar / Pound | 1.34 |
| Yen / Dollar | 161.67 |
| Canadian /Dollar | 0.71 |
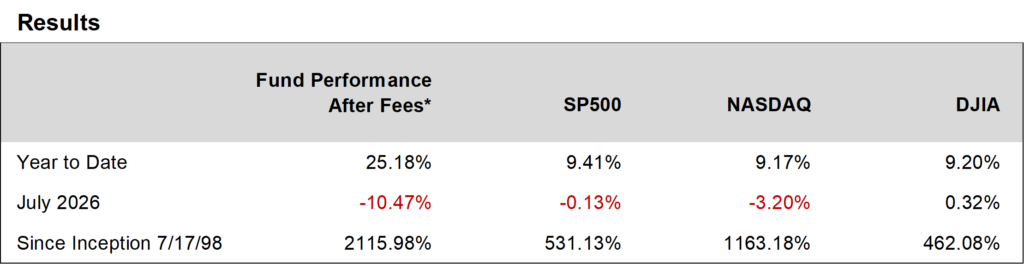
Ocean Park Investors Fund declined 10.47%* in July, while the S&P 500 fell 0.13% and the NASDAQ Composite fell 3.20%. While we are never satisfied with periods of relative underperformance, we view short-term results in the context of our disciplined investment process. We remain focused on the factors that ultimately drive long-term investment returns: earnings growth, estimate revisions, attractive valuations, and improving business fundamentals. We note that year to date, the fund has returned 25.18%*, substantially outperforming the S&P 500 (up 9.41%) and the NASDAQ Composite (up 9.17%).
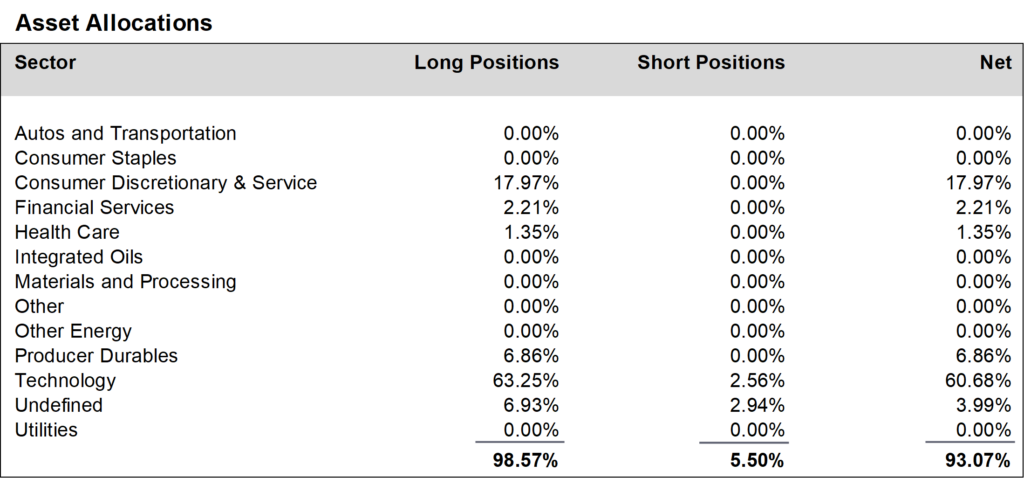
July’s weakness was driven primarily by a sharp correction in memory and semiconductor stocks, which have also been among our largest contributors to performance this year. We will continue to adjust the portfolio when the fundamentals change—not simply because market sentiment rotates over short periods. We believe maintaining that discipline has been the foundation of our long-term outperformance and remains the best way to compound capital over time.
Daily updates on our activity are available on our Results Line, at 310-281-8577, and on our website at www.oceanparkcapital.com. Enter password opcap.
*These results are pro forma. Actual results for most investors will vary. Additional disclosures on page 4. Past performance does not guarantee future results.

The broader market was mixed in July. Six of eleven sectors in the S&P 500 rose, with energy the best sector and technology the weakest. Value stocks again outperformed growth. Apart from technology, volatility was moderate as the S&P 500 moved more than 1% on 4 of 22 trading days and notched a record close during the month.
One bright spot was second quarter corporate earnings reported in July, which were extraordinary. With 61% of S&P 500 companies reporting, 86% have beaten consensus earnings expectations which is well above the one-year and five-year averages. The blended earnings growth rate was an astonishing 47.4%, due in part to outsized earnings from Alphabet and Amazon. But even excluding those two companies, the blended earnings growth rate was 28.8%.

Oil, inflation, and the Fed dominated economic headlines in July.
After the Iran ceasefire calmed oil markets in the spring, renewed conflict drove prices near $85/barrel by month’s end. In addition to hostilities between the US and Iran in the Gulf of Hormuz, Yemen’s Houthis threatened a blockade against Saudi Arabia in the Red Sea which would further pressure world oil supplies and prices. Goldman Sachs warned that further escalation could push oil above $120/barrel.
Inflation data sent conflicting signals. The Consumer Price Index headline number declined to 3.5% annualized, largely because of a temporary decline in energy prices earlier in the month. But the core CPI which excludes food and energy remained unchanged at 2.6%, still above the Fed’s target of 2%.
As for the Fed, Chairman Warsh held his second meeting since taking office and the result was mixed. The Fed held interest rates steady at 3.50-3.75% but three Open Market Committee members voted in favor of a quarter-point rate hike—the first time in almost ten years that three members have dissented in unison. Warsh reiterated his aversion to forward guidance and the long-term bond market quickly registered disapproval with the 30-year bond interest rate rising to 5.27%, its highest level since 2007.

Performance data for OPI reflect the reinvestment of dividends and other earnings on the fund’s assets. Performance data for the major indices reflect only changes in the value of those indices, and would be higher if dividends were included. However, the index data do not reflect fees that would be paid to index fund managers and transaction costs that would be incurred when their component stocks are bought or sold, while OPI’s data do reflect quarterly fees and expenses incurred by the fund. The information provided is believed to be reliable, but its accuracy or completeness is not warranted. This material is not intended as an offer or solicitation for the purchase or sale of any stock, bond, mutual fund, or any other financial instrument. The views and strategies discussed herein may not be appropriate and/or suitable for all investors. This material is meant solely for informational purposes, and is not intended to suffice as any type of accounting, legal, tax, or estate planning advice. Any and all forecasts mentioned are for illustrative purposes only and should not be interpreted as investment recommendations.