December 2018 Market Update and Economic Review
Market Update
(all values as of 03.29.2024)

Stock Indices:

Dow Jones 39,807
S&P 500 5,254
Nasdaq 16,379

Bond Sector Yields:

2 Yr Treasury 4.59%
10 Yr Treasury 4.20%
10 Yr Municipal 2.52%
High Yield 7.44%

YTD Market Returns:

Dow Jones 5.62%
S&P 500 10.16%
Nasdaq 9.11%
MSCI-EAFE 5.06%
MSCI-Europe 4.60%
MSCI-Pacific 5.82%
MSCI-Emg Mkt 1.90%
 
US Agg Bond -0.78%
US Corp Bond -0.40%
US Gov’t Bond -0.72%

Commodity Prices:

Gold 2,254
Silver 25.10
Oil (WTI) 83.12

Currencies:

Dollar / Euro 1.08
Dollar / Pound 1.26
Yen / Dollar 151.35
Canadian /Dollar 0.73

Macro Overview

The Group of Twenty (G20) summit in Argentina produced two significant trade deals for the United States, a revised trade agreement with Canada and Mexico as well as a trade tariff truce with China. The trade arrangements were initially received positively by global financial markets alleviating months of uncertainty surrounding trade and international commerce. Skepticism surrounding the trade truce with China has evolved, questioning the extent of a trade agreement and its details. 

Volatility continued into November spilling over from October’s trading frenzy. All major equity indices saw their gains for the year vanish in mid-November, then rebound at month end to recapture some of those same gains. Many analysts believe that lower stock valuations are posing buying opportunities for domestic and international investors.

Some analysts perceive the latest market pull back as a normal course resulting from transitioning to a higher rate environment and slowing growth prospects. Market pullbacks are common when the market experiences a sentiment shift and tries to decipher which sectors and industries are favored to perform. Market volatility in November has been a result of uncertainty surrounding trade, Fed rate hikes, and economic prospects.

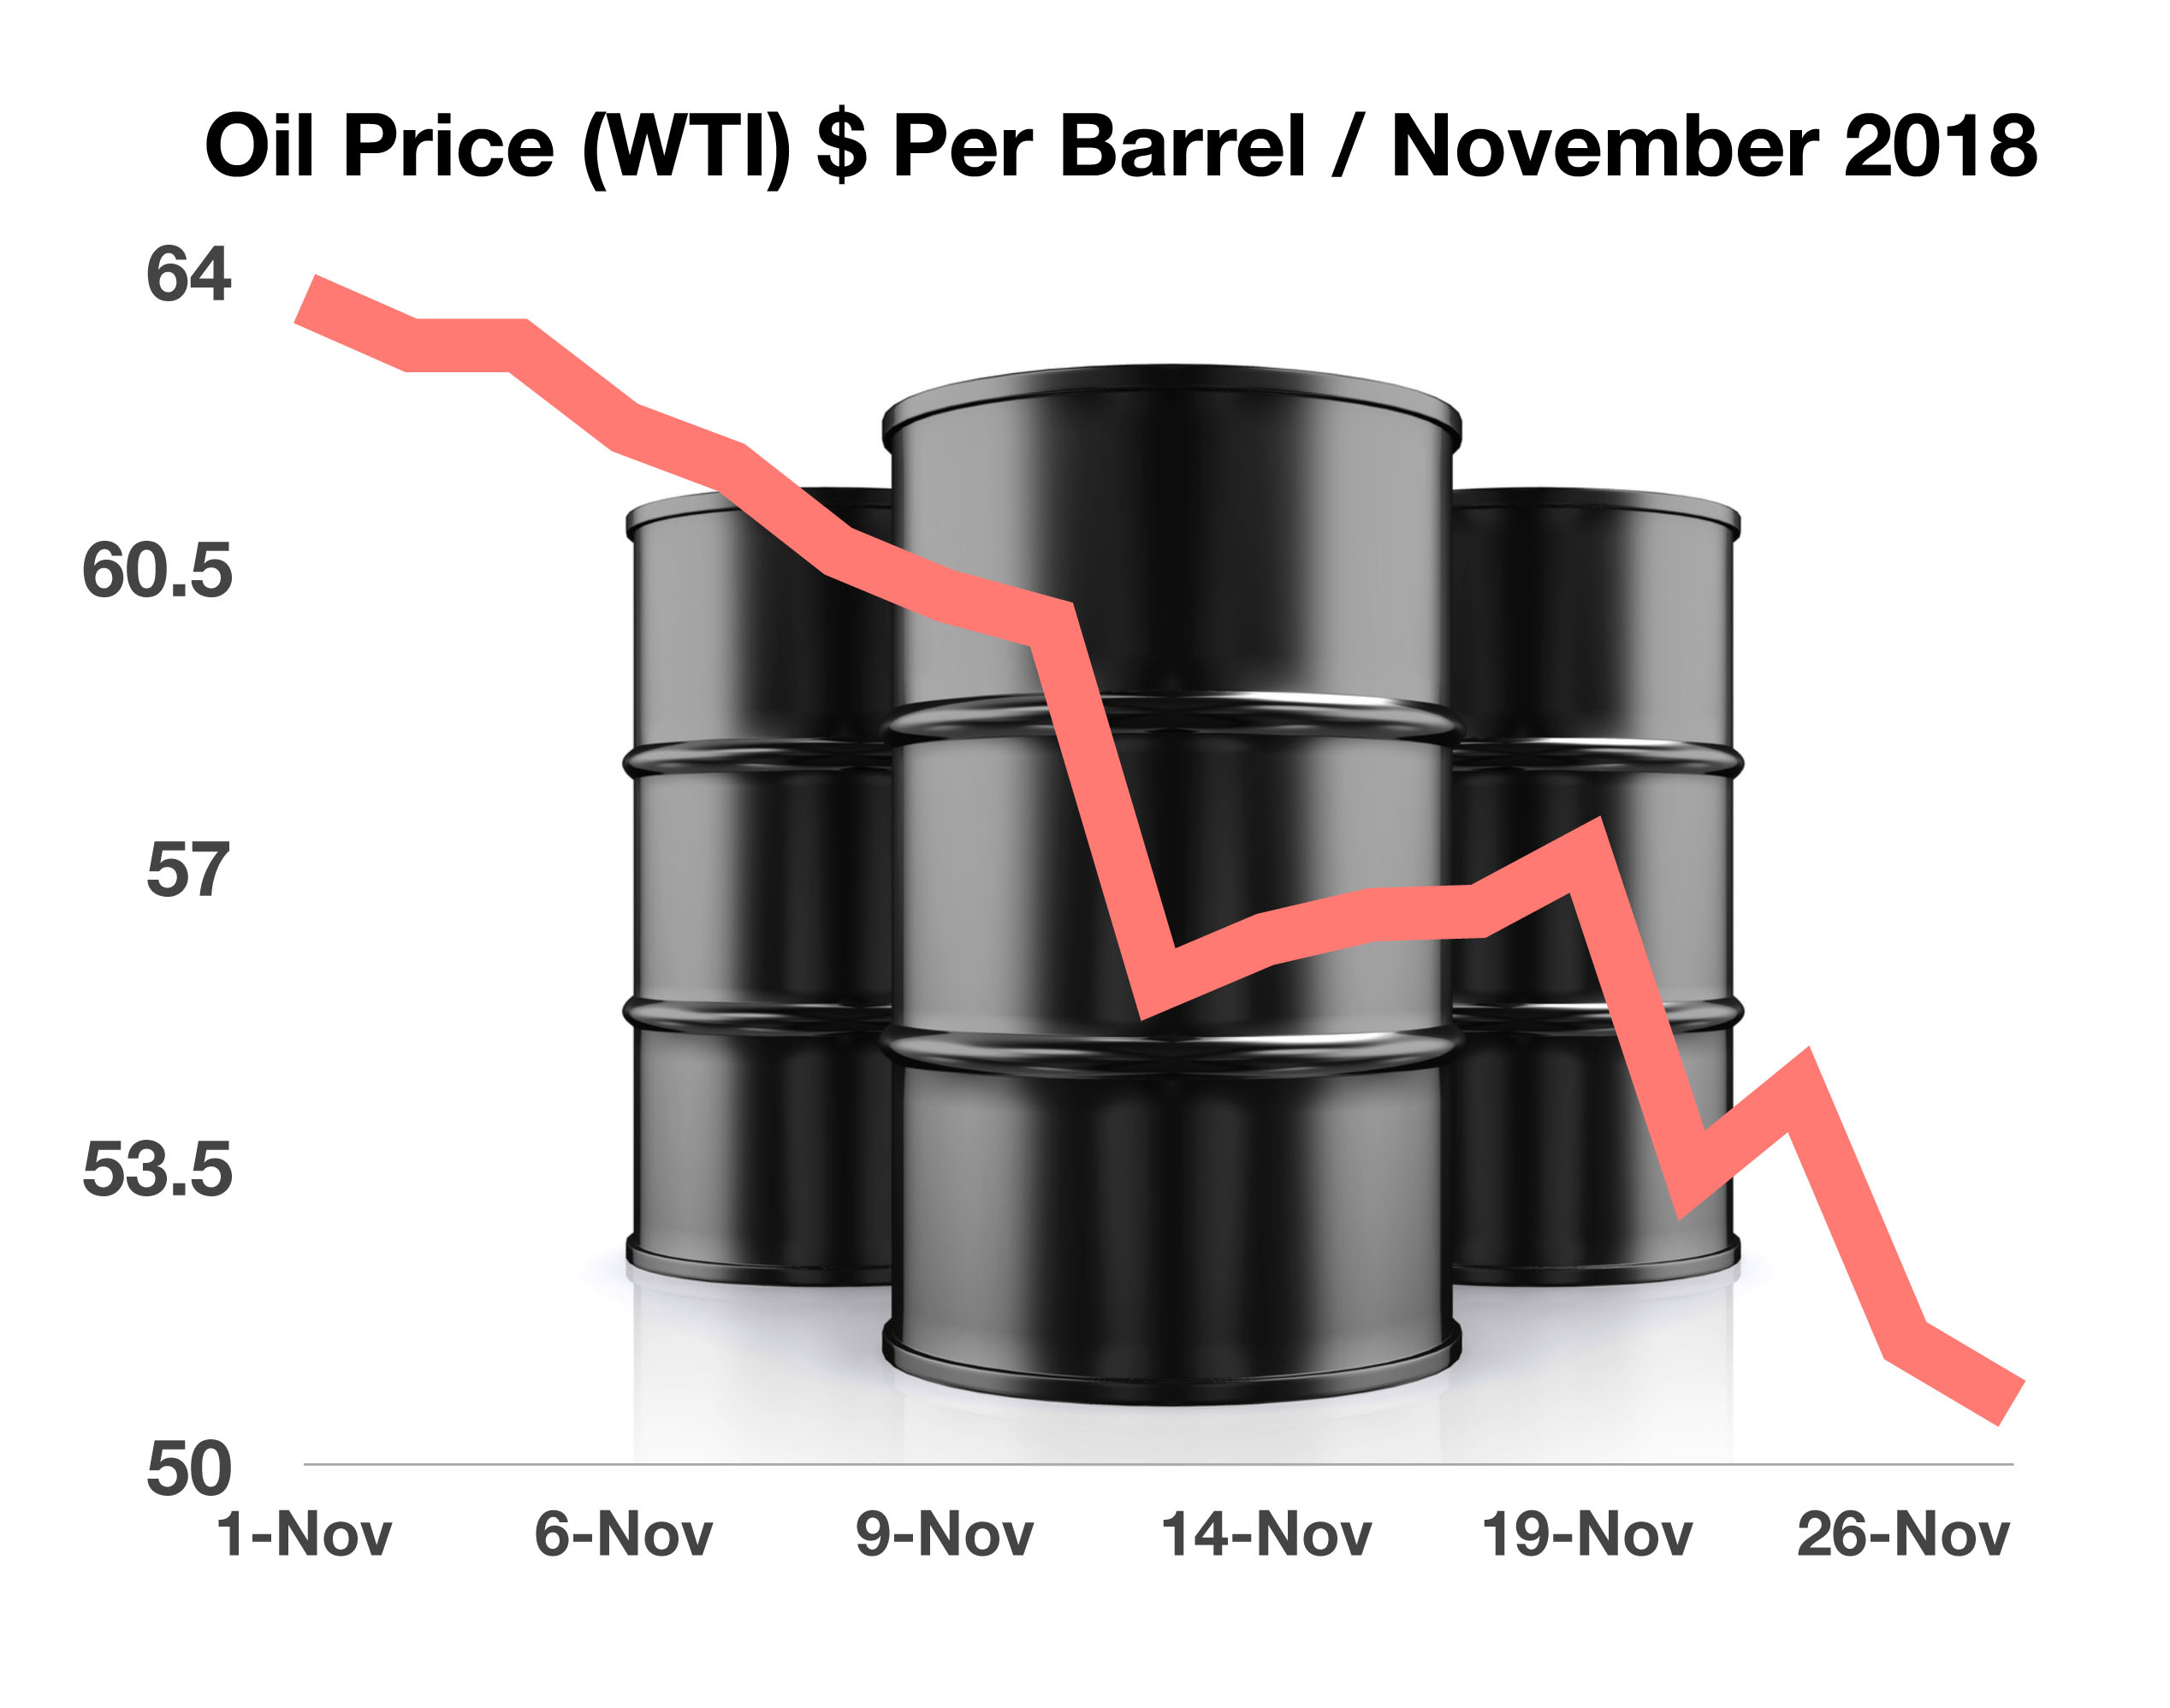
Uneasiness in the markets were amplified by a rapid fall in the price of oil, which declined to levels not reached since late 2017. Analysts attribute the slump to a rising supply of oil as well as a perceived slowdown in the global economy. Oil’s price decline is the latest obstacle for stock indices to recapture recent losses. The demand for oil internationally is seen as an indicator of global economic health.

Rates fell abruptly towards the end of November as the Fed signaled that it may scale back its process of projected rate increases in 2019. The Fed believes that rates are currently at a level just below its neutral stance, which Fed members estimate to be near 2.9 percent to 3 percent.

Data compiled and released by the International Energy Association (IEA) revealed that the United States has officially become the largest producer of oil in the world, surpassing both Russia and Saudi Arabia. As of the end of this summer, U.S. oil production is over 11.5 million barrels per day. 

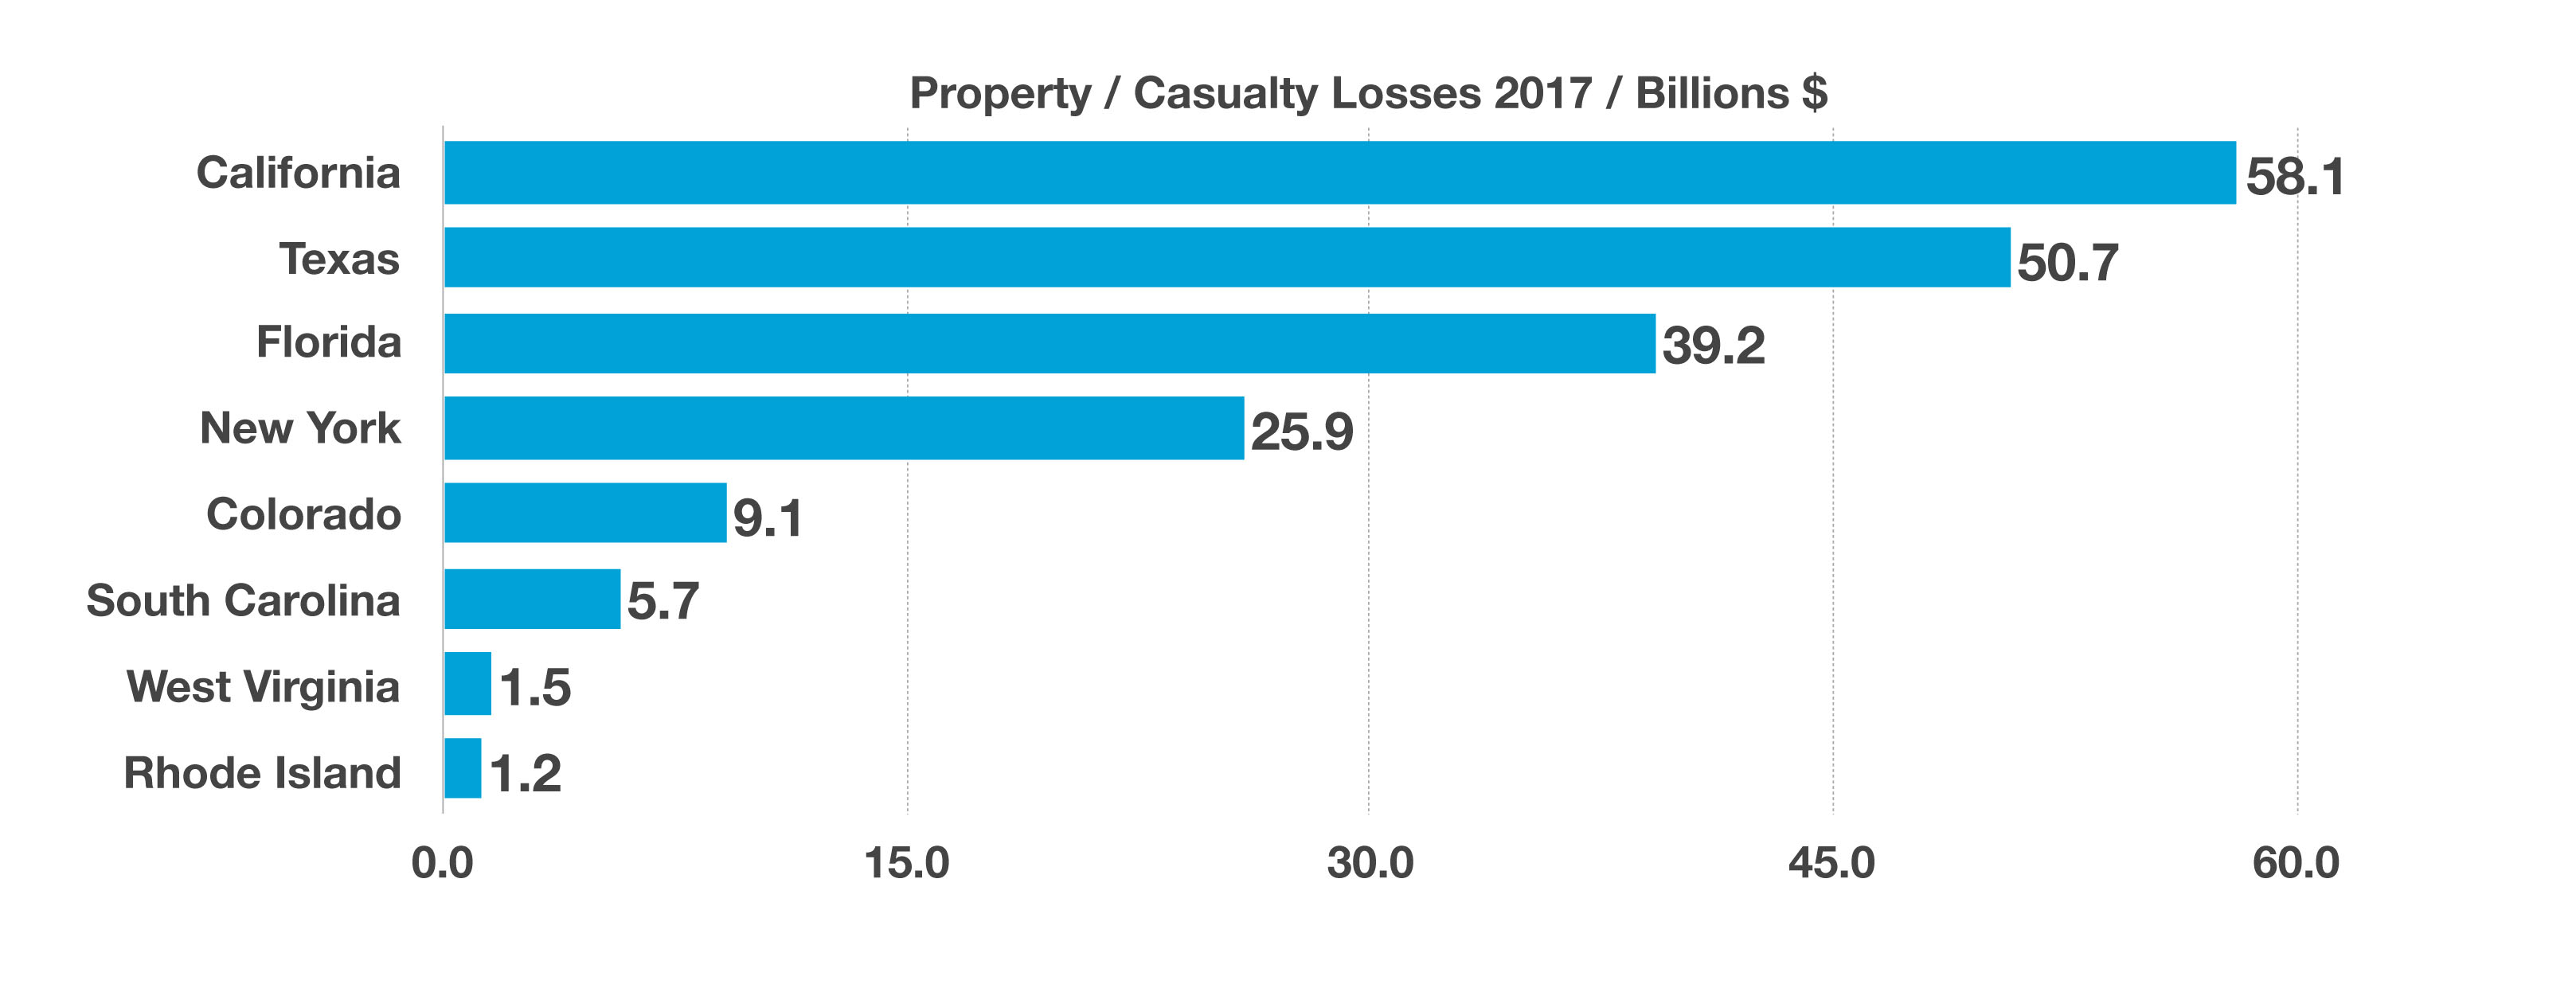
Real estate values in storm and fire ravaged areas of the country are coming under pressure as potential buyers reassess the environmental risks that have become increasingly apparent.

According to the National Retail Federation (NRF), there were roughly 165 million Black Friday Weekend store and online shoppers this year, less than the 174 million from last year’s. The NRF found that the average shopper spent $313 during the Black Friday sales days, down from the $335 figure in 2017. The NRF suspects that shoppers are starting their spending earlier in the season, now immediately after Halloween, rather than waiting until Thanksgiving.               (Sources: g20.org, Federal Reserve, NFR, IEA, Commerce Department)

 
10 year Treasury bond yields fall from 3.24% to 3.01% in November

Year End Volatility For Equities – Global Equity Market Overview

Major U.S. equity indices stabilized in November as markets reassessed October’s pullback. The Dow Jones Industrial and S&P 500 indices made up of larger cap stocks rebounded over 1.5% in November, outpacing the tech heavy Nasdaq index for the month. 

Emerging market equities rebounded in November as the dollar’s rise slowed and investors found value in various developing economies. Ongoing tariff and trade tensions have been hampering capital investment and trading arrangements for companies in the emerging markets. Many hope that U.S. companies will use excess cash for capital investment rather than for stock buybacks, which has been a primary use of cash for many domestic companies.

Some analysts expect that the Fed’s perceived slow down in rising rates, along with the trade and tariff arrangements that occurred as a result of the G20, may prove positive and supportive for the markets following weeks of rampant volatility. Some companies have been holding back on hiring and capital expenditures until a resolution is finally achieved on trade. (Sources: S&P, Dow Jones, FRED, Bloomberg)

Rates Fall In November – Fixed Income Update

The recent trend in rising rates slowed in November as expectations intensified that the Fed may not raise as ambitiously in 2019 as initially projected. The yield on the 10-year Treasury bond fell from 3.24% at the beginning of the month to 3.01% at month’s end. The drop in rates may be interpreted by equity markets as either positive or negative.

Federal Reserve officials acknowledged the adoption of a more flexible process in gradually increasing rates in 2019, where a neutral rate is targeted. The so-called neutral stance taken by the Fed causes uncertainty as to how the Fed perceives the direction of economic growth, as the neutral rate generates monetary policy that is neither stimulative nor restrictive. Many believe that the impact of the Fed’s rate hikes this year have not yet fully materialized, thus creating a neutral stance for the Fed to allow it time to decide. (Sources: U.S. Treasury Dept., Federal Reserve, U.S. Treasury)

Oil Prices Take A Large Drop – Commodities Update

Global oil prices declined sharply in November, with the domestic benchmark (WTI) falling 22% for the month, the single largest monthly drop in 10 years. The steep drop in price is a result of increased production by U.S. producers as well as Saudi Arabia, Russia, and OPEC. The recent price decline is of grave concern to OPEC, Russia, and Saudi Arabia, whose breakeven cost for oil production is estimated to be higher than U.S. production. The rapid expansion of supply in the U.S. has resulted in large amounts of unrefined oil in storage, which must then reach refineries for the final transformation into gasoline. Construction of new pipelines and transportation infrastructure in the U.S. will facilitate the shipment of crude oil much more rapidly and efficiently over the next few years. The United States is currently exporting more oil than it is importing, which helps insulate the country from global price swings and adds leverage for U.S. producers competing with foreign producers. U.S. exports of crude oil and petroleum products have more than doubled since 2010 according to the Department of Energy. (Sources: Department of Energy, IEA)


Buyers are finding better values in used cars

Used Car Sales Are Heading Higher – Consumer Behavior

Over the past few months, the demand for used automobiles has been rising with the difference in prices between new autos and used autos the largest it has been in years. Consequently, as the demand for used cars has increased, so have used car prices, as tracked by the Federal Reserve Bank of St. Louis. Even with the recent price gains, used automobiles are still less expensive than a comparable new automobile.

With nearly 40 million used cars sold last year, the used car market is now twice as large as the new car market. Dealers are finding higher margins on used cars versus new cars, transitioning sales and marketing efforts from new car sales to used car sales. As auto manufacturers ramped up lease incentives 2-5 years ago, those same cars are now coming back to dealerships and resold as used vehicles. Buyers are finding better values in used cars, most of which are well maintained lease returns with low mileage. Various factors are contributing an increase to new car prices, including rising loans rates, tariff concerns, and minimal sales incentives. The rise in used car prices, on the other hand, is simply a result of an increasing demand for limited supply.

New car prices have steadily risen as manufacturers supplied vehicles with advanced technology and expensive options. A 2-5 year old used car with low miles will have depreciated in price relative to paying full price for a new vehicle with similar features. (Sources: FRED; Federal Reserve Bank of St. Louis)

Insurance Losses By State Are Adding Up – Insurance Sector Review

As natural disasters mount from wild fires in California to hurricanes and flooding in Texas, Florida and the East coast, insurance claims are in the billions of dollars and growing. Most major insurance companies offer and issue various types of insurance, including liability, fire, flood, earthquake and homeowners. As claims increase with one or two of the coverage segments, coverage costs may increase with the others as well. Insurance companies are intertwined and coverage costs are related. Some insurance companies spread their costs across all policyholders nationwide as opposed to centralizing higher premiums to one geographic region. Homeowners in coastal states from Texas and Florida to North Carolina are seeing rates rise faster than in other parts of the country, as the threat of future storms and flooding remains relatively high. In California, some insurance companies have designated several additional regions as high risk areas to insure. (Sources: NAIC, Insurance Information Institute)

 
34.2 million adults provide some sort of unpaid care for elders

Tax Breaks For Family Caregivers – Tax Planning

As the number of elderly has grown nationwide, so has the need for caregivers. The baby boom generation, the largest demographical segment of the U.S. population at 74 million, are now entering their late 60s and early 70s. Many are still very capable of caring for themselves, but others are in need of assistance as they progress into their senior years. 

Unfortunately for many, the costs associated with an assisted living facility are not feasible and in other cases, not an option just yet. So instead, a growing number of elderly are staying in their homes or living with their families. Many times, a son or daughter will move in with mom or dad and essentially become their part-time or full-time caregiver. Some elderly end up moving in with family members where they actually become part of the household. The challenge for family members that act as caregivers is the financial burden that may be imposed. An estimated 34.2 million adults provide some sort of unpaid care for elders aged 50 and older in 2015. Over 85% of these caregivers provide assistance directly for relatives. The average caregiver commits over 24 hours per week in providing care for elders. Even though there is no actual pay for family member caregivers, there is a tax break when done properly. Under the new tax rules, taking a personal exemption for a qualified friend or family member has been replaced by the larger standard deduction. However, the rules still allow caregivers to claim those receiving care as dependents as long as the following criteria are met for the person being cared for:

The person cared for is a relative as defined by the IRS or a non-resident that has lived with the caretaker for at least six months; Earns less than $4,050 (2017) per year, not including Social Security or disability benefits; Is unable to pay over 50% of personal living expenses; Can’t be claimed as a dependent by anyone else.

In addition to federal tax considerations, some states also allow for special tax credits meant solely for caregivers. Taxpayers should verify with their state of residency to confirm any additional tax credits. (Sources: U.S. Census Bureau, IRS.gov)

 
...the only free lunch in finance. - Harry Markowitz

Should You Diversify?

As 2019 approaches, and with US stocks outperforming non-US stocks in recent years, some investors have again turned their attention towards the role that global diversification plays in their portfolios.

For the five-year period ending October 31, 2018, the S&P 500 Index had an annualized return of 11.34% while the MSCI World ex USA Index returned 1.86%, and the MSCI Emerging Markets Index returned 0.78%. As US stocks have outperformed international and emerging markets stocks over the last several years, some investors might be reconsidering the benefits of investing outside the US.

While there are many reasons why a US-based investor may prefer a degree of home bias in their equity allocation, using return differences over a relatively short period as the sole input into this decision may result in missing opportunities that the global markets offer. While international and emerging markets stocks have delivered disappointing returns relative to the US over the last few years, it is important to remember that:

  1. Non-US stocks help provide valuable diversification benefits.
  2. Recent performance is not a reliable indicator of future returns.


THERE’S A WORLD OF OPPORTUNITY IN EQUITIES

The global equity market is large and represents a world of investment opportunities. As shown in Exhibit 1, nearly half of the investment opportunities in global equity markets lie outside the US. Non-US stocks, including developed and emerging markets, account for 48% of world market capitalization and represent thousands of companies in countries all over the world. A portfolio investing solely within the US would not be exposed to the performance of those markets.

 
investor pursuing the equity premium should consider a global allocation

Should We Diversify (continued)

THE LOST DECADE

We can examine the potential opportunity cost associated with failing to diversify globally by reflecting on the period in global markets from 2000–2009. During this period, often called the “lost decade” by US investors, the S&P 500 Index recorded its worst ever 10-year performance with a total cumulative return of –9.1%. However, looking beyond US large cap equities, conditions were more favorable for global equity investors as most equity asset classes outside the US generated positive returns over the course of the decade. (See Exhibit 2.) Expanding beyond this period and looking at performance for each of the 11 decades starting in 1900 and ending in 2010, the US market outperformed the world market in five decades and underperformed in the other six.[1] This further reinforces why an investor pursuing the equity premium should consider a global allocation. By holding a globally diversified portfolio, investors are positioned to capture returns wherever they occur.

Exhibit 2. Global Index Returns  January 2000–December 2009

Total Cumulative
Return (%)
S&P 500 Index           -9.10
MSCI World ex USA Index (net div.)           17.47
MSCI World ex USA Value Index (net div.)           48.71
MSCI World ex USA Small Cap Index (net div.)           94.33
MSCI Emerging Markets Index (net div.)         154.28
MSCI Emerging Markets Value Index (net div.)          212.72

S&P data © 2018 S&P Dow Jones Indices LLC, a division of S&P Global. All rights reserved. MSCI data © MSCI 2018, all rights reserved. Indices are not available for direct investment. Index performance does not reflect expenses associated with the management of an actual portfolio. Past performance is not a guarantee of future results.


PICK A COUNTRY?

Are there systematic ways to identify which countries will outperform others in advance? Exhibit 3 illustrates the randomness in country equity market rankings (from highest to lowest) for 22 different developed market countries over the past 20 years. This graphic conveys how difficult it would be to execute a strategy that relies on picking the best country and the resulting importance of diversification.

 
difference between the best and worst performing countries can be significant

In addition, concentrating a portfolio in any one country can expose investors to large variations in returns. The difference between the best- and worst‑performing countries can be significant. For example, since 1998, the average return of the best‑performing developed market country was approximately 44%, while the average return of the worst-performing country was approximately –16%. Diversification means an investor’s portfolio is unlikely to be the best or worst performing relative to any individual country, but diversification also provides a means to achieve a more consistent outcome and more importantly helps reduce and manage catastrophic losses that can be associated with investing in just a small number of stocks or a single country.

Over long periods of time, investors may benefit from consistent exposure in their portfolios to both US and non‑US equities. While both asset classes offer the potential to earn positive expected returns in the

 
Not Too Late For Timely Year End Tax Actions

long run, they may perform quite differently over short periods. While the performance of different countries and asset classes will vary over time, there is no reliable evidence that this performance can be predicted in advance. An approach to equity investing that uses the global opportunity set available to investors can provide diversification benefits as well as potentially higher expected returns.

Timely Year End Tax Actions – Tax Planning

The change in the standard deduction and how taxpayers have been accustomed to using it may be the single most important factor for tax planning into 2019. The increase in the standard deduction is designed to simplify taxes for millions of tax payers. So rather than itemizing deductions, some taxpayers will instead just take the standard deduction, which has increased to $24,000 for married couples filing jointly. The IRS estimates that about 28 million taxpayers who would otherwise have itemized various deductions will be taking the single expanded standard deduction instead.

Defer Income: While salaried (W2) workers generally can’t choose when they get paid, business owners can often delay registering income until the following year, lowering their April tax bill in the process. New this year is a 20% tax deduction on income from partnerships and other pass-through entities subject to phase-out limits. Planning to stay under the income thresholds is beneficial.

Capital Losses: Individual investors can also modify taxable income and lower capital gains realization by selling stocks with a loss or waiting to sell stocks with a gain until 2019. The losses can offset gains realized and an additional $3,000 of ordinary income. The remaining loss will then carry forward to next year. 

For those who continue to itemize here are a few common year-end practices in order to maximize tax benefits for the year:

Charitable Donations: Making last minute charitable contributions could be even more effective.  Consider bunching deductions every other year or establishing a donor advised fund to bank donations instead of annual gifts.

Accelerate Medical Expenses: Medical expenses are deductible to the extent they exceed 7.5% of your AGI (adjusted gross income). In 2019, the threshold will increase to 10% of your AGI.

Lastly, maximize your 401(k) contributions before Dec 31st. Participants in employer sponsored 401(k) plans have the ability to contribute up to $18,500 for 2018, along with an additional $6,000 catch up contribution for workers age 50 and older. If you’re not covered by a 401(k) plan, you may be eligible to deduct an IRA contribution of up to $5,500 for 2018, along with an additional $1,000 catch up contribution for individuals age 50 and older. Remember, there are limitations on taking IRA deductions based on income.

If you’re 70 ½ or older and have money in an IRA, 401(k), or any type of employer sponsored retirement plan, you need to make sure that you’ve satisfied the Required Minimum Distribution (RMD) for the accounts. Failure to take the full, required withdrawal can result in a penalty of 50% of the amount of the RMD not withdrawn. (Sources: IRS, www.govtrack.us/congress/bills/115/hr1)