Ocean Park Capital Management

2503 Main Street

Santa Monica, CA 90405

Main: 310.392.7300

Daily Performance Line:  310.281.8577

Fund Overview - November 2018
Market Update
(all values as of 06.28.2024)

Stock Indices:

Dow Jones 39,118
S&P 500 5,460
Nasdaq 17,732

Bond Sector Yields:

2 Yr Treasury 4.71%
10 Yr Treasury 4.36%
10 Yr Municipal 2.86%
High Yield 7.58%

YTD Market Returns:

Dow Jones 3.79%
S&P 500 14.48%
Nasdaq 18.13%
MSCI-EAFE 3.51%
MSCI-Europe 3.72%
MSCI-Pacific 3.05%
MSCI-Emg Mkt 6.11%
 
US Agg Bond -0.71%
US Corp Bond -0.49%
US Gov’t Bond -0.68%

Commodity Prices:

Gold 2,336
Silver 29.43
Oil (WTI) 81.46

Currencies:

Dollar / Euro 1.06
Dollar / Pound 1.26
Yen / Dollar 160.56
Canadian /Dollar 0.73

Fund Overview

Equities gained ground in November, while the Ocean Park funds posted fractional losses.  Key positions in technology (Apple, and some specialty semiconductor makers) and retail (Nordstrom and Target) were particularly weak.  However, the funds remain in positive territory for the year to date, ahead of the HFRI Equity Hedge Index which is down 3.32%.

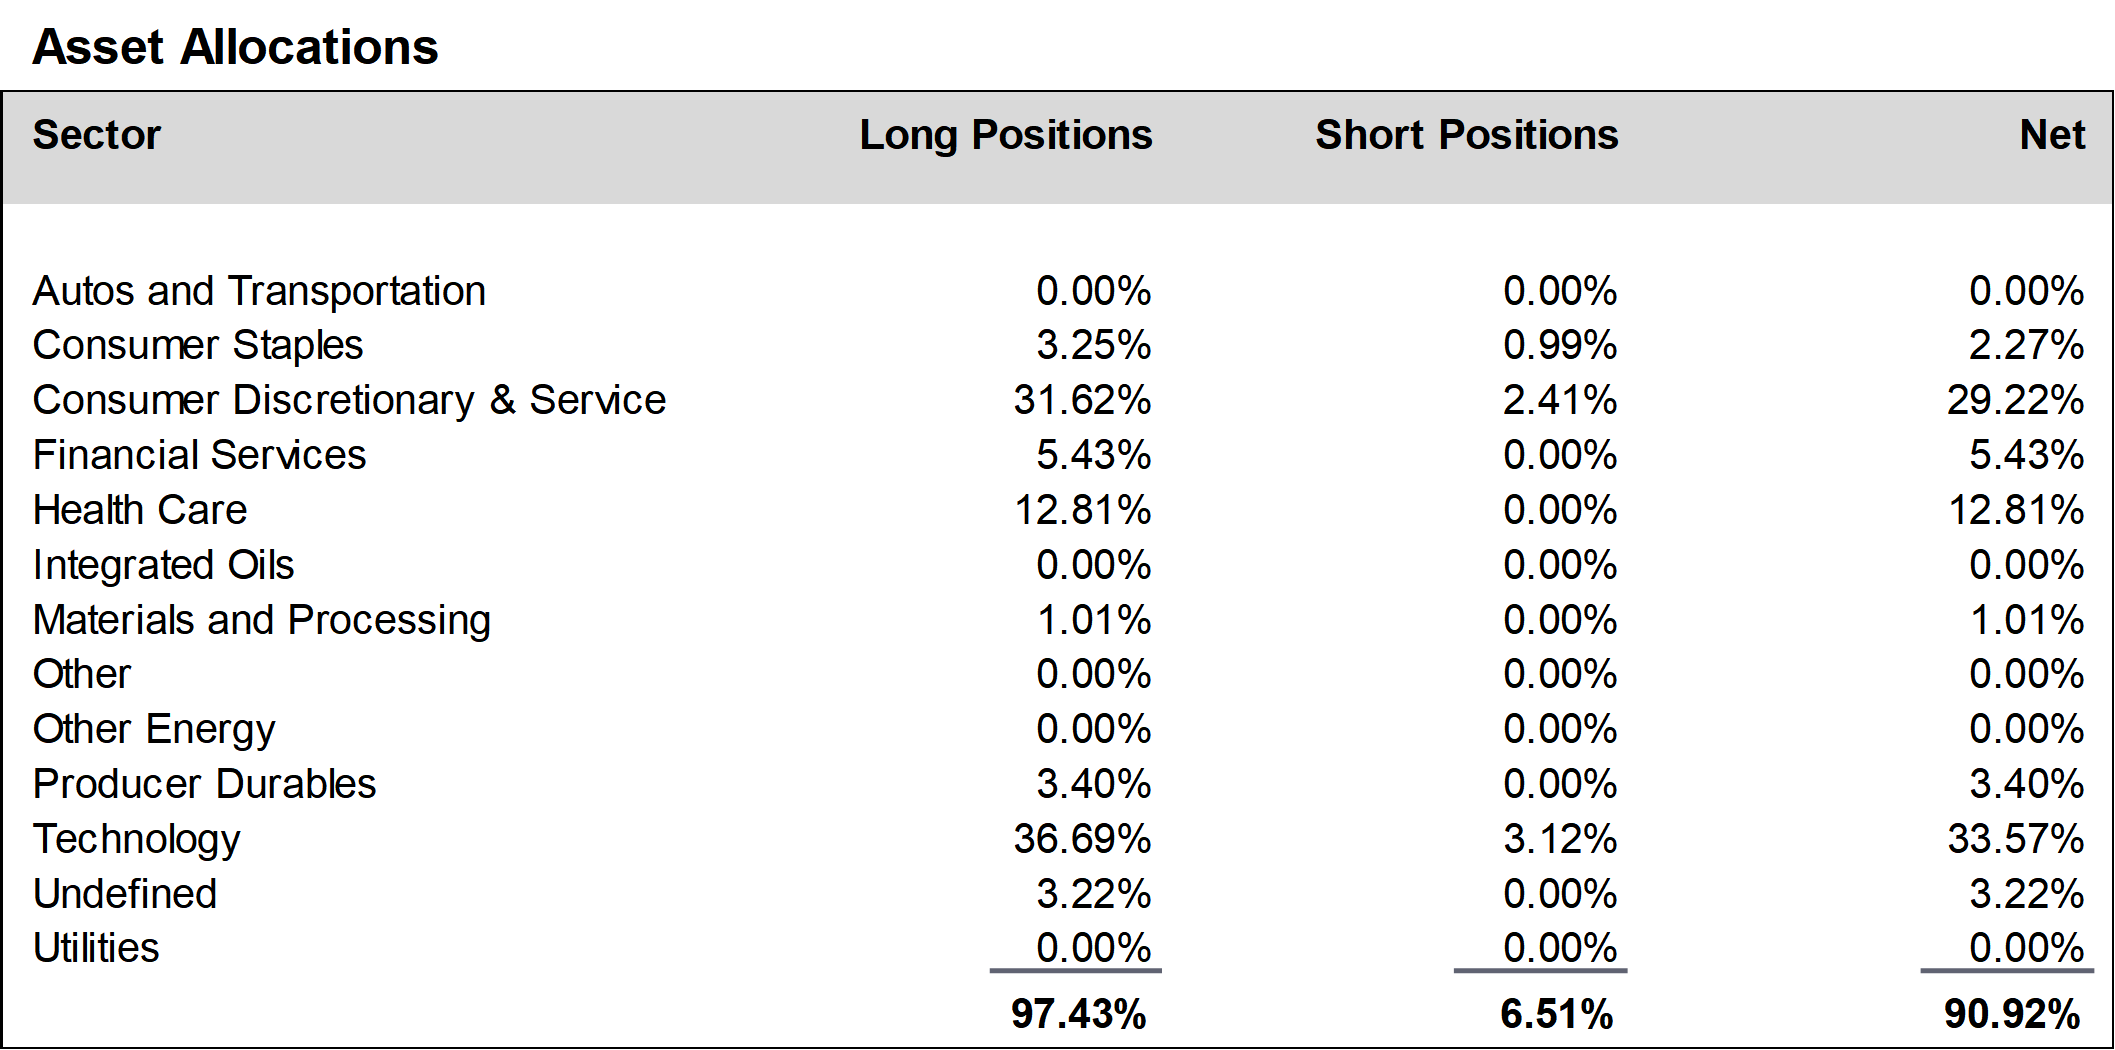
During November, we added to positions in the consumer discretionary and service sector and reduced positions in the technology and consumer staples sectors.  We ended the month at about 91% net long, up from about 88 % in October.

A schedule showing the performance of the Investors Fund is included below, along with our Asset Allocation Chart. Daily updates on our activity are available on our Results Line, at
310-281-8577, and current information is also maintained on our website at www.oceanparkcapital.com. To gain access to the site enter password opcap.


*These results are pro forma. Actual results for most investors will vary. See additional disclosures on page 4. Past performance does not guarantee future results.

 
Equity Overview - November 2018

Equity Overview

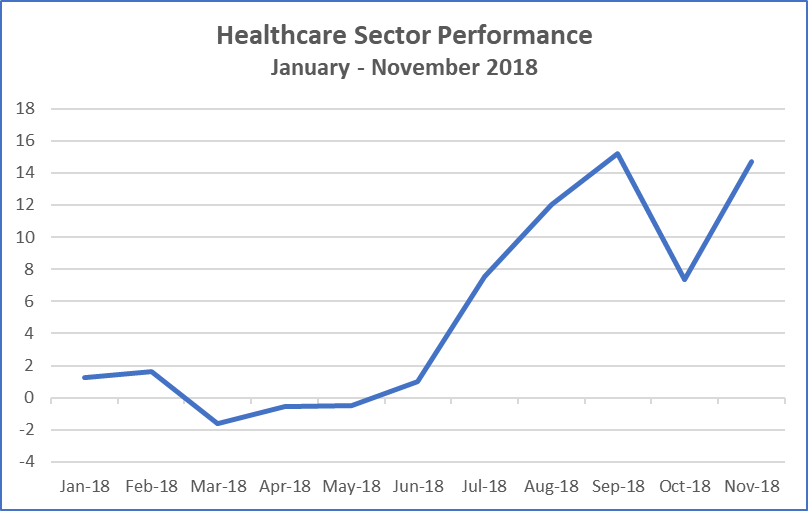
Volatility subsided somewhat in November.  Value stocks outperformed growth stocks for the third straight month, and large cap stocks outperformed mid-cap and small cap stocks.  Healthcare stocks were the best sector.

As the third quarter earnings season drew to a close, corporate results continued strong.  With 92% of S&P 500 companies reporting, the blended growth rate for third quarter earnings was 25.7%.  Upside earnings surprises at a 78% pace, and upside revenue surprises at 61%, were both above their five-year averages.  However, as occurred in October, the market failed to reward good earnings in November, and punished companies that failed to beat expectations.


Macro Overview - November 2018

Macro Overview

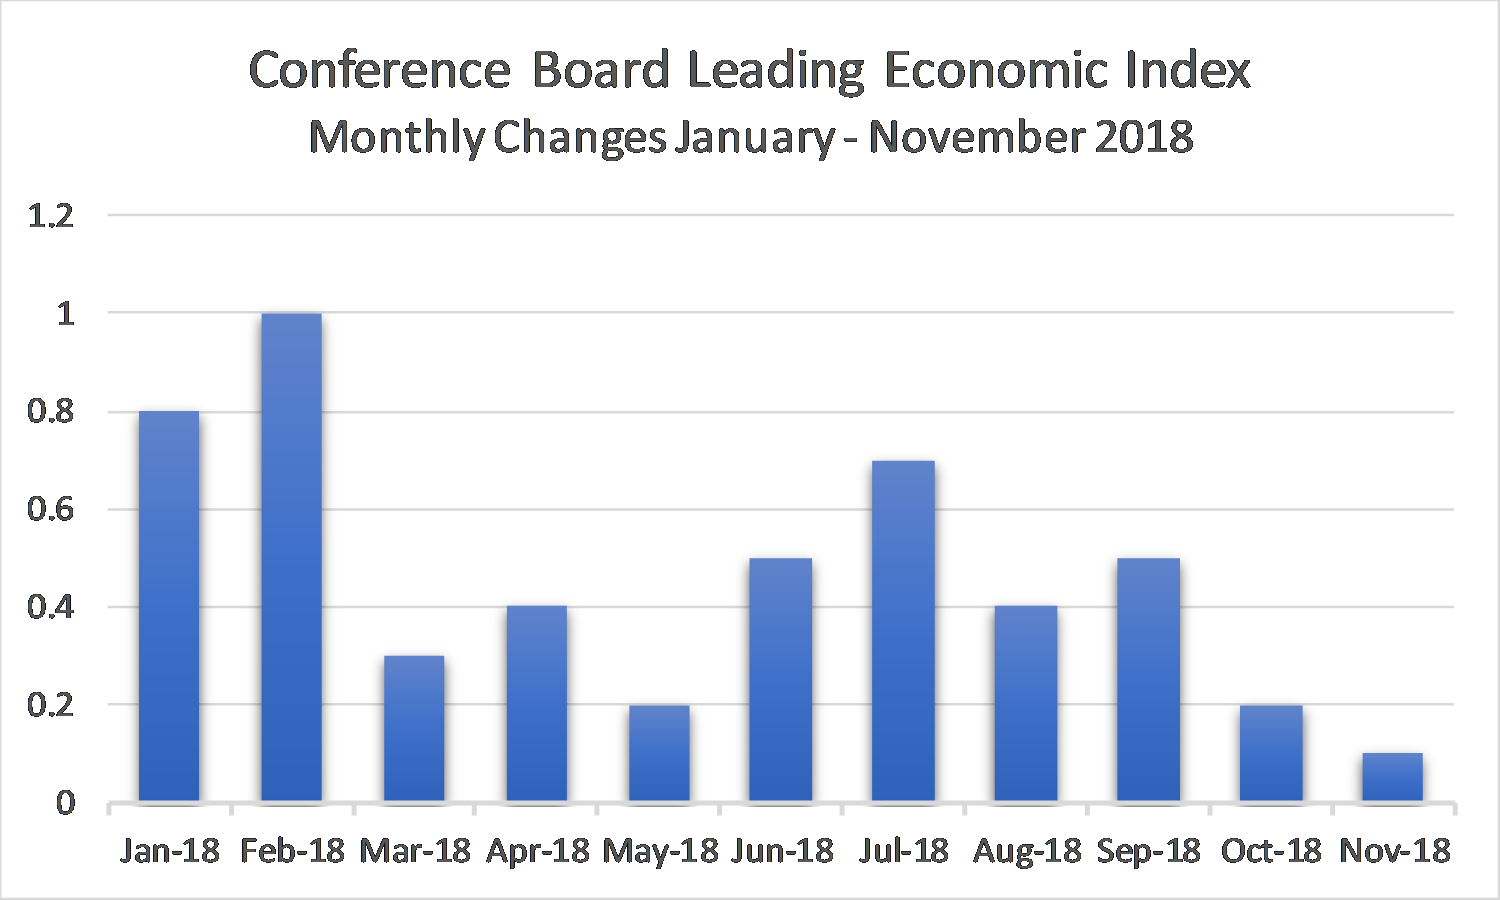
Economic data reported in November raised more concern about the economy.  While employment is strong and the economy continues to grow, the Conference Board Leading Economic Index gained only 0.1%, its lowest increase in five months.  Some major sectors showed weakness, including auto manufacturing, agriculture, and home building.  New home sales fell 8.9% to the lowest level since March 2016.  The price of oil fell 22%, reflecting increased supply and reduced demand.  And yields on the 10-year Treasury note moved lower, suggesting a “flight to safety” and low confidence.

While there is talk of recession, analyst consensus suggests continued growth but at reduced levels, as the “sugar high” from the $1.5-trillion tax cut begins to wear off.  In this connection, it is worth noting that this is the tenth year of economic expansion.  If it continues through the summer of 2019, it will be the longest period of expansion in the U.S. economy since the Civil War.


Additional Disclosures and Privacy Notice - November 2018

Additional Disclosures

Performance data for OPI reflect the reinvestment of dividends and other earnings on the fund’s assets.  Performance data for the major indices reflect only changes in the value of those indices, and would be higher if dividends were included. However, the index data do not reflect fees that would be paid to index fund managers and transaction costs that would be incurred when their component stocks are bought or sold, while OPI’s data do reflect quarterly fees and expenses incurred by the fund.  The information provided is believed to be reliable, but its accuracy or completeness is not warranted. This material is not intended as an offer or solicitation for the purchase or sale of any stock, bond, mutual fund, or any other financial instrument. The views and strategies discussed herein may not be appropriate and/or suitable for all investors. This material is meant solely for informational purposes, and is not intended to suffice as any type of accounting, legal, tax, or estate planning advice. Any and all forecasts mentioned are for illustrative purposes only and should not be interpreted as investment recommendations.


Privacy Notice

Federal privacy laws require that we explain to you how we handle “nonpublic personal information.”  This is information we receive or develop about you in the course of our relationship with you.  It includes information you provide to us orally or in the Confidential Investor Questionnaire or other forms, and information we learn about you in the course of providing services to you.

We do not disclose nonpublic personal information about you to third parties, except in certain limited circumstances.  These circumstances include (a) disclosure to our attorneys, auditors, prime brokers, or custodians in the course of providing services to you, (b) disclosure with your consent, or (c) disclosure where required by law or judicial process, such as a court order.

We also restrict your nonpublic personal information to those employees who need to know such information in order to provide services to you.  And we maintain physical, electronic, and procedural safeguards to protect your nonpublic personal information.

Please call us at (310) 392-7300 if you have any questions.