Ocean Park Capital Management
2503 Main Street
Santa Monica, CA 90405
Main: 310.392.7300
Daily Performance Line: 310.281.8577
| Dow Jones | 47,716 |
| S&P 500 | 6,849 |
| Nasdaq | 23,365 |
| 2 Yr Treasury | 3.47% |
| 10 Yr Treasury | 4.02% |
| 10 Yr Municipal | 2.74% |
| High Yield | 6.58% |
| Dow Jones | 12.16% |
| S&P 500 | 16.45% |
| Nasdaq | 21.00% |
| MSCI-EAFE | 24.26% |
| MSCI-Europe | 27.07% |
| MSCI-Emg Asia | 26.34% |
| MSCI-Emg Mkt | 27.10% |
| US Agg Bond | 7.46% |
| US Corp Bond | 7.99% |
| US Gov’t Bond | 7.17% |
| Gold | 4,253 |
| Silver | 57.20 |
| Oil (WTI) | 59.53 |
| Dollar / Euro | 1.15 |
| Dollar / Pound | 1.32 |
| Yen / Dollar | 156.21 |
| Canadian /Dollar | 0.71 |
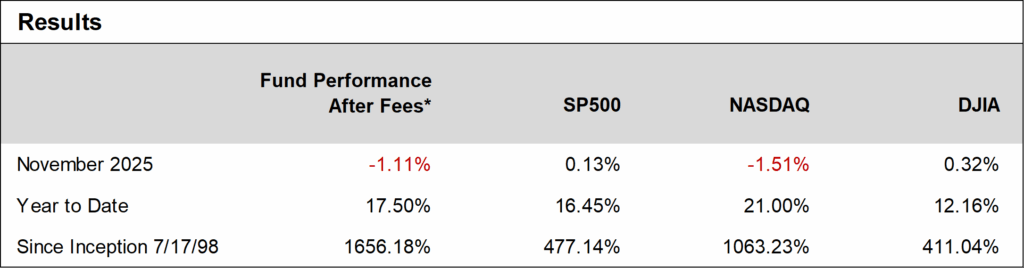
Ocean Park Investors Fund declined 1.11%* in November, modestly ahead of the NASDAQ Composite (down 1.51%) and behind the S&P 500 (up 0.13%). A broad downdraft in technology stocks impacted the portfolio, as investors took profits in crowded AI and growth names. The fund’s position in Lumentum was a notable exception, gaining 61% on a strong earnings beat, as well as higher guidance tied to AI and cloud‑optics demand, and several analyst upgrades.
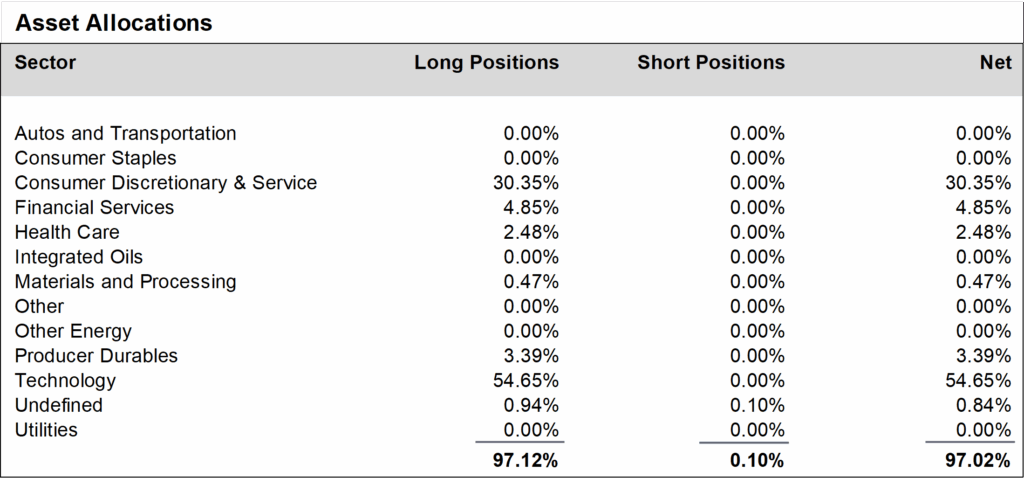
The Fund’s November results reflected a mix of earnings-driven volatility in several growth holdings and active repositioning around analyst estimate revisions and guidance changes. During the month, we trimmed or exited positions in Axon, HubSpot, Disney, Celsius, and selected semiconductors after disappointing or mediocre earnings reports and guidance. We replaced them with positions in companies where analysts raised earnings estimates meaningfully higher, including ASML, Seagate Technology, Ross Stores, CrowdStrike, and Morgan Stanley. We finished the month at about 97% net long, unchanged from October.
Daily updates on our activity are available on our Results Line, at 310-281-8577, and on our website at www.oceanparkcapital.com. Enter password opcap.
*These results are pro forma. Actual results for most investors will vary. Additional disclosures on page 4. Past performance does not guarantee future results.
Equity performance was uneven in November as eight of eleven sectors rose and three declined. Healthcare was the best performer. In a turnaround from October, technology went from best to worst as market exuberance about AI took a pause. Reflecting the change in sentiment, value stocks outperformed growth. Volatility increased as the S&P 500 moved more than 1% on 6 of 19 trading days.
Third quarter earnings reported in November maintained the impressive pace in October. With results now in for 95% of S&P 500 companies, 83% have beaten consensus earnings estimates and 76% have beaten revenue estimates, in both cases better than the 1-year and 5-year averages.
Earnings remained the primary driver of dispersion, with companies that beat and raised guidance, or benefited from aggressive upward estimate revisions, often seeing substantial upside moves, while those with merely in‑line or disappointing results faced quick de‑rating. Analyst commentary and target revisions around key themes such as AI, cloud security, semiconductors, and select consumer names played an outsized role in November’s stock‑specific performance, reinforcing a market environment where fundamentals and estimate trends, rather than broad multiple expansion, dictated leadership.
The forward price/earnings ratio for the S&P 500 at month’s end declined to a more moderate 21.5, down from 23.1 in October but still above the 5-year and 10-year averages.
Although the longest government shutdown in history ended in mid-November, most government agencies have not caught up with producing their economic data. One exception is the September employment report generated by the Bureau of Labor Statistics which showed a 3-month job-creation average of 62,000, well below the 2-year average of 137,000. Private estimates of GDP growth average about 1.9% for 2025 and 1.9% for 2026, which are significantly below the 2.8% GDP growth in 2024. Consumer confidence data, also generated by the private sector, indicated significant declines in November.
Against this backdrop, markets have been focused on the prospects for an interest rate cut at the Fed’s December meeting. Those prospects advanced notably after comments from New York Fed President John Williams on November 21. Williams, who is widely viewed as the second-most influential member of the Fed Open Market Committee behind Chairman Powell, strongly suggested that a rate cut was likely. After his remarks the odds for a cut rose from 25% to 80%.
Bond yields and rate expectations continued to influence sector preferences, as investors assessed how far the prior easing of policy and any future moves might support earnings, balance sheets, and valuations. Within this environment, equity markets remained sensitive to macro headlines around inflation, employment, and consumer strength, yet rewarded companies that could demonstrate clear, data‑backed growth in revenues and earnings, particularly in areas tied to productivity‑enhancing technologies and durable consumer demand.
Performance data for OPI reflect the reinvestment of dividends and other earnings on the fund’s assets. Performance data for the major indices reflect only changes in the value of those indices, and would be higher if dividends were included. However, the index data do not reflect fees that would be paid to index fund managers and transaction costs that would be incurred when their component stocks are bought or sold, while OPI’s data do reflect quarterly fees and expenses incurred by the fund. The information provided is believed to be reliable, but its accuracy or completeness is not warranted. This material is not intended as an offer or solicitation for the purchase or sale of any stock, bond, mutual fund, or any other financial instrument. The views and strategies discussed herein may not be appropriate and/or suitable for all investors. This material is meant solely for informational purposes, and is not intended to suffice as any type of accounting, legal, tax, or estate planning advice. Any and all forecasts mentioned are for illustrative purposes only and should not be interpreted as investment recommendations.
Federal privacy laws require that we explain to you how we handle “nonpublic personal information.” This is information we receive or develop about you in the course of our relationship with you. It includes information you provide to us orally or in the Confidential Investor Questionnaire or other forms, and information we learn about you in the course of providing services to you.
We do not disclose nonpublic personal information about you to third parties, except in certain limited circumstances. These circumstances include (a) disclosure to our attorneys, auditors, prime brokers, or custodians in the course of providing services to you, (b) disclosure with your consent, or (c) disclosure where required by law or judicial process, such as a court order.
We also restrict your nonpublic personal information to those employees who need to know such information in order to provide services to you. And we maintain physical, electronic, and procedural safeguards to protect your nonpublic personal information.
Please call us at (310) 392-7300 if you have any questions.
