Ocean Park Capital Management

2503 Main Street

Santa Monica, CA 90405

Main: 310.392.7300

Daily Performance Line:  310.281.8577

January 2024
Market Update
(all values as of 03.29.2024)

Stock Indices:

Dow Jones 39,807
S&P 500 5,254
Nasdaq 16,379

Bond Sector Yields:

2 Yr Treasury 4.59%
10 Yr Treasury 4.20%
10 Yr Municipal 2.52%
High Yield 7.44%

YTD Market Returns:

Dow Jones 5.62%
S&P 500 10.16%
Nasdaq 9.11%
MSCI-EAFE 5.06%
MSCI-Europe 4.60%
MSCI-Pacific 5.82%
MSCI-Emg Mkt 1.90%
 
US Agg Bond -0.78%
US Corp Bond -0.40%
US Gov’t Bond -0.72%

Commodity Prices:

Gold 2,254
Silver 25.10
Oil (WTI) 83.12

Currencies:

Dollar / Euro 1.08
Dollar / Pound 1.26
Yen / Dollar 151.35
Canadian /Dollar 0.73

 Portfolio Overview

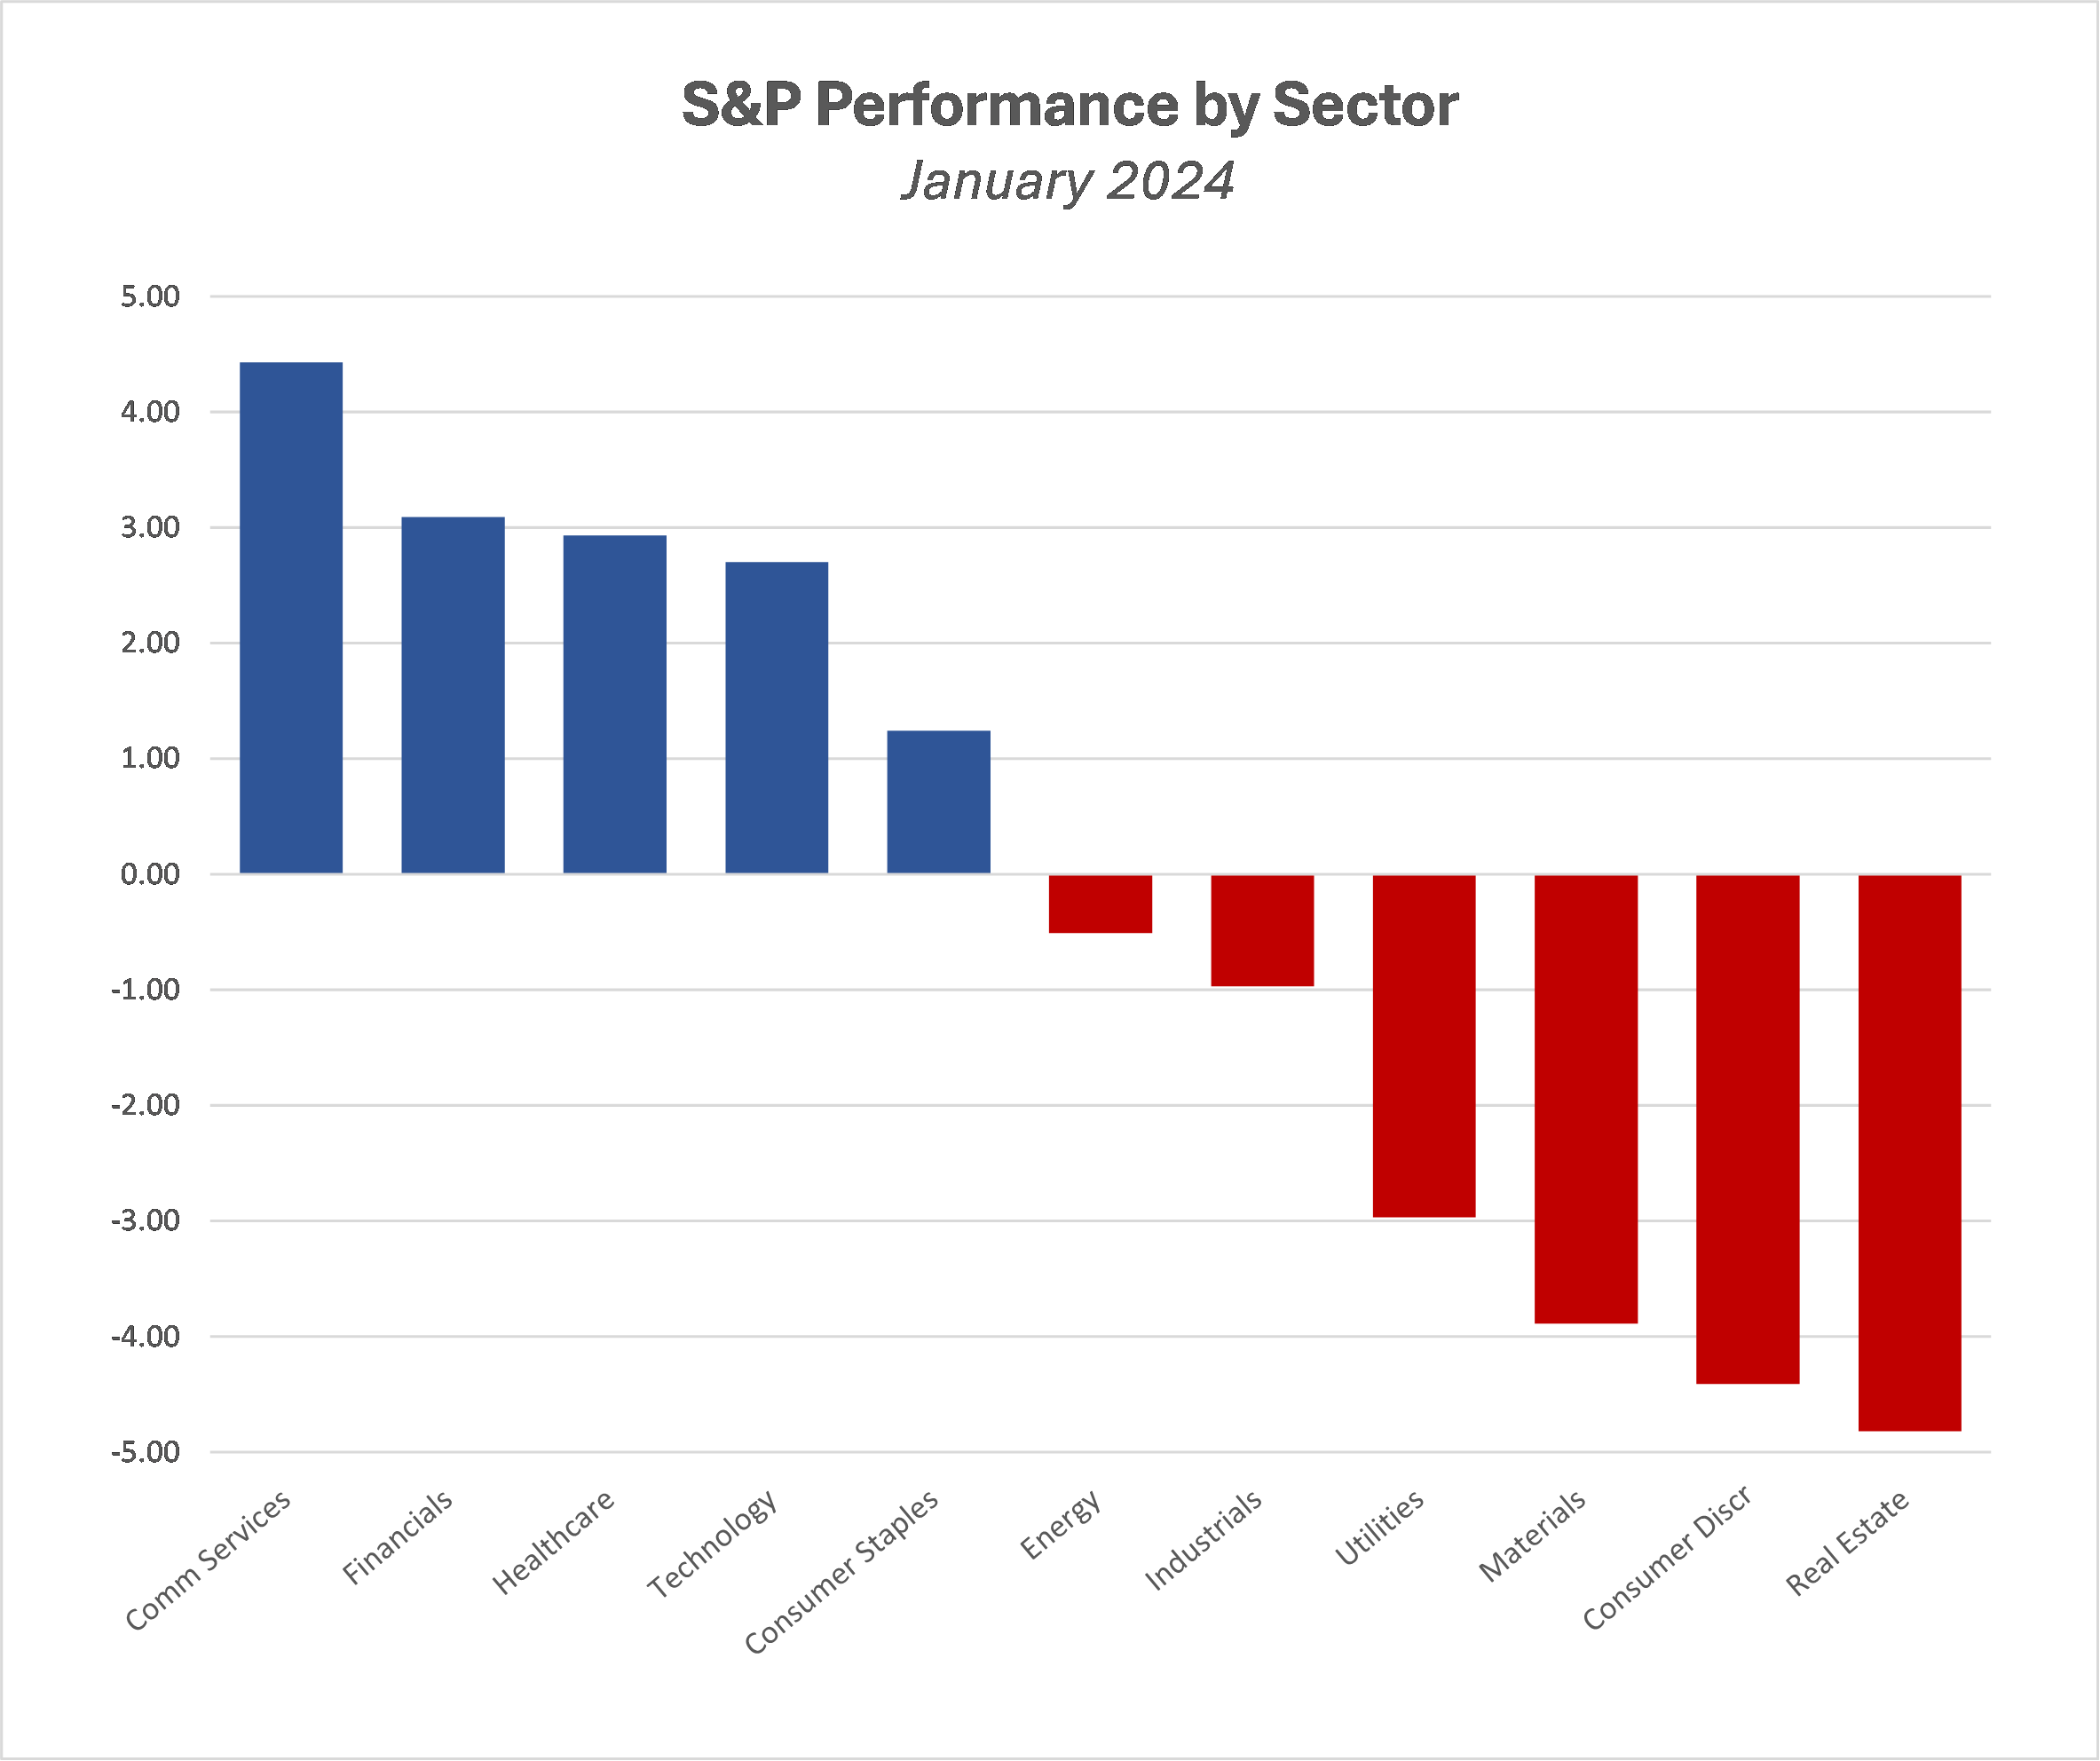
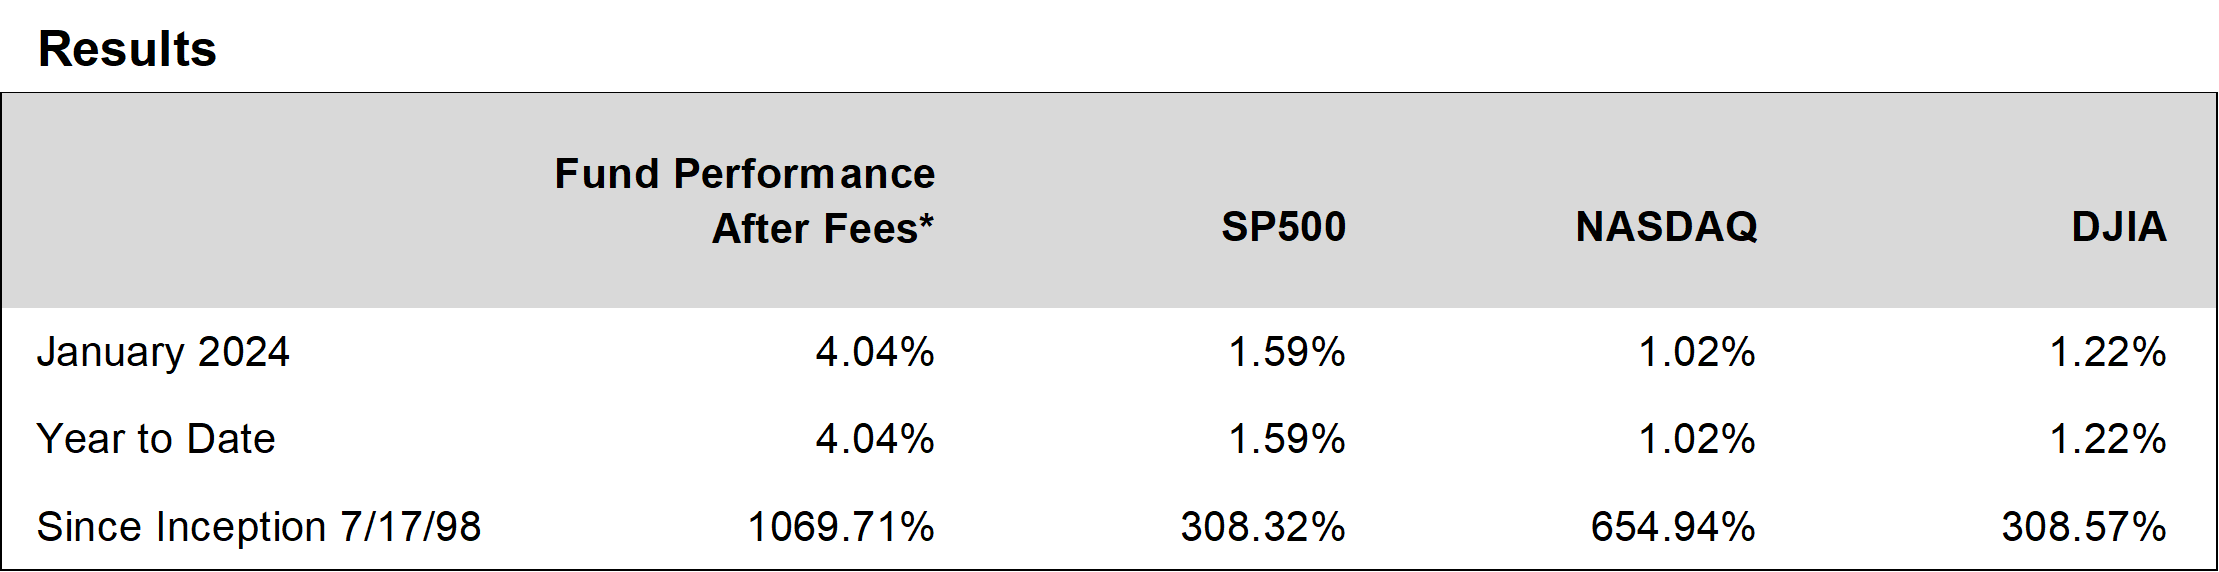
Ocean Park Investors Fund rose 4.04%* in January, while the S&P 500 rose 1.59% and the NASDAQ Composite rose 1.02%.  Technology stocks accounted for more than 80% of the portfolio gains, led by Nvidia which rose 24%.  Déjà vu?  In the January 2023 newsletter, we wrote: “Technology stocks accounted for more than half of the portfolio gains. Chip stocks were particularly strong, led by Nvidia which gained 33%.”

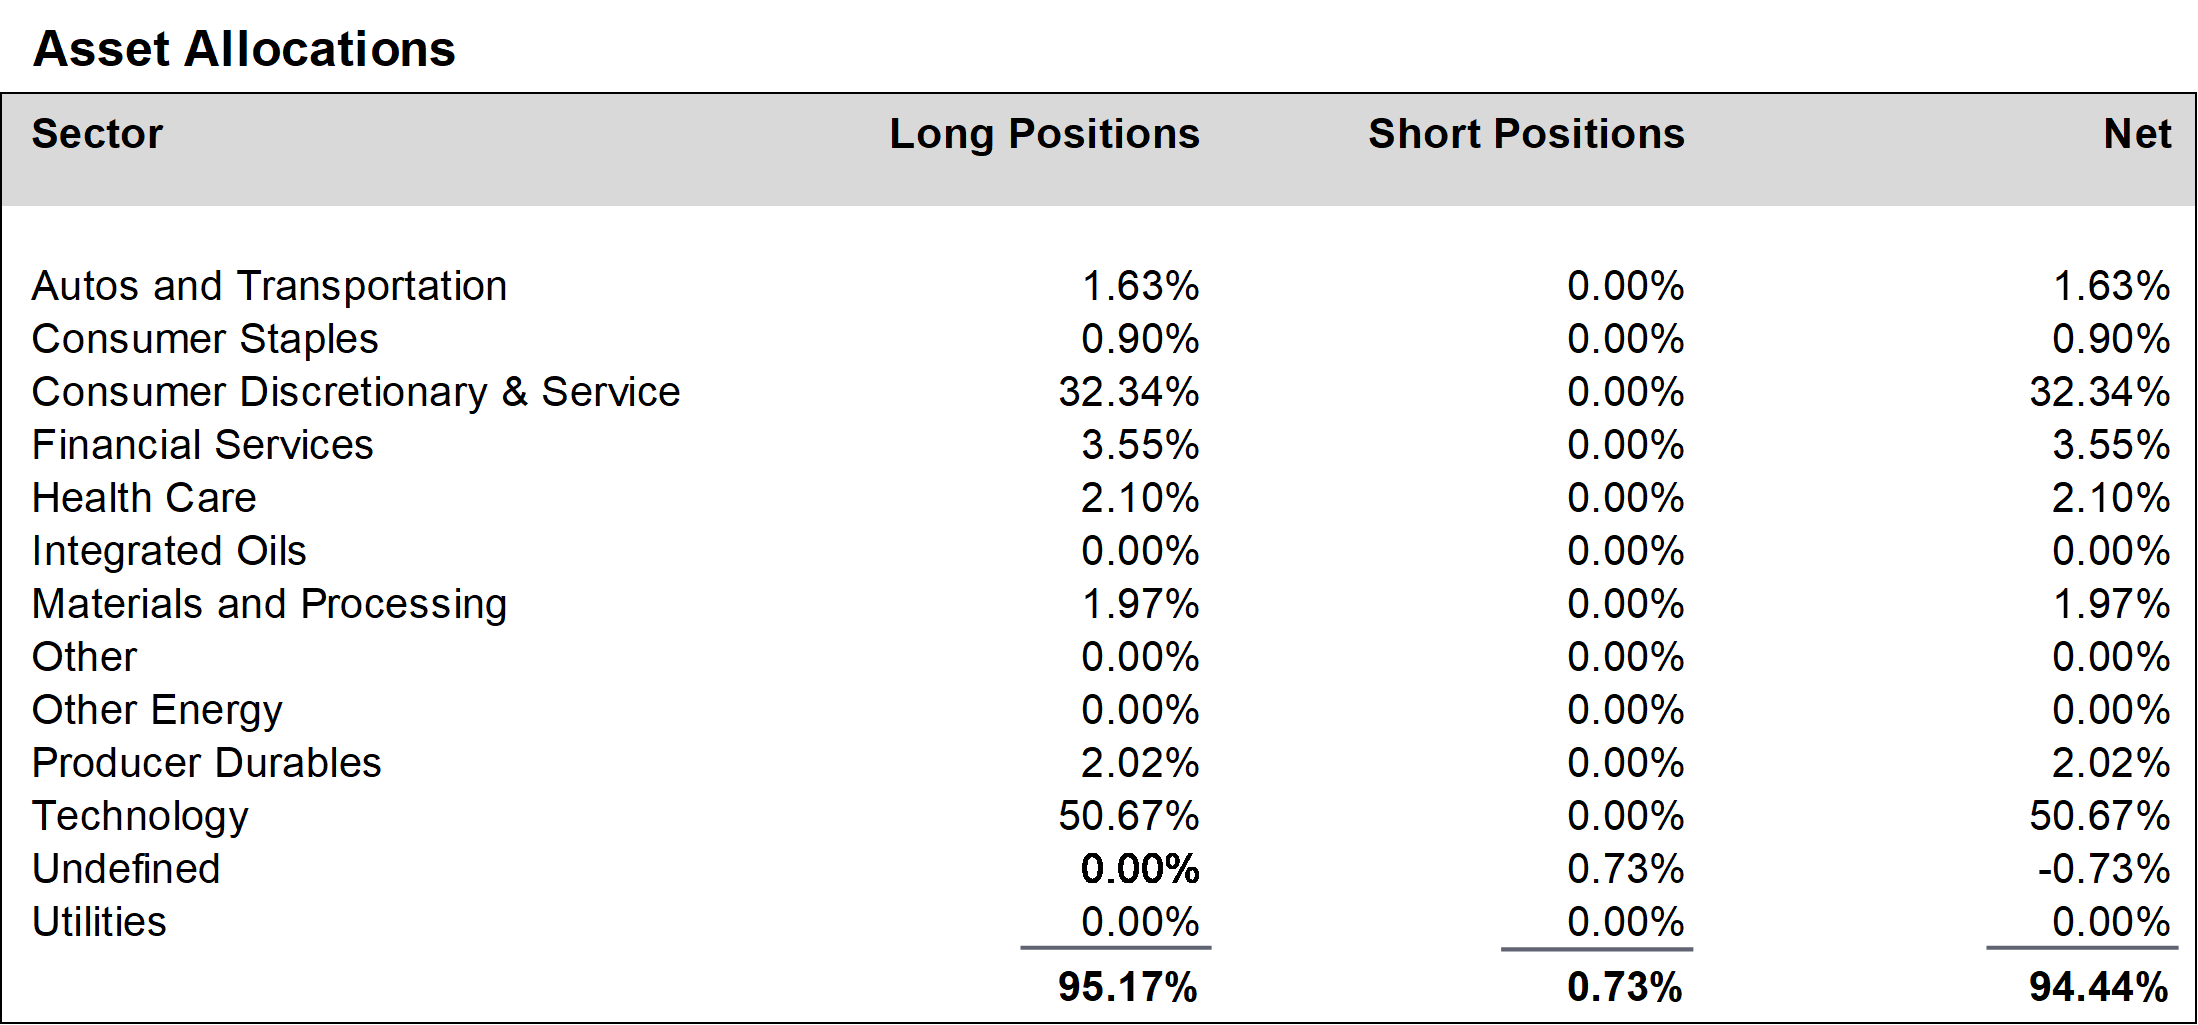
During January, we increased positions in the technology sector and the consumer discretionary and service sector, and reduced positions in the materials and processing sector and the producer durables sector.  We also reduced our exposure to the QQQ ETF.  In addition, we eliminated some stocks before or after reporting disappointing earnings and guidance, including Ameriprise Financial, D.R. Horton, Novartis, and Constellation Brands.  We replaced them with stocks more likely to have positive earnings surprises, such as IBM, Meta Platforms, and Western Digital.  We finished the month at about 94% net long, down from about 97% in December.


Daily updates on our activity are available on our Results Line, at 310-281-8577, and current information is also maintained on our website at www.oceanparkcapital.com. To gain access to the site enter password opcap.

*These results are pro forma. Actual results for most investors will vary. See additional disclosures on page 4. Past performance does not guarantee future results.

 
Equity Overview

Equity Overview

Five of eleven sectors in the S&P 500 rose in January, with communication services the best gainers and real estate the worst losers.  Growth stocks outperformed value.  Volatility was modest, as the S&P 500 moved more than 1% on only 3 of 21 trading days. The S&P 500 set a new closing high intra-month, rising above 4,900. This generated a further increase in the forward price/earnings ratio to 20.0, up from 19.3 in December and well above the 5-year and 10-year averages.  We described the December P/E ratio as frothy, and it is now a bit frothier.

Fourth quarter earnings reported in January were not particularly impressive.  With 25% of S&P 500 companies reporting, 69% beat consensus earnings expectations which is below the 5-year average of 77% and the 10-year average of 74%.  Revenue beats were more encouraging at 68%, equal to the 5-year average and above the 10-year average of 64%.  The blended earnings growth rate was negative at -1.4%, below expectations of +1.6%.


Macro Overview

Macro Overview

Economic headlines in January were generally positive.  Job creation was strong and unemployment was unchanged at 3.7%.  Retail sales were positive and manufacturing improved.  Consumer confidence as measured by both the Conference Board and the University of Michigan was at its highest since 2021.  The CPI headline number was a bit higher than expectations but the core number (which excludes food and energy) was steady.  The Commerce Department estimated fourth quarter 2023 GDP growth at 3.3% annualized and full-year 2023 growth at 3.1%.  This compares with initial consensus projections of 0.2% growth for 2023.

Analysts were hoping that the Fed meeting in January would support hopes for a March rate cut.  They got half a loaf.  The Fed did not raise rates, and dropped previous language which suggested a bias toward rate hikes.  But Chairman Powell indicated that the Fed was not likely to cut rates in March.  While inflation seems to be heading in the right direction, the Fed wants more proof that the trend is sustainable.


Additional Disclosures

Additional Disclosures

Performance data for OPI reflect the reinvestment of dividends and other earnings on the fund’s assets.  Performance data for the major indices reflect only changes in the value of those indices, and would be higher if dividends were included. However, the index data do not reflect fees that would be paid to index fund managers and transaction costs that would be incurred when their component stocks are bought or sold, while OPI’s data do reflect quarterly fees and expenses incurred by the fund.  The information provided is believed to be reliable, but its accuracy or completeness is not warranted. This material is not intended as an offer or solicitation for the purchase or sale of any stock, bond, mutual fund, or any other financial instrument. The views and strategies discussed herein may not be appropriate and/or suitable for all investors. This material is meant solely for informational purposes, and is not intended to suffice as any type of accounting, legal, tax, or estate planning advice. Any and all forecasts mentioned are for illustrative purposes only and should not be interpreted as investment recommendations.