February 2024
Market Update
(all values as of 03.29.2024)

Stock Indices:

Dow Jones 39,807
S&P 500 5,254
Nasdaq 16,379

Bond Sector Yields:

2 Yr Treasury 4.59%
10 Yr Treasury 4.20%
10 Yr Municipal 2.52%
High Yield 7.44%

YTD Market Returns:

Dow Jones 5.62%
S&P 500 10.16%
Nasdaq 9.11%
MSCI-EAFE 5.06%
MSCI-Europe 4.60%
MSCI-Pacific 5.82%
MSCI-Emg Mkt 1.90%
 
US Agg Bond -0.78%
US Corp Bond -0.40%
US Gov’t Bond -0.72%

Commodity Prices:

Gold 2,254
Silver 25.10
Oil (WTI) 83.12

Currencies:

Dollar / Euro 1.08
Dollar / Pound 1.26
Yen / Dollar 151.35
Canadian /Dollar 0.73

Macro Overview

Financial markets started the year off with an eye on earnings, the upcoming election, and developments in the Middle East and Ukraine. Markets are eagerly awaiting for the Fed to finally commence its rate reduction trajectory. Analysts vary on when it will happen, but are expecting that decreases will start before the middle of the year.

Stock performance was mixed in January, as some sectors lagged while others excelled. Sectors including consumer discretionary, real estate, and utilities lagged in January, while financials, healthcare, and communication stocks rose. Analysts deem such a disparity among sectors as “sector rotation”, which is indicative of a possible change in the economic direction of the nation’s economy.

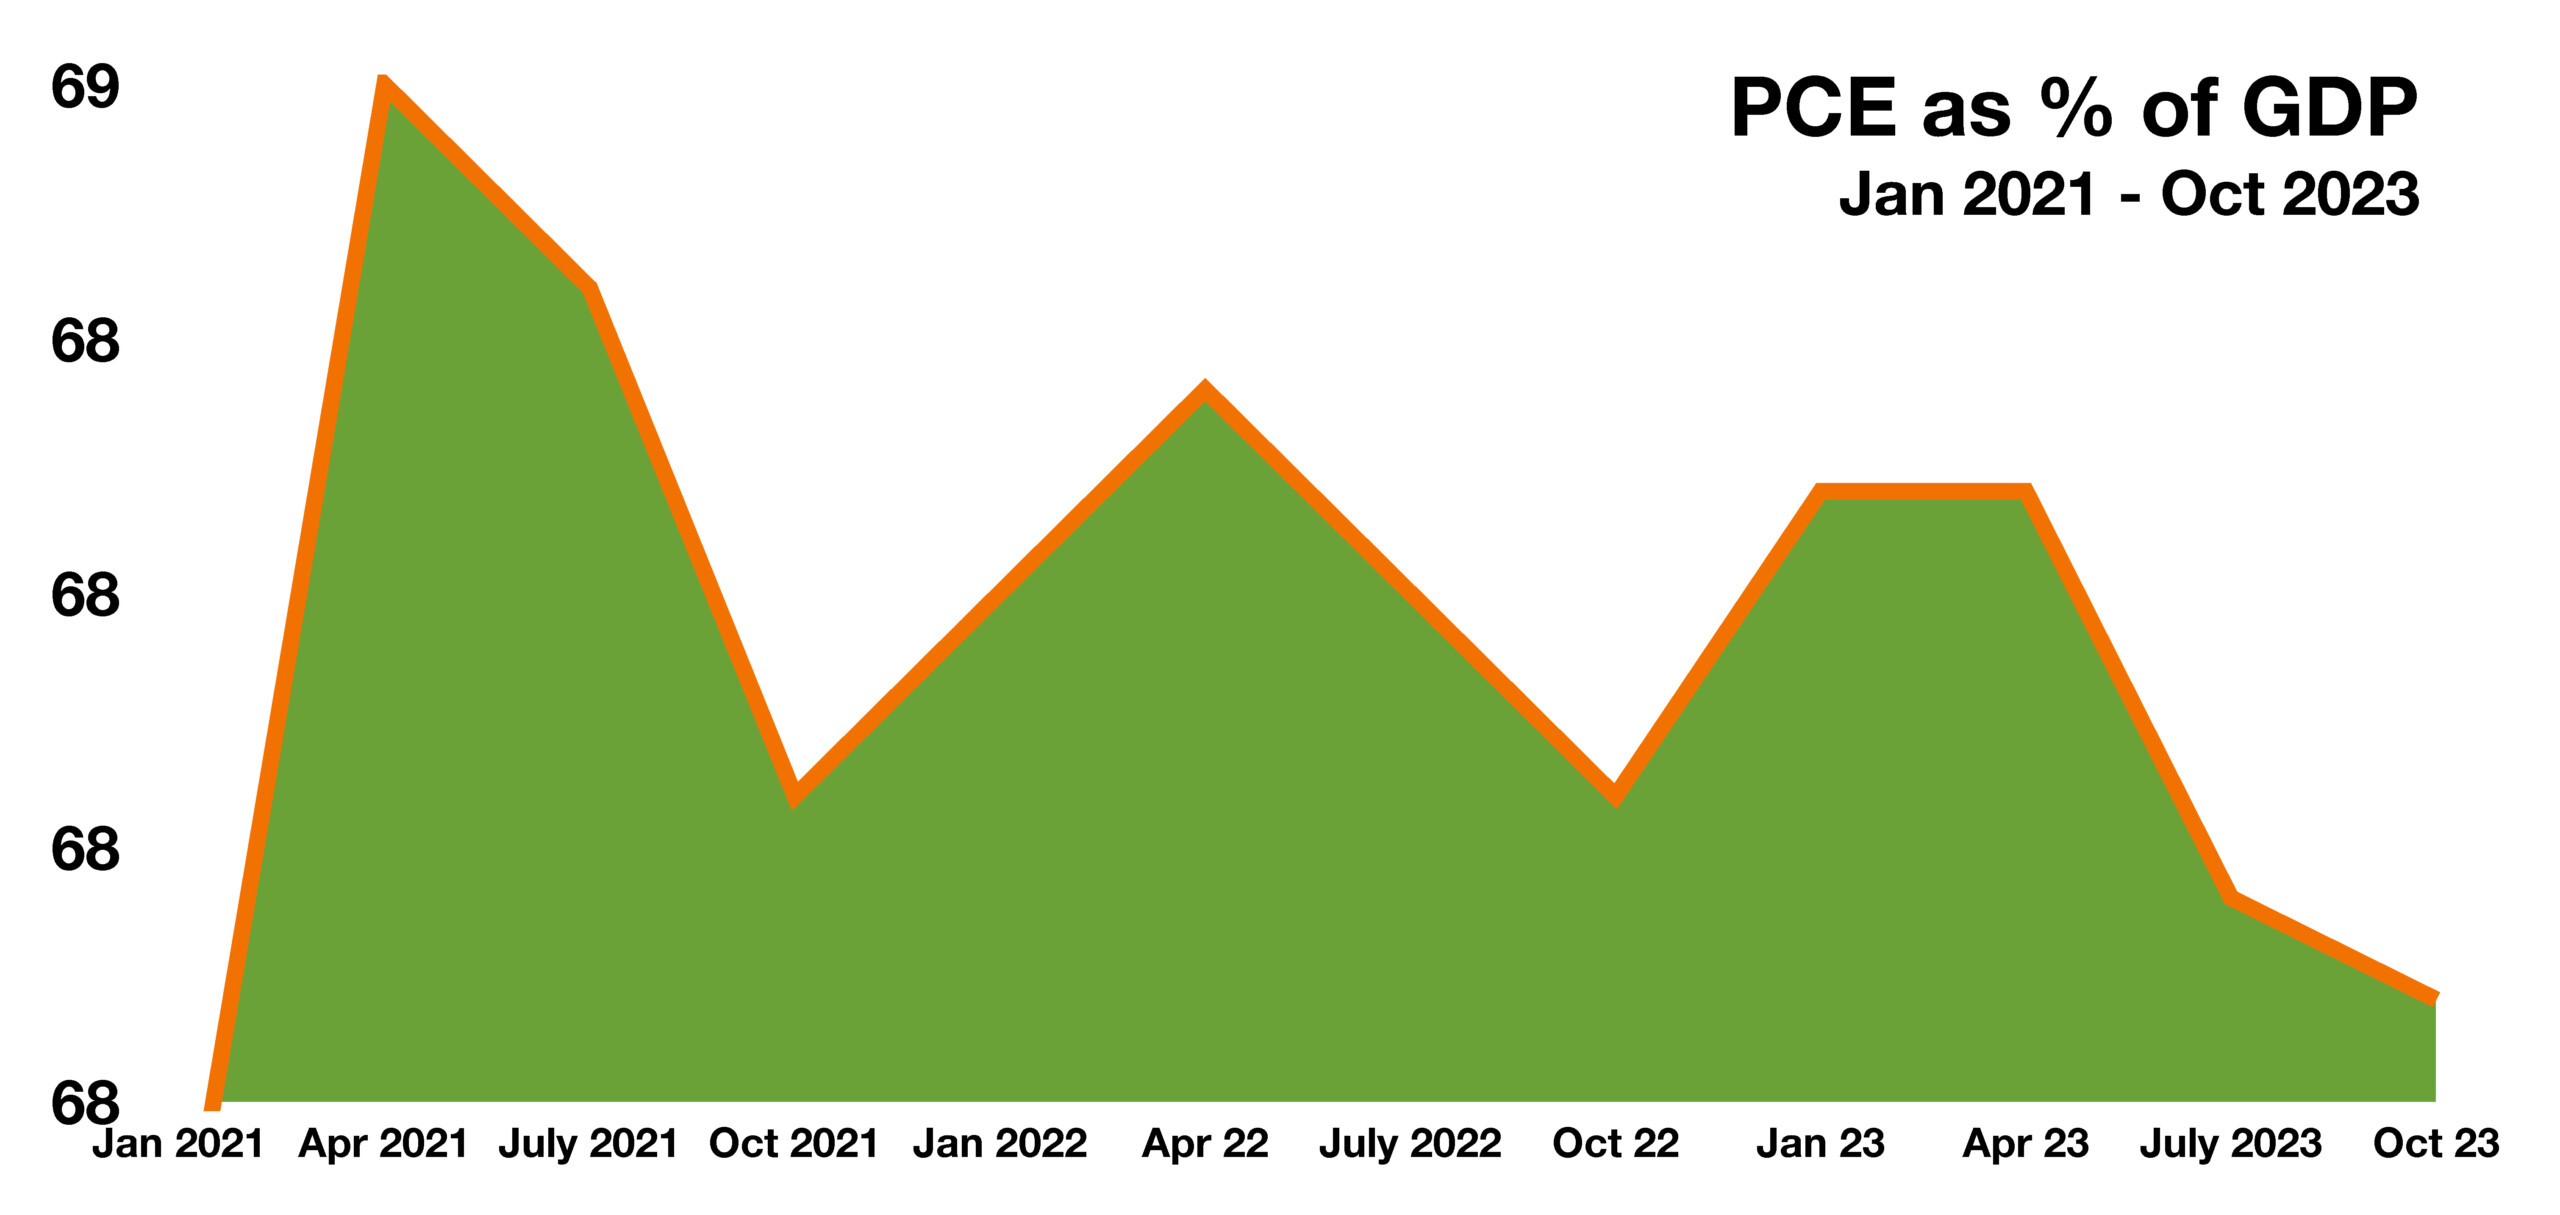
Gross Domestic Production (GDP) for the 4th quarter of 2023 came in at 3.3%, stronger than expected by economists. Concurrently, consumers are contributing less to economic growth as measured by Personal Consumption Expenditures (PCE), representing roughly 67.6% of GDP. Consumers contributed 69% to GDP nearly two years ago, when consumer expenditures were higher. Economists track this dynamic closely since two-thirds of GDP is driven by consumer expenditures.

The Federal Reserve continues to struggle with the threat of lingering inflation. Fed officials are mixed about when the Fed will begin to reduce rates and how much the initial reductions will be. For now, the Federal Reserve has held rates steady but may change course should economic data and the economy prove otherwise.

Federal government bank regulators, such as the FDIC, the Office of the Comptroller of the Currency and, the Federal Financial Institutions Examination Council have been increasingly focused on the liquidity of smaller banking institutions. Last year’s bank failures prompted an increase of surveillance on various banking institutions and their financial integrity.

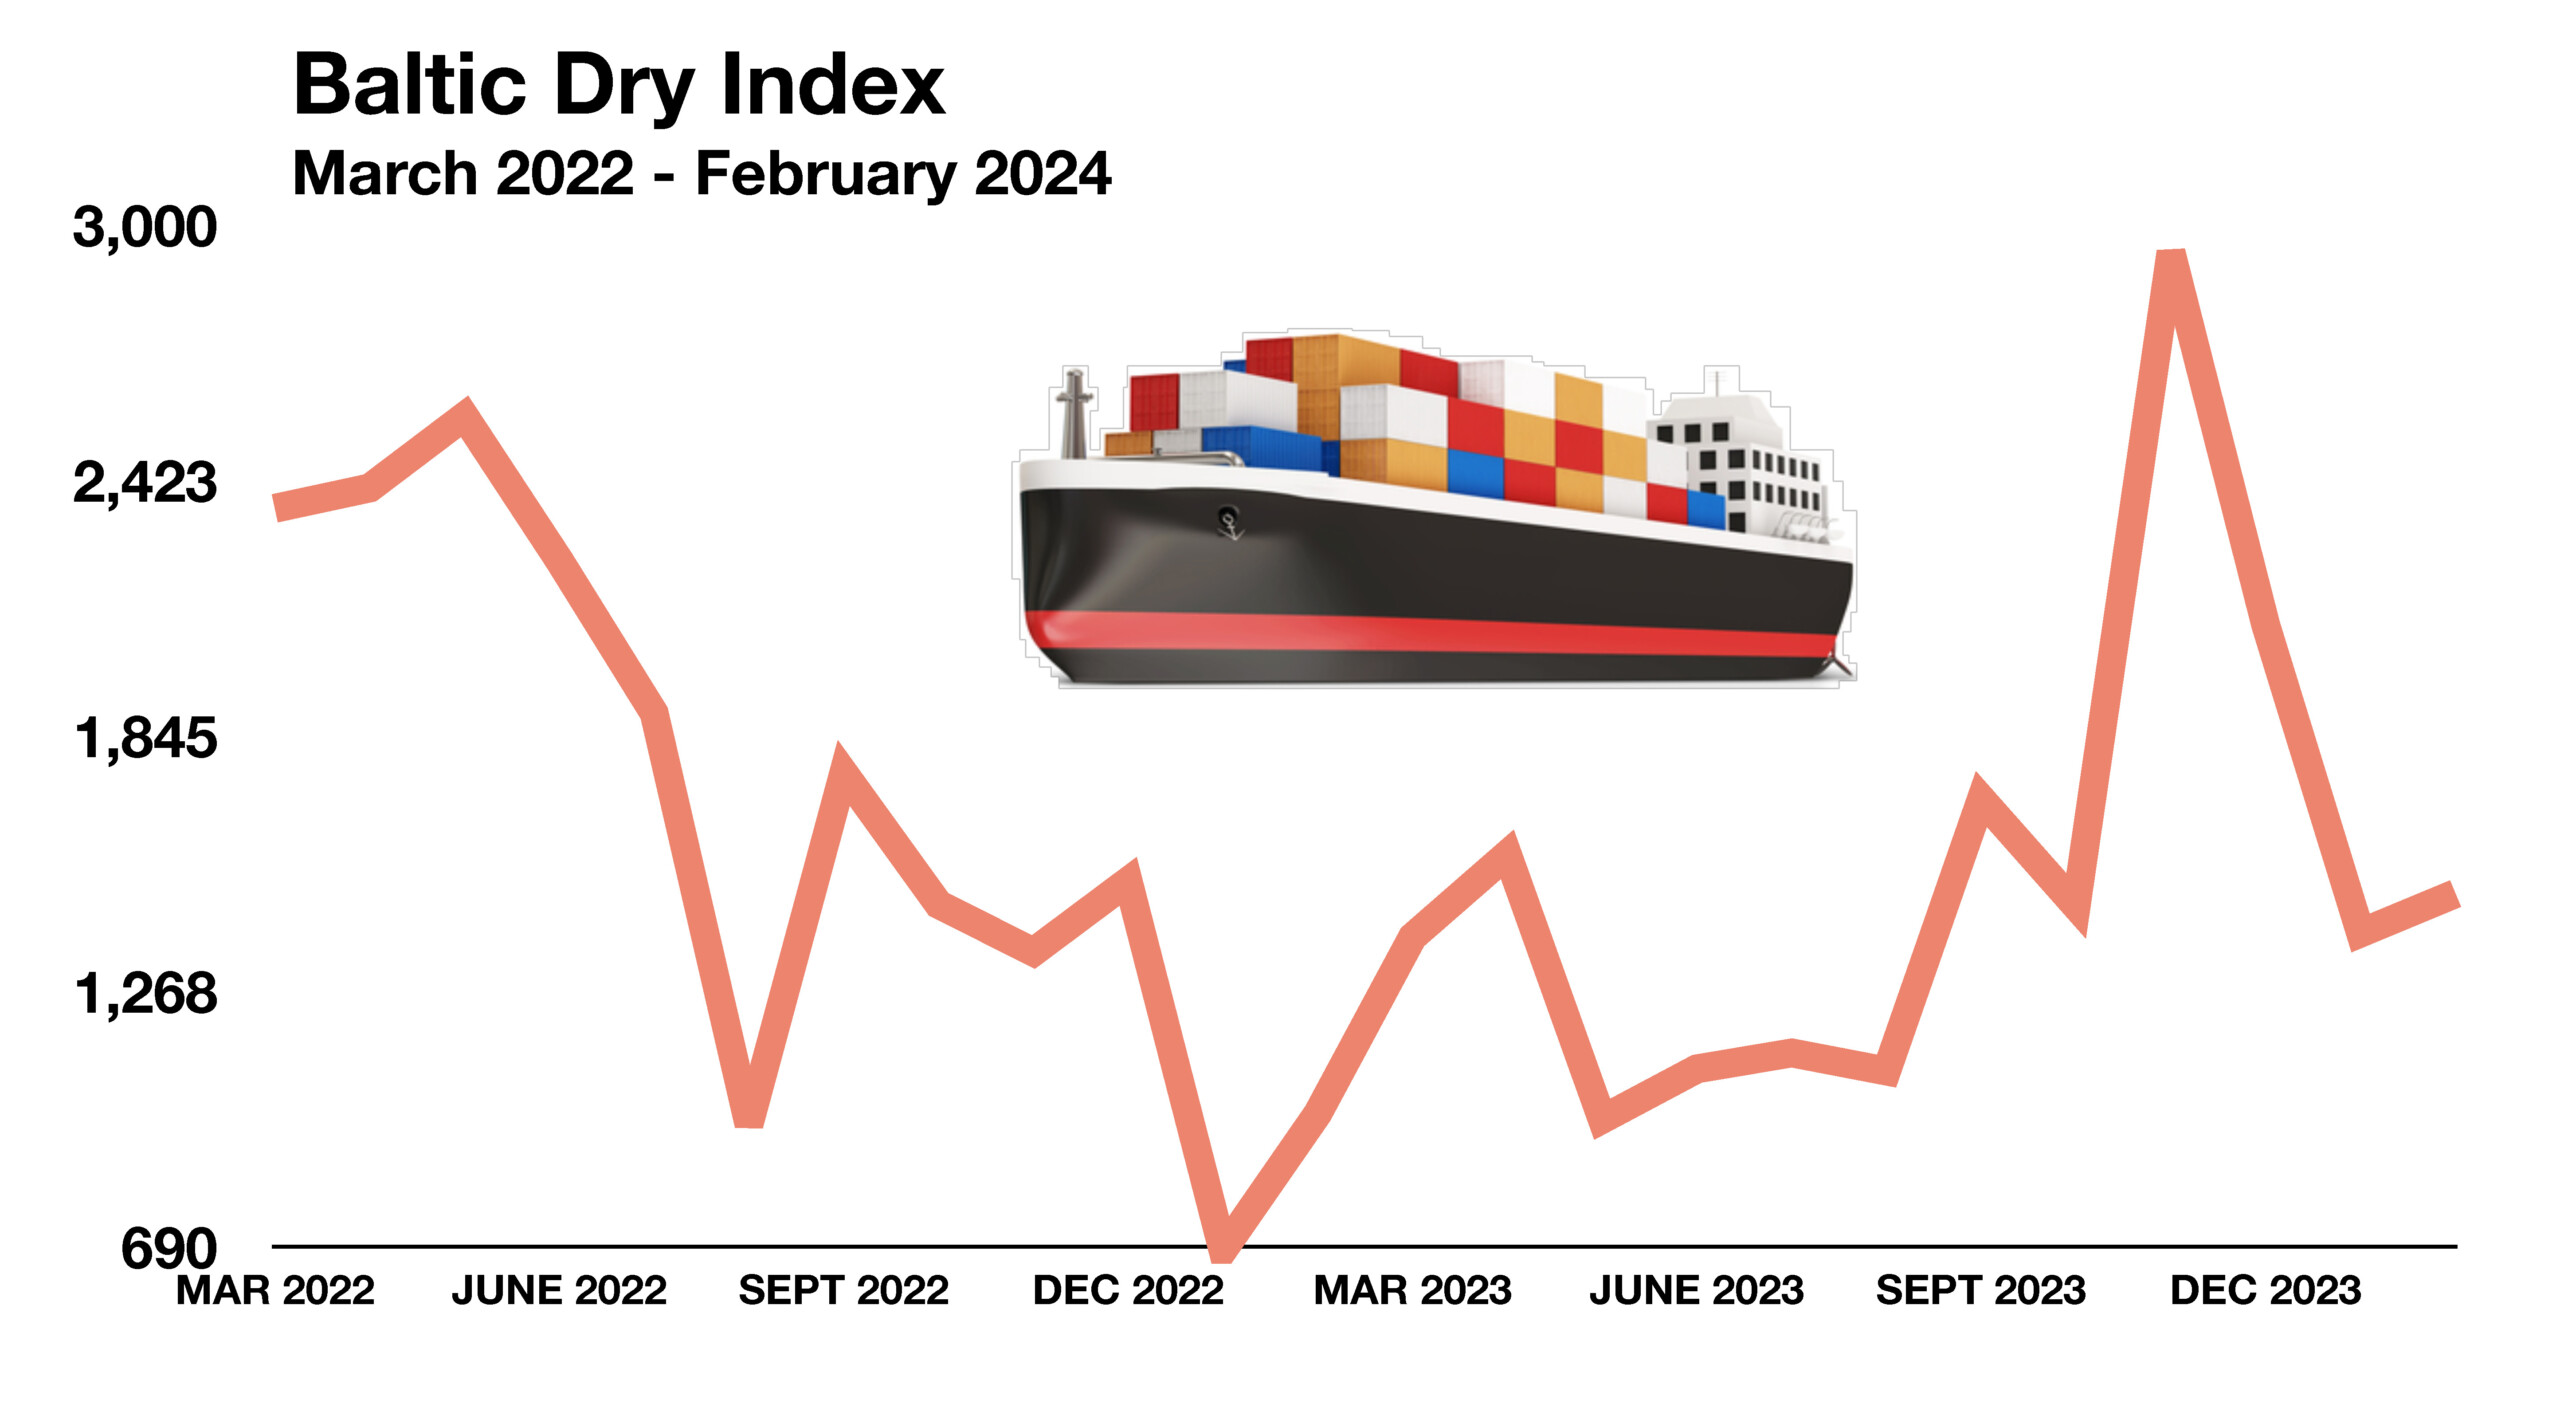
The Baltic Dry Index, which measures the cost of transporting commodities and essential goods globally, has fallen back to pre-pandemic levels. Shipping costs and transportation rates rose sharply during the pandemic, causing price increases from commodities to finished products worldwide. Many economists believe that the drop in shipping and commodity prices is indicative of lower inflation and a possible global slowdown of commerce activity.

Sources: Federal Reserve, Labor Dept., FDIC, OCC, FFIEC, Baltic Dry Index

 
consumers make up 70% of gdp

Stocks Start Year Off With Slight Gain – Domestic Equity Overview

Domestic equity indices were mixed in January, as selective sectors outperformed other sectors. The disparity in performance, known as “sector rotation”, can be driven by a shift in consumer sentiment and economic activity. Major equity indices started the year with gains, as optimism surrounding a pending Fed rate cut and gradual economic growth helped fuel a slight rise in stock prices. The Dow Jones Industrial Index, the S&P 500 Index and the Nasdaq index all gained above 1% for the year as of the end of January. (Sources: Dow Jones, S&P, Nasdaq)

Rates Hold Steady – Fixed Income Review

Interest rates held steady as the Federal Reserve opted to maintain current levels as inflation worries still were a concern for several Fed members. The yield on the 10 year Treasury Bond ended January at 3.99%, up slightly from the 2023 close of 3.88%. Short term bond yields remain higher than longer term bond yields, indicative of a continued inverted yield curve. Some analysts expect yields to level out when the Fed begins to unwind its tightening policy as it lowers short term rates. (Sources: Federal Reserve, U.S. Treasury)

Consumers Drive Economic Growth, Not Government – Consumer Expenditures

Each month the Department of Commerce releases its Gross Domestic Product (GDP) report. This report is the single most recognized indicator of how the economy is performing.

GDP is made up of private consumption, gross investment, government spending, and net exports. The single largest contributor of these components is consumer consumption, making nearly 70% of GDP.

Historical data provided by the Bureau of Labor Statistics shows that U.S. economic growth has steadily become more reliant on consumer expenditures. Consumer expenditures as a percentage of GDP have risen to their highest levels over the past three years since the end of World War II. The importance of how much we consume as consumers each and every day has become that much more significant.

Additional data from the Fed shows that consumers have also adjusted their spending behaviors, relying less on credit and more on government stimulus payments to spend, vastly different from the peak of easy credit seen in 2004-2006.

Sources: Commerce Department, BLS, Federal Reserve

 
Americans are paying on a record $1.6 trillion of auto loans currently

Benefits Of A Trust Versus A Will – Estate Planning

A properly drafted will or trust is essential for anyone that has assets to leave to heirs. Either a will or a trust allows you to designate anyone you wish as beneficiaries. Both a will and a “revocable living trust” allow you to identify who the heirs to your assets will be.

The main difference between the two is that assets held in a trust will avoid probate upon one’s passing, which is inhibitive to the heirs and costly. A trust structured as a revocable living trust can help shelter family assets from taxes by properly placing assets within the trust. For 2024, the first $13.61 million (per individual) $27.22 million (per married couple) is excluded from estate taxes with any assets over that amount taxed at the Federal Estate Tax Rate.

If you own property in another state, a living trust eliminates the need to probate that property in that state. A living trust can immediately transfer management of your property if you become incapacitated either physically or mentally. There is no need to go to court to appoint a guardian or conservator.

If you choose to create a living trust, you should also create what is called a pour-over will. It provides for the distribution of any property that is not included in the trust. It will also allow you to name a guardian for any minor children. (Source: IRS)

Car Prices Are Falling – Auto Industry Review

Years of consecutive increases in U.S. auto sales have put a glut of vehicles on U.S. highways. In addition, a significant number of those sales were with a lease, leading to a rising tide of cars flowing back into the market as lease terms expired.

As automakers have added manufacturing capacity, they have also been aggressive in offering larger incentives on new vehicles in order to maintain record sales momentum. That has put downward pressure on the entire market.

Consequently, the number of drivers that owe more on their cars than they are worth is surging. Americans are paying on a record $1.6 trillion of auto loans currently, according to the most recent Federal Reserve data. That represents roughly half of all licensed drivers in the U.S. Among those that carry loan balances, the Federal Reserve estimates that auto loans make up between 10 percent and 23 percent of their total financial obligations. Auto prices soared as the pandemic took hold in 2020 through 2022, as supply constraints for critical auto components hindered manufacturing and distribution of automobiles globally. Low interest rates on auto loans helped subsidize rising auto prices as consumer demand continued on. (Sources: Federal Reserve Bank of St. Louis)

 
72.5 million Americans, identified as households, pay no federal income tax

World’s Largest Energy Consumers – Global Energy Demand

As China and other developing countries continue to grow their middle class and build new cities and roads, the demand for energy such as electricity, continues to increase enormously.

China continues to build and expand its infrastructure to accommodate a population of over 1.4 billion people, while the United States has far less of a population to accommodate with 331.9 million. Optimistically, the U.S. has become more of an energy producer and less of an energy consumer, due in part to technology advances and slower economic expansion.

The abundance of newly extracted oil and natural gas from the United States has been primarily attributable to the advancement of technology. Radical new processes and methods of identifying oil and natural gas reserves have propelled the U.S. to a world leader for energy resources.

As global growth from emerging and developing countries continues, so does the demand for energy. Electricity is a primary energy source for the individual population and for a country’s manufacturing sector and infrastructure. Many market analysts believe that long-term global growth is what has been fueling the steady rise in energy prices, more so than geopolitical events. (Source: U.S. Energy Information Administration (EIA))

40% of Americans Pay No Federal Income Tax – Fiscal Policy

Disparity of income has been a preponderate subject for politicians and activist groups for sometime, yet in the end, those that earn the higher incomes pay for the majority of taxes.

An estimated 72.5 million Americans, identified as households, pay no federal income tax. The non-partisan, non-profit tax group known as The Tax Policy Center released income tax data it analyzed for 2022 and found that nearly half, about 40% of American households, paid no federal income tax in 2022. The Tax Policy Center study also found that 24 of the 72.5 million not paying taxes, are aged 65 or older, many of which are living primarily on Social Security benefit payments.

Generous tax credits and low tax brackets for low-income earners allow minimal to no federal tax payments. The Tax Policy Center did find that these lower income households did pay their share of state, local, property, sales, and excise taxes. The ultra wealthy, also know as the top 1% of taxpayers, with annual incomes of about $2 million, pay about 42.3% of all of the federal income taxes in the U.S. (Source: Tax Policy Center/Washington D.C.)