Ocean Park Capital Management

2503 Main Street

Santa Monica, CA 90405

Main: 310.392.7300

Daily Performance Line:  310.281.8577

January 2025
Market Update
(all values as of 03.31.2025)

Stock Indices:

Dow Jones 42,001
S&P 500 5,611
Nasdaq 17,299

Bond Sector Yields:

2 Yr Treasury 3.89%
10 Yr Treasury 4.23%
10 Yr Municipal 3.20%
High Yield 7.53%

YTD Market Returns:

Dow Jones -1.28%
S&P 500 -4.59%
Nasdaq -10.42%
MSCI-EAFE 7.00%
MSCI-Europe 10.10%
MSCI-Pacific 0.90%
MSCI-Emg Mkt 4.40%
 
US Agg Bond 2.78%
US Corp Bond 2.31%
US Gov’t Bond 2.70%

Commodity Prices:

Gold 3,169
Silver 34.79
Oil (WTI) 71.64

Currencies:

Dollar / Euro 1.08
Dollar / Pound 1.29
Yen / Dollar 149.77
Canadian /Dollar 0.69
 

Portfolio Overview

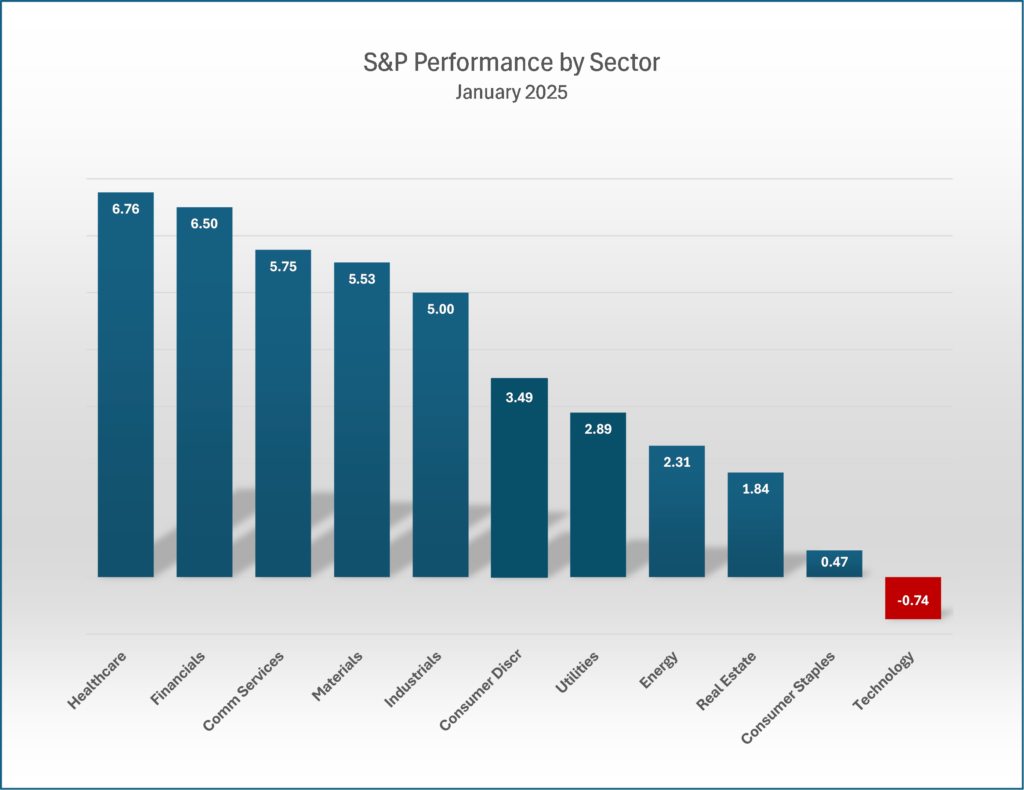
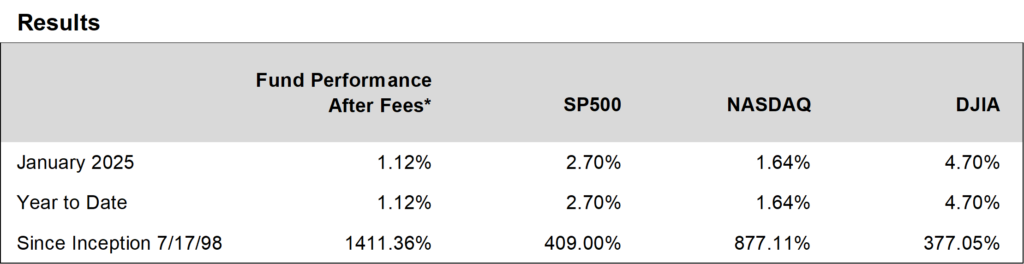
Ocean Park Investors Fund rose 1.12%* in January, while the S&P 500 rose 2.70% and the NASDAQ Composite rose 1.64%.  Portfolio stocks in the AI ecosystem declined in reaction to news of DeepSeek, the low-priced Chinese AI product (Nvidia down 10%), but this was offset by strength in consumer stocks (Brinker International up 37%) and financials (Robinhood Markets up 39%).

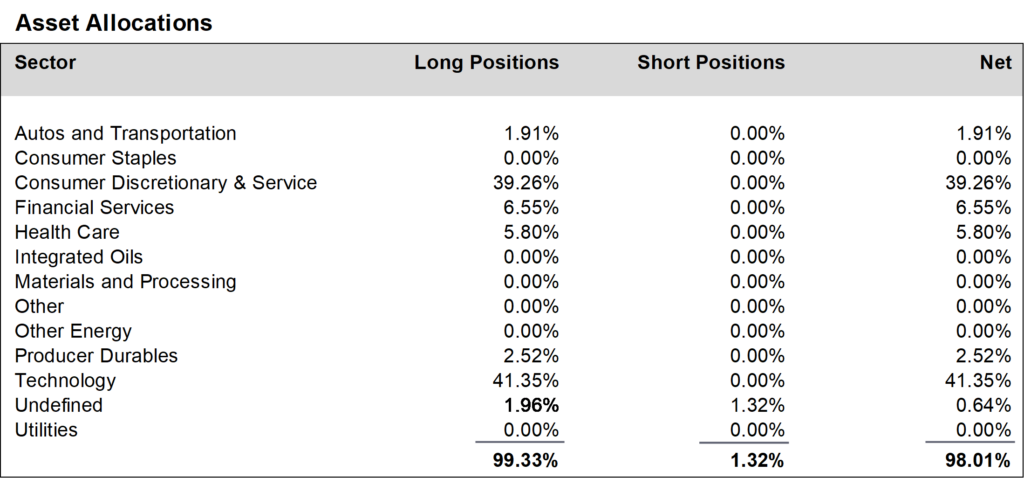
During January, we increased positions in the consumer and financial sectors and reduced positions the technology sector.  We also reduced our exposure to the IVV ETF.  We finished the month at about 98% net long, up from about 97% in December.


Daily updates on our activity are available on our Results Line, at 310-281-8577, and current information is also maintained on our website at www.oceanparkcapital.com. To gain access to the site enter password opcap.

*These results are pro forma. Actual results for most investors will vary. See additional disclosures on page 4. Past performance does not guarantee future results.

 
Equity Overview

Equity Overview

Ten of eleven sectors in the S&P 500 rose in January, with health care the best gainer and technology the only loser.  Value stocks outperformed growth.  Volatility was moderate, as the S&P 500 moved more than 1% on 5 of 20 trading days. The S&P 500 set a new closing high intra-month, rising above 6,100.  The forward price/earnings ratio declined from 22.6 to 20.0 but is still well above the 5-year and 10-year averages.

Fourth quarter earnings reported in January were strong.  With 36% of S&P 500 companies reporting, 77% beat consensus earnings expectations which is level with the 1-year and 5-year averages.  Revenue beats continued less impressive at 63%, slightly above the 1-year average of 62% but below the 5-year average of 69%.


Macro Overview

Macro Overview

Economic headlines in January were generally positive.  Job creation was strong and unemployment dipped to 4.1%.  The CPI increased 2.9% year over year, in line with expectations, but the core number (which excludes food and energy) was better than expected.  The Commerce Department estimated fourth quarter 2024 GDP growth at a healthy 2.3% annualized.

The Fed met in January but took no action on interest rates.  Analysts see the Fed in a holding pattern until at least June.  Chairman Powell declined to comment about potential changes in fiscal policy from the new administration, stating “We need to let those policies be articulated before we can even begin to make a plausible assessment of what their implications for the economy will be.”

He may not have to wait long.  New tariffs have already been announced, and the consensus among economists is that they will be inflationary and inhibit growth in the economy.


Additional Disclosures

Additional Disclosures

Performance data for OPI reflect the reinvestment of dividends and other earnings on the fund’s assets.  Performance data for the major indices reflect only changes in the value of those indices, and would be higher if dividends were included. However, the index data do not reflect fees that would be paid to index fund managers and transaction costs that would be incurred when their component stocks are bought or sold, while OPI’s data do reflect quarterly fees and expenses incurred by the fund.  The information provided is believed to be reliable, but its accuracy or completeness is not warranted. This material is not intended as an offer or solicitation for the purchase or sale of any stock, bond, mutual fund, or any other financial instrument. The views and strategies discussed herein may not be appropriate and/or suitable for all investors. This material is meant solely for informational purposes, and is not intended to suffice as any type of accounting, legal, tax, or estate planning advice. Any and all forecasts mentioned are for illustrative purposes only and should not be interpreted as investment recommendations.