W.P. "Bill" Atkinson, III

Certified Financial Planner TM / Attorney

Access Financial Resources, Inc.

3621 NW 63rd Street, Suite A1

Oklahoma City, OK  73116

(405) 848-9826

www.afradvice.com / bill@apaplans.com

January 2024
Market Update
(all values as of 02.29.2024)

Stock Indices:

Dow Jones 38,996
S&P 500 5,096
Nasdaq 16,091

Bond Sector Yields:

2 Yr Treasury 4.64%
10 Yr Treasury 4.25%
10 Yr Municipal 2.53%
High Yield 7.63%

YTD Market Returns:

Dow Jones 3.47%
S&P 500 6.84%
Nasdaq 7.20%
MSCI-EAFE 2.23%
MSCI-Europe 1.23%
MSCI-Pacific 3.98%
MSCI-Emg Mkt -0.27%
 
US Agg Bond -1.68%
US Corp Bond -1.67%
US Gov’t Bond -1.59%

Commodity Prices:

Gold 2,051
Silver 22.87
Oil (WTI) 78.25

Currencies:

Dollar / Euro 1.08
Dollar / Pound 1.26
Yen / Dollar 150.63
Canadian /Dollar 0.73
 

Macro Overview

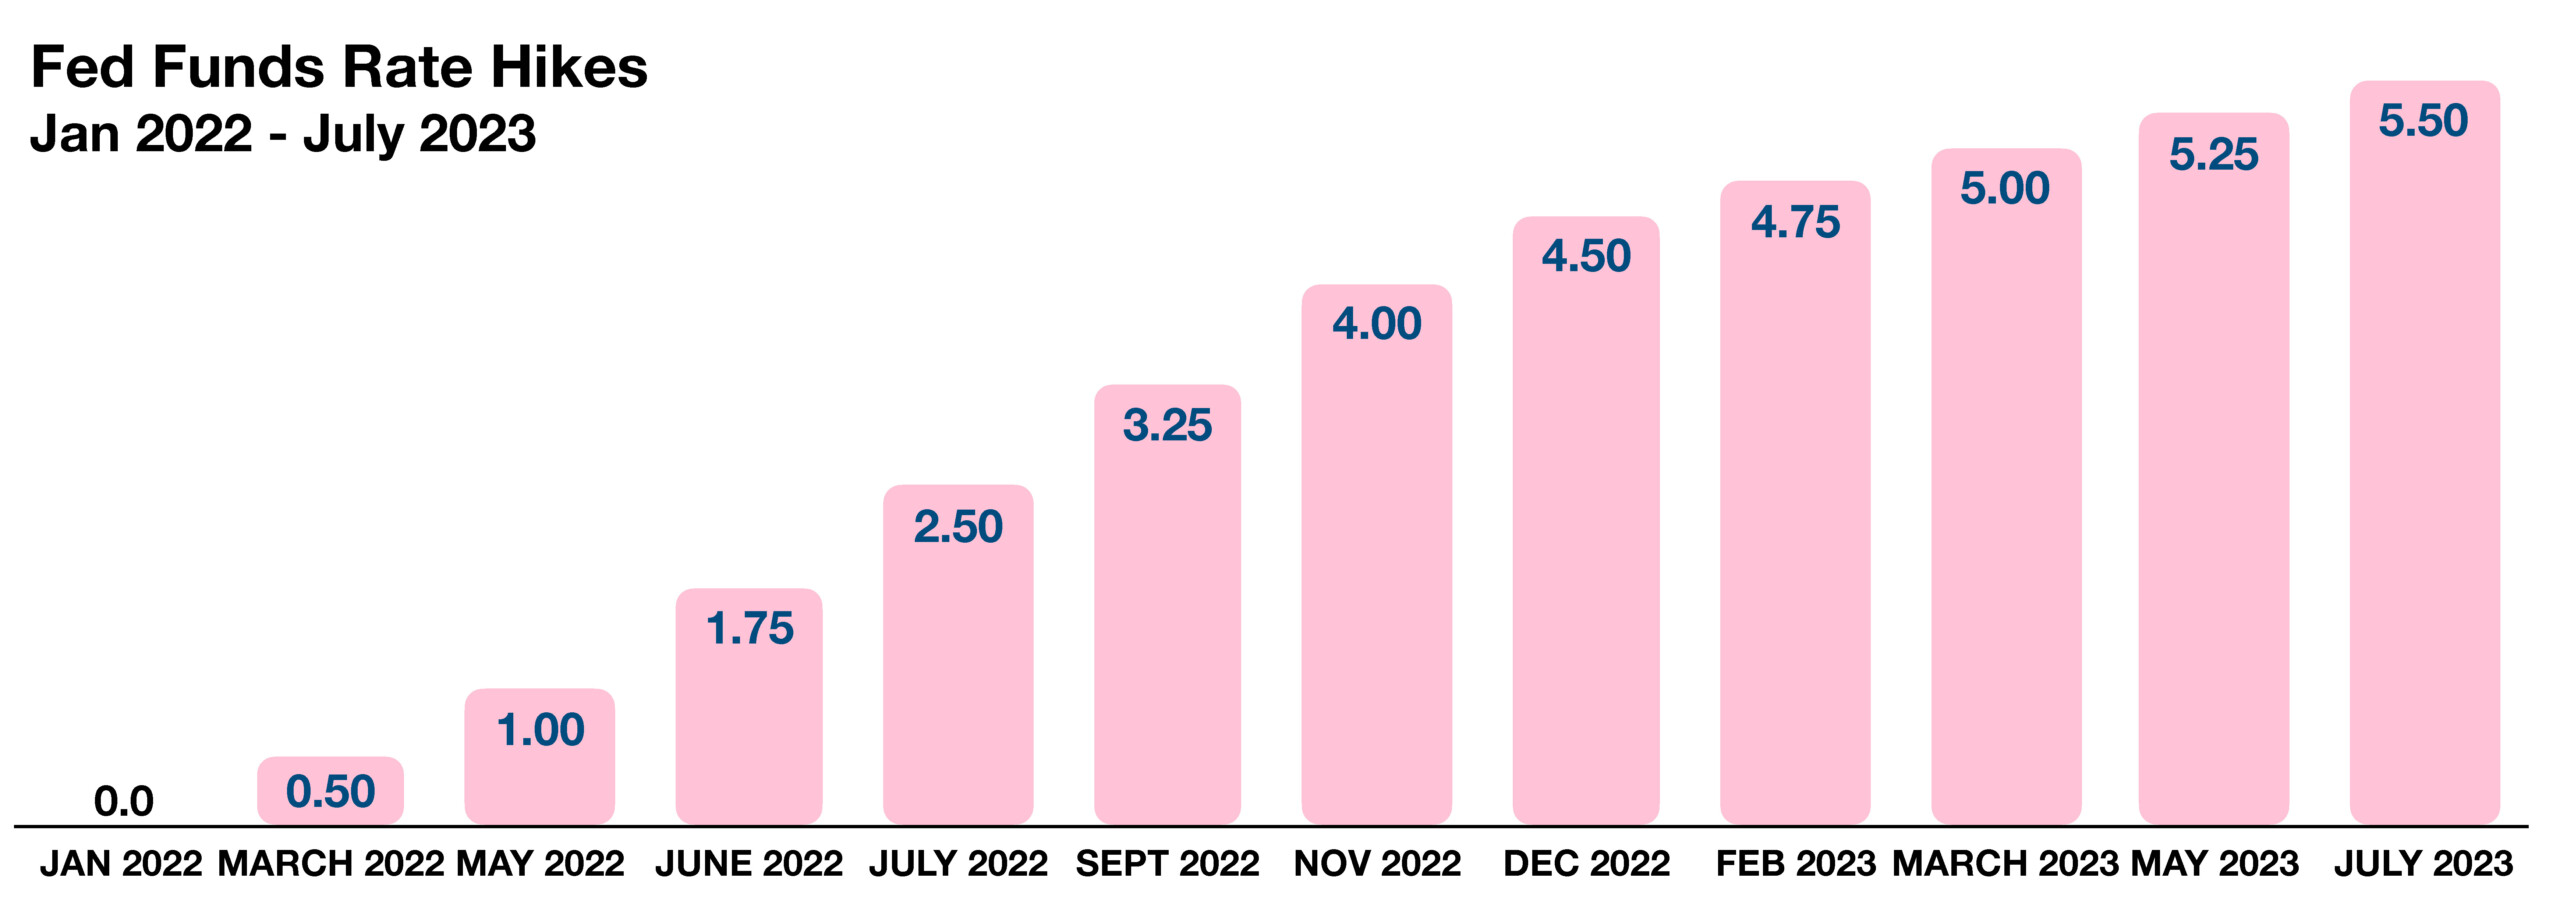
This past year witnessed one of the most ambitious executions of interest rate hikes by the Federal Reserve in recent history, with rates rising four times in 2023. Optimism swarmed throughout the markets as equities and bonds rose in a rare convergence. Stocks and bonds have historically tended to drift in opposite directions.

Inflation-themed concerns during 2023 have led to more deflationary concerns heading into 2024. The Fed’s attempts in combating inflationary pressures translated into hard-landing concerns as recession fears evolved due to rising rates. The labor market continues to challenge the Fed’s possible easing rate policy in 2024, as wage pressures continue to abound.

Geopolitical tensions carried over from 2023, as the invasion of Ukraine and the Middle East conflict continue to weigh on financial markets. The two hostilities continue to hinder supply constraints in various regions as well as provoking uncertainty. Russia’s invasion of Ukraine directly affects Europe while the Middle East conflict is disturbing oil shipping throughout the region.

Bank failures occurring at the beginning of 2023 made it one of the worst years for bank collapses in history. Three of the top five bank failures ever occurred in 2023, as the demise of Silicon Valley Bank, Signature Bank, and First Republic Bank totaled over $350 billion in assets.

Many analysts believe that the performance of the S&P 500 Index in 2023 was not truly representative of actual market characteristics, due to a concentration in just seven stocks known as the magnificent seven. Roughly half of the performance for the S&P 500 Index in 2023 was attributable to these seven stocks, with the remaining 493 stocks in the index representing the balance of the return for 2023.

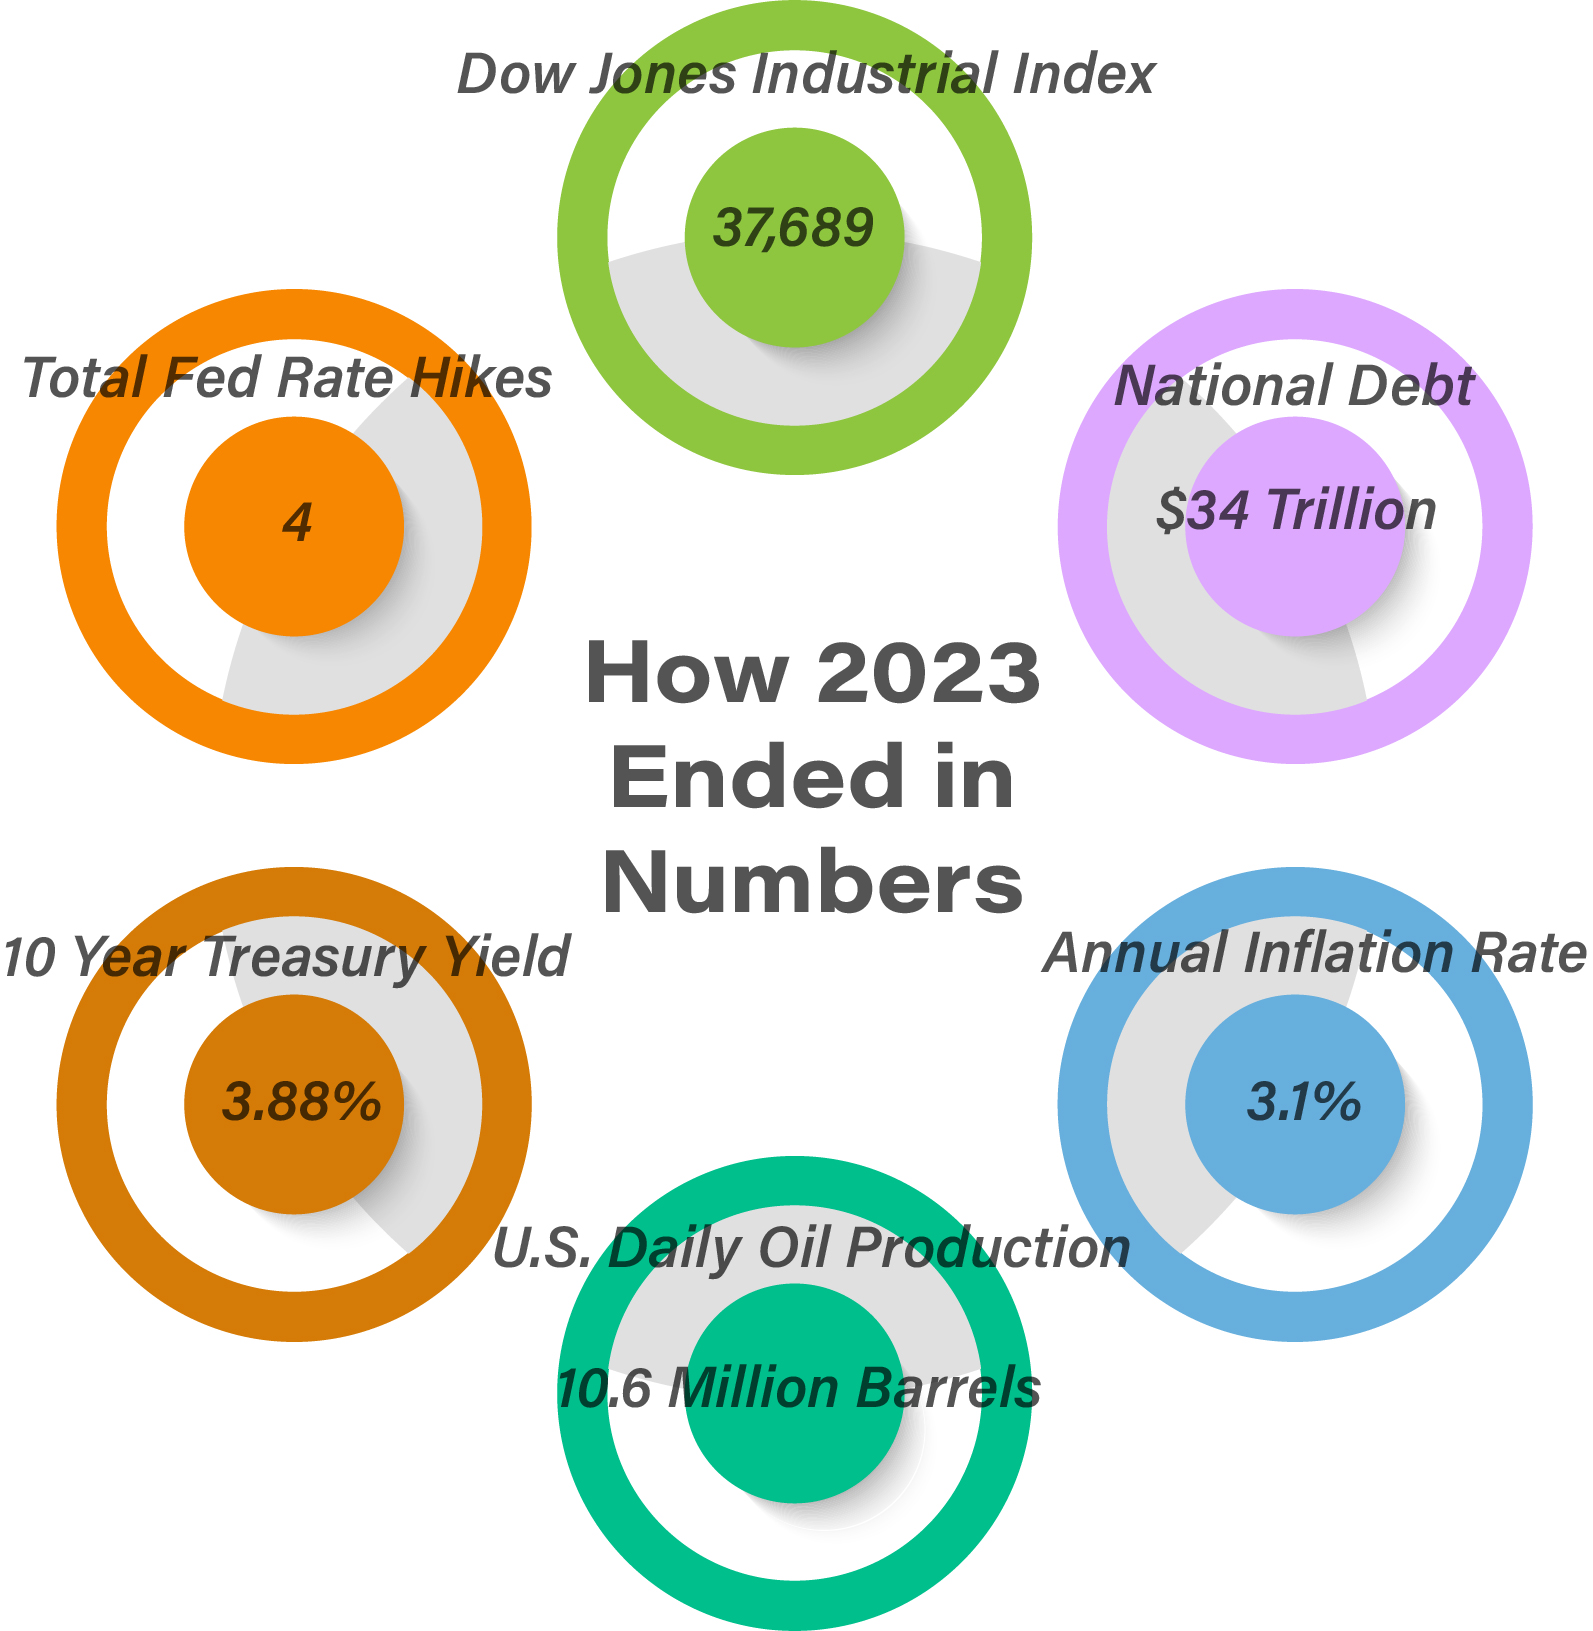
The U.S. exported approximately 75% of total domestic oil production in 2023, supplying both developed and emerging countries worldwide. Supply constraints for oil may pose a challenge as a result of worsening shipping disruptions in the Middle East, affecting prices globally.

Total Federal Debt for the U.S. reached $34 trillion at the end of 2023, up from $27.6 trillion at the beginning of 2021. Rising rates this past year have added additional debt costs for the U.S. government as interest expenses on outstanding U.S. debt has risen substantially. (Sources: Fed, BEA, Treasury Dept., EIA)

 
7 stocks accounted for roughly half of the return for the S&P 500 Index in 2023

The Fed Hikes Rates Four Times In 2023 – Bond Market Overview

The Federal Reserve raised rates eleven times between 2023 and 2022, increasing the Fed Funds rate from 0% at the beginning of 2022 to 5.5% at the end of 2023. Expectations are that the Fed will begin easing rates in 2024, reversing its tightening monetary policy. Lower consumer and mortgage rates are expected to materialize as the Fed eases.

Fed influenced rate reductions among other central banks globally is creating a lower rate scenario in 2024. The European Central Bank (ECB) as well as the central banks of Canada and England signaled a continued easing of rate policy in 2024.

A unique dynamic started to occur in the 4th quarter of 2023, with Treasury yields and commodity prices falling in tandem.  In any event, the yield on the 10-year Treasury bond ended 2023 at 3.88%, down from 4.95% earlier in October.

Sources: Federal Reserve Bank of St. Louis; https://fred.stlouisfed.org/series/FEDFUNDS

Stocks Finish 2023 On A Positive Note – Global Equity Review

Major global equity indices experienced a reversal in performance towards the end of 2023 relative to earlier in the year. Domestic indices including the Dow Jones Industrial Index and the S&P 500 Index, finished the year positively, along with international indices including the Japanese Nikkei 225 and the German DAX.

As mentioned earlier, seven stocks accounted for roughly half of the return for the S&P 500 Index in 2023. Such a disparity can distort the actual representation of the index, with only seven stocks representing such a large portion of returns relative to the other 493 stocks within the index. Information technology stocks contributed the most to the performance of the S&P 500 Index, accounting for approximately half of the indices’ return in 2023. Seventy-one percent of the S&P 500 Index rose less than the index itself in 2023, a disconnect from the top seven. It was the first time since 2012 that the S&P 500 Index failed to close at a record high at least once during the year. The index closed at its current record high in January 2022.

Sources: S&P, Bloomberg, Reuters, https://fred.stlouisfed.org/series/SP500


Green Energy Waste Problem

The Green Energy Waste Problem

In the realm of renewable energy, a pressing issue emerges—mounting waste from solar panels and wind turbine blades. Solar panels in the U.S. face premature disposal, with an estimated 9.8 million metric tons of dead panels anticipated between 2030 and 2060. Recycling costs for solar panels surge to $20-$30, starkly contrasting the $2 landfill disposal fee if one tosses them in the dump. Wind turbine blades, colossal and challenging to manage, contribute to a growing waste stream.  “Currently, about 7,000 blades are scrapped per year in the United States.” A comprehensive “composite circular economy” remains elusive despite industry discussions on end-of-life solutions. Legislative gaps allow landfill disposal of wind blades, raising doubts about the sustainability commitment of some wind energy backers.
The expansion of the renewable energy industry, buoyed by substantial subsidies, coincides with a surge in solar and wind energy capacities. However, fossil fuels still dominate U.S. electric generation. Environmental concerns heighten as organizations warn about the potential waste heights of solar power. E-waste, including discarded solar panels and EV batteries, is growing exponentially. A mere 17% of the 53.6 million tons of global e-waste is recycled. Companies like ERI focus on secure data destruction in the face of growing e-waste challenges.
Beyond physical waste, the narrative extends to infrastructure challenges, particularly electrical transformers. Demand surpasses supply, impacting renewable energy projects. The EV industry intensifies the struggle for transformers, hindering efforts to address shortages. Amid these challenges, the rise of new battery technology, particularly lithium-ion batteries, introduces hazardous complexities. Recycling becomes crucial, balancing the dangers of carcinogenic elements like nickel with the value of recovered minerals.
In conclusion, the waste challenges from renewable energy sources go beyond mere disposal. Addressing legislative gaps, ensuring industry transparency, and managing evolving waste landscapes are vital. The narrative underscores the ongoing journey towards sustainable energy, with complexities demanding a holistic approach. (Sources: TexasMonthly.com – http://tinyurl.com/cmycn6tu, EpochTimes.com – http://tinyurl.com/5xxrdwtj)
 
The u.s. produces over 13 million barrels of oil daily

U.S. Oil Production Reaches Another Record – Commodity Sector Overview

Despite efforts to curtail oil consumption and production of domestic oil, the U.S. achieved another record producing year in 2023. With over 13 million barrels of oil produced per day, the U.S. continues to be the worlds largest producer, eclipsing Russia and Saudi Arabia as a distant second and third. The United States has ranked as the world’s top oil producer since 2018.

The U.S. shale industry, known for its fracking technology to extract oil from shale rock formations, has continued to surprise the world oil markets with its resistance to varying prices. U.S. drillers have thus far been able to beat Saudi Arabia’s “pump and dump” strategy over the past few years to lower oil prices in order to maintain market share.

Global demand for oil has been steadily increasing for the past two decades, with a slight pullback during the pandemic in 2020. The broadening demand has been from both developed and emerging economies, as the reliance on crude oil and gasoline remains intact worldwide. The United States has become one of the top five exporting oil countries, with over 10 million barrels exported each month, representing two thirds of total U.S. production (Source: U.S. Energy Information Administration; U.S. Field Production of Crude Oil)

Global Tax Rates On The Rise – Global Tax Policy

Governments worldwide rely on tax revenue in order to fund government expenses and operations. Tax policies and initiatives vary from country to country depending on the economic prosperity and health of the country’s economy. Developed countries tend have more comprehensive and structured tax policies in place, relative to emerging market countries.

The recent rise in interest rates worldwide has led to a higher cost of governments issuing debt, thus prompting governments to instead resort to raising taxes. France, Japan and South Korea are among countries with increasing tax revenue in lieu of issuing additional government debt. Certain developed economies are also seeing an increase in labor force participating rates, including France, Germany, Italy, and Japan. Increasing participating rates tend to increase tax revenues as more workers add to the tax revenue base. (Sources: OECD; Tax On Personal Income Publication)

 
Emergency Supply of Meds

Emergency Supply of Meds?

In the past I have written about keeping an emergency supply of food, water, and energy.  But keeping an emergency supply of antibiotics is also vital, especially since the U.S. has limited antibiotic production capabilities. China controls about 90% of the global supply of antibiotic productions, posing a risk of limited access in emergencies.

Enter in Jase Medical, an online service founded by Shawn Rowland, M.D., that offers a telemedicine service for U.S. and Canadian adults to get antibiotics (and other daily medicines) for travel or emergencies. The process is straightforward, taking about 5-8 minutes. You’ll need your current medication list, dosages, purposes, and a photo ID for the consultation.

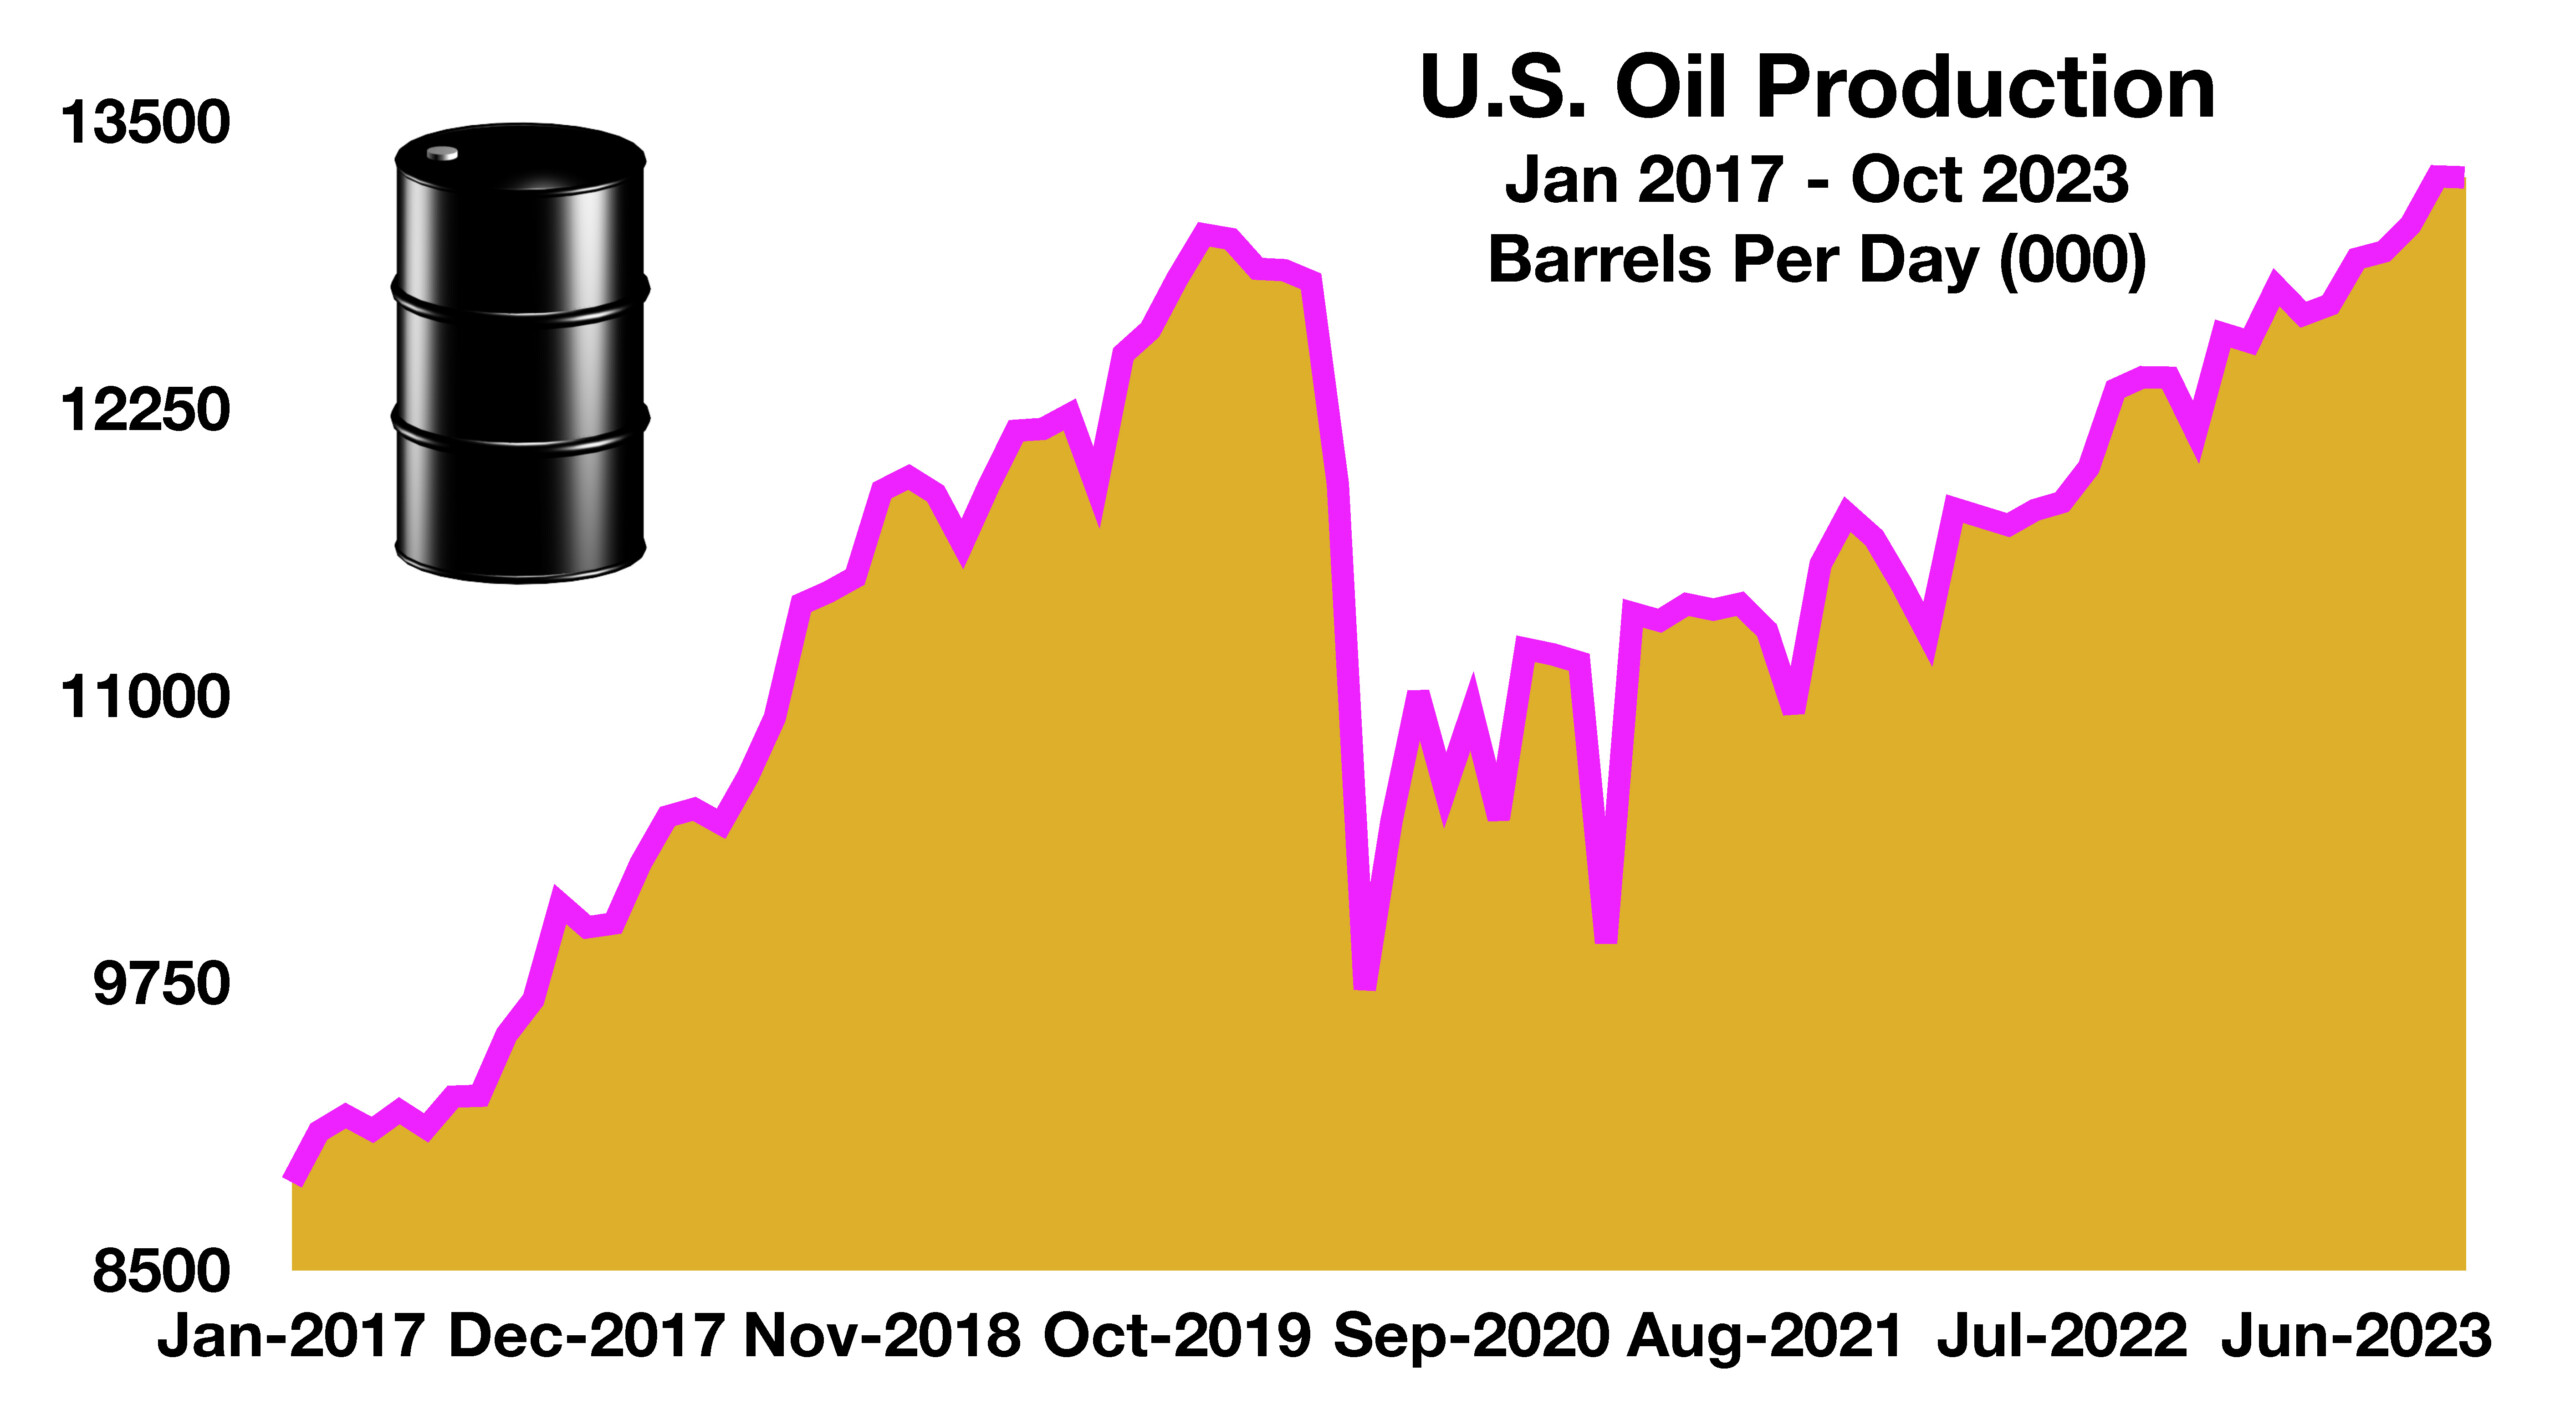
Jase Medical offers many customizable options, but one is the Jase Case where customers receive 5 types of antibiotics, a case, and a guide booklet. According to their website, the 5 antibiotics are as follows:

Of course, there are many other combinations of medicines that you can purchase. In fact, you can also purchase up to a 12-month emergency supply of your current daily prescription medication provided you have an active prescription and meet a few other conditions. For more information go to https://jasemedical.com/ or call (888) 522-6912 for more information or contact your primary care doctor to see if they can fill this roll as an alternative.
 
Newsletter - Disclosures

*Market Returns: All data is indicative of total return which includes capital gain/loss and reinvested dividends for noted period. Index data sources; MSCI, DJ-UBSCI, WTI, IDC, S&P. The information provided is believed to be reliable, but its accuracy or completeness is not warranted. This material is not intended as an offer or solicitation for the purchase or sale of any stock, bond, mutual fund, or any other financial instrument. The views and strategies discussed herein may not be appropriate and/or suitable for all investors. This material is meant solely for informational purposes, and is not intended to suffice as any type of accounting, legal, tax, or estate planning advice. Any and all forecasts mentioned are for illustrative purposes only and should not be interpreted as investment recommendations. This market update is a publication of Access Financial Resources. It should not be regarded as a complete analysis of the subjects discussed. All expressions of opinion reflect the judgment of the author on the date of publication and are subject to change. Newsletter content was prepared by a third-party provider, which is modified in some of its parts by the adviser. Charts and graphs do not represent the performance of Access Financial Resources or any of its advisory clients. Historical performance results for investment indexes and/or categories, generally do not reflect the deduction of transaction and/or custodial charges or the deduction of an investment management fee, the occurrence of which would have the effect of decreasing historical performance results. There can be no assurances that an investor’s portfolio will match or outperform any particular benchmark. Access Financial Resources is registered as an investment adviser and only transacts business in states where it is properly registered, or is excluded or exempted from registration requirements. Registration as an investment adviser does not constitute an endorsement of the firm by securities regulators nor does it indicate that the adviser has attained a particular level of skill or ability. Past performance may not be indicative of future results. Indexes are not available for direct investment. All investing involves risk, including the potential for loss of principal. There is no guarantee that any investment plan or strategy will be successful.