Earl R. King Sr., CFP®

Managing Member

1300 Caraway Court, Suite 200

Largo, MD 20774

Tel: 301-364-1617/Cell: 240-472-6570

 eking@erogerfinancial.com / www.erogerfinancial.com


January 2024
Market Update
(all values as of 02.29.2024)

Stock Indices:

Dow Jones 38,996
S&P 500 5,096
Nasdaq 16,091

Bond Sector Yields:

2 Yr Treasury 4.64%
10 Yr Treasury 4.25%
10 Yr Municipal 2.53%
High Yield 7.63%

YTD Market Returns:

Dow Jones 3.47%
S&P 500 6.84%
Nasdaq 7.20%
MSCI-EAFE 2.23%
MSCI-Europe 1.23%
MSCI-Pacific 3.98%
MSCI-Emg Mkt -0.27%
 
US Agg Bond -1.68%
US Corp Bond -1.67%
US Gov’t Bond -1.59%

Commodity Prices:

Gold 2,051
Silver 22.87
Oil (WTI) 78.25

Currencies:

Dollar / Euro 1.08
Dollar / Pound 1.26
Yen / Dollar 150.63
Canadian /Dollar 0.73
 

Macro Overview

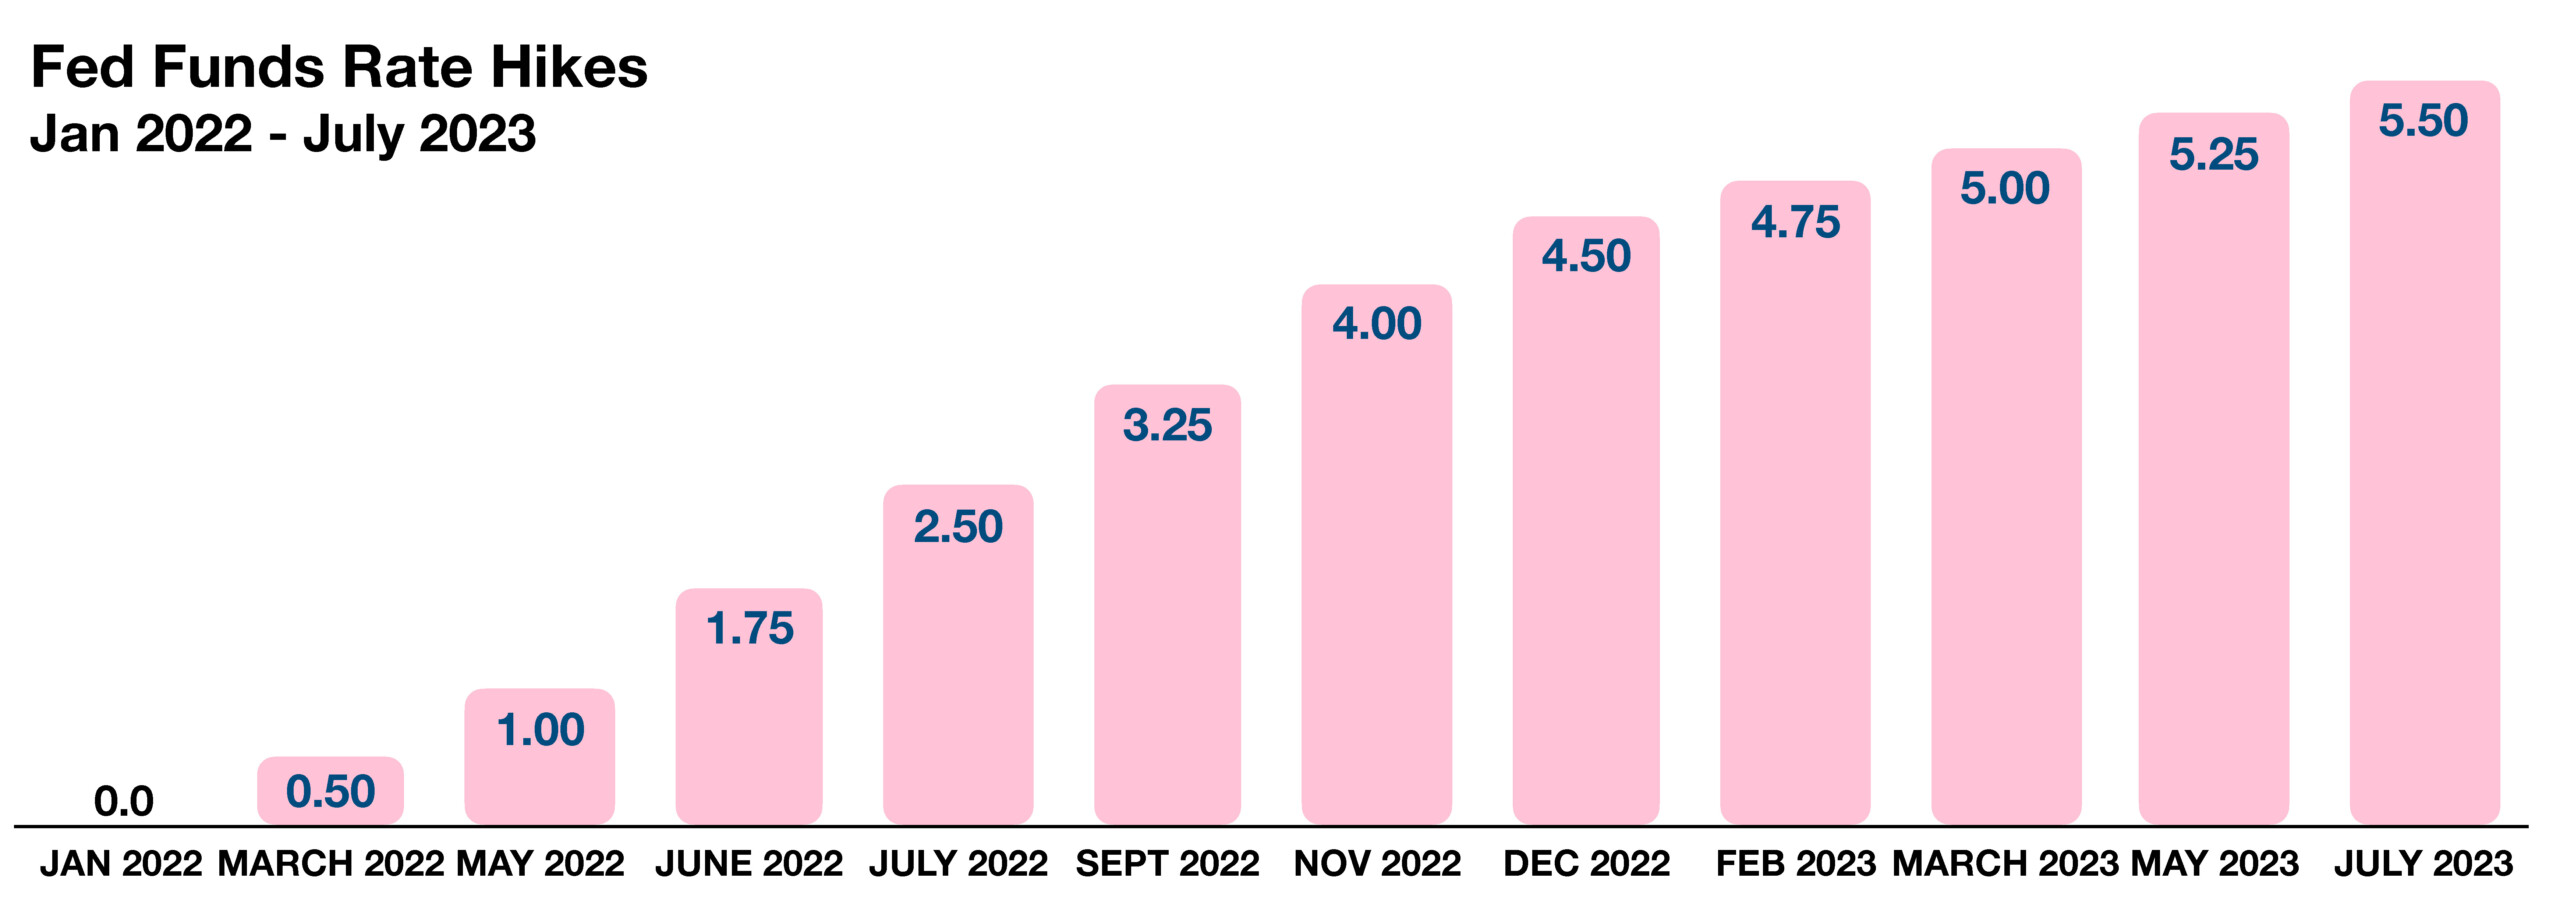
This past year witnessed one of the most ambitious executions of interest rate hikes by the Federal Reserve in recent history, with rates rising four times in 2023. Optimism swarmed throughout the markets as equities and bonds rose in a rare convergence. Stocks and bonds have historically tended to drift in opposite directions.

Inflation-themed concerns during 2023 have led to more deflationary concerns heading into 2024. The Fed’s vigilance in combating inflationary pressures translated into hard-landing concerns as recession fears evolved due to rising rates. A vigorous labor market continues to challenge the Fed’s possible easing rate policy in 2024, as wage pressures continue to abound.

Geopolitical tensions carried over from 2023, as the invasion of Ukraine and the Middle East conflict continue to weigh on financial markets. The two hostilities continue to hinder supply constraints in various regions as well as provoking uncertainty. Russia’s invasion of Ukraine directly affects Europe while the Middle East conflict is disturbing oil shipping throughout the region.

Bank failures occurring at the beginning of 2023 made it one of the worst years for bank collapses in history. Three of the top five bank failures ever occurred in 2023, as the demise of Silicon Valley Bank, Signature Bank, and First Republic Bank totaled over $350 billion in assets.

Many analysts believe that the performance of the S&P 500 Index in 2023 was not truly representative of actual market characteristics, due to a concentration in just seven stocks known as the magnificent seven. Roughly half of the performance for the S&P 500 Index in 2023 was attributable to these seven stocks, with the remaining 493 stocks in the index representing the balance of the return for 2023.

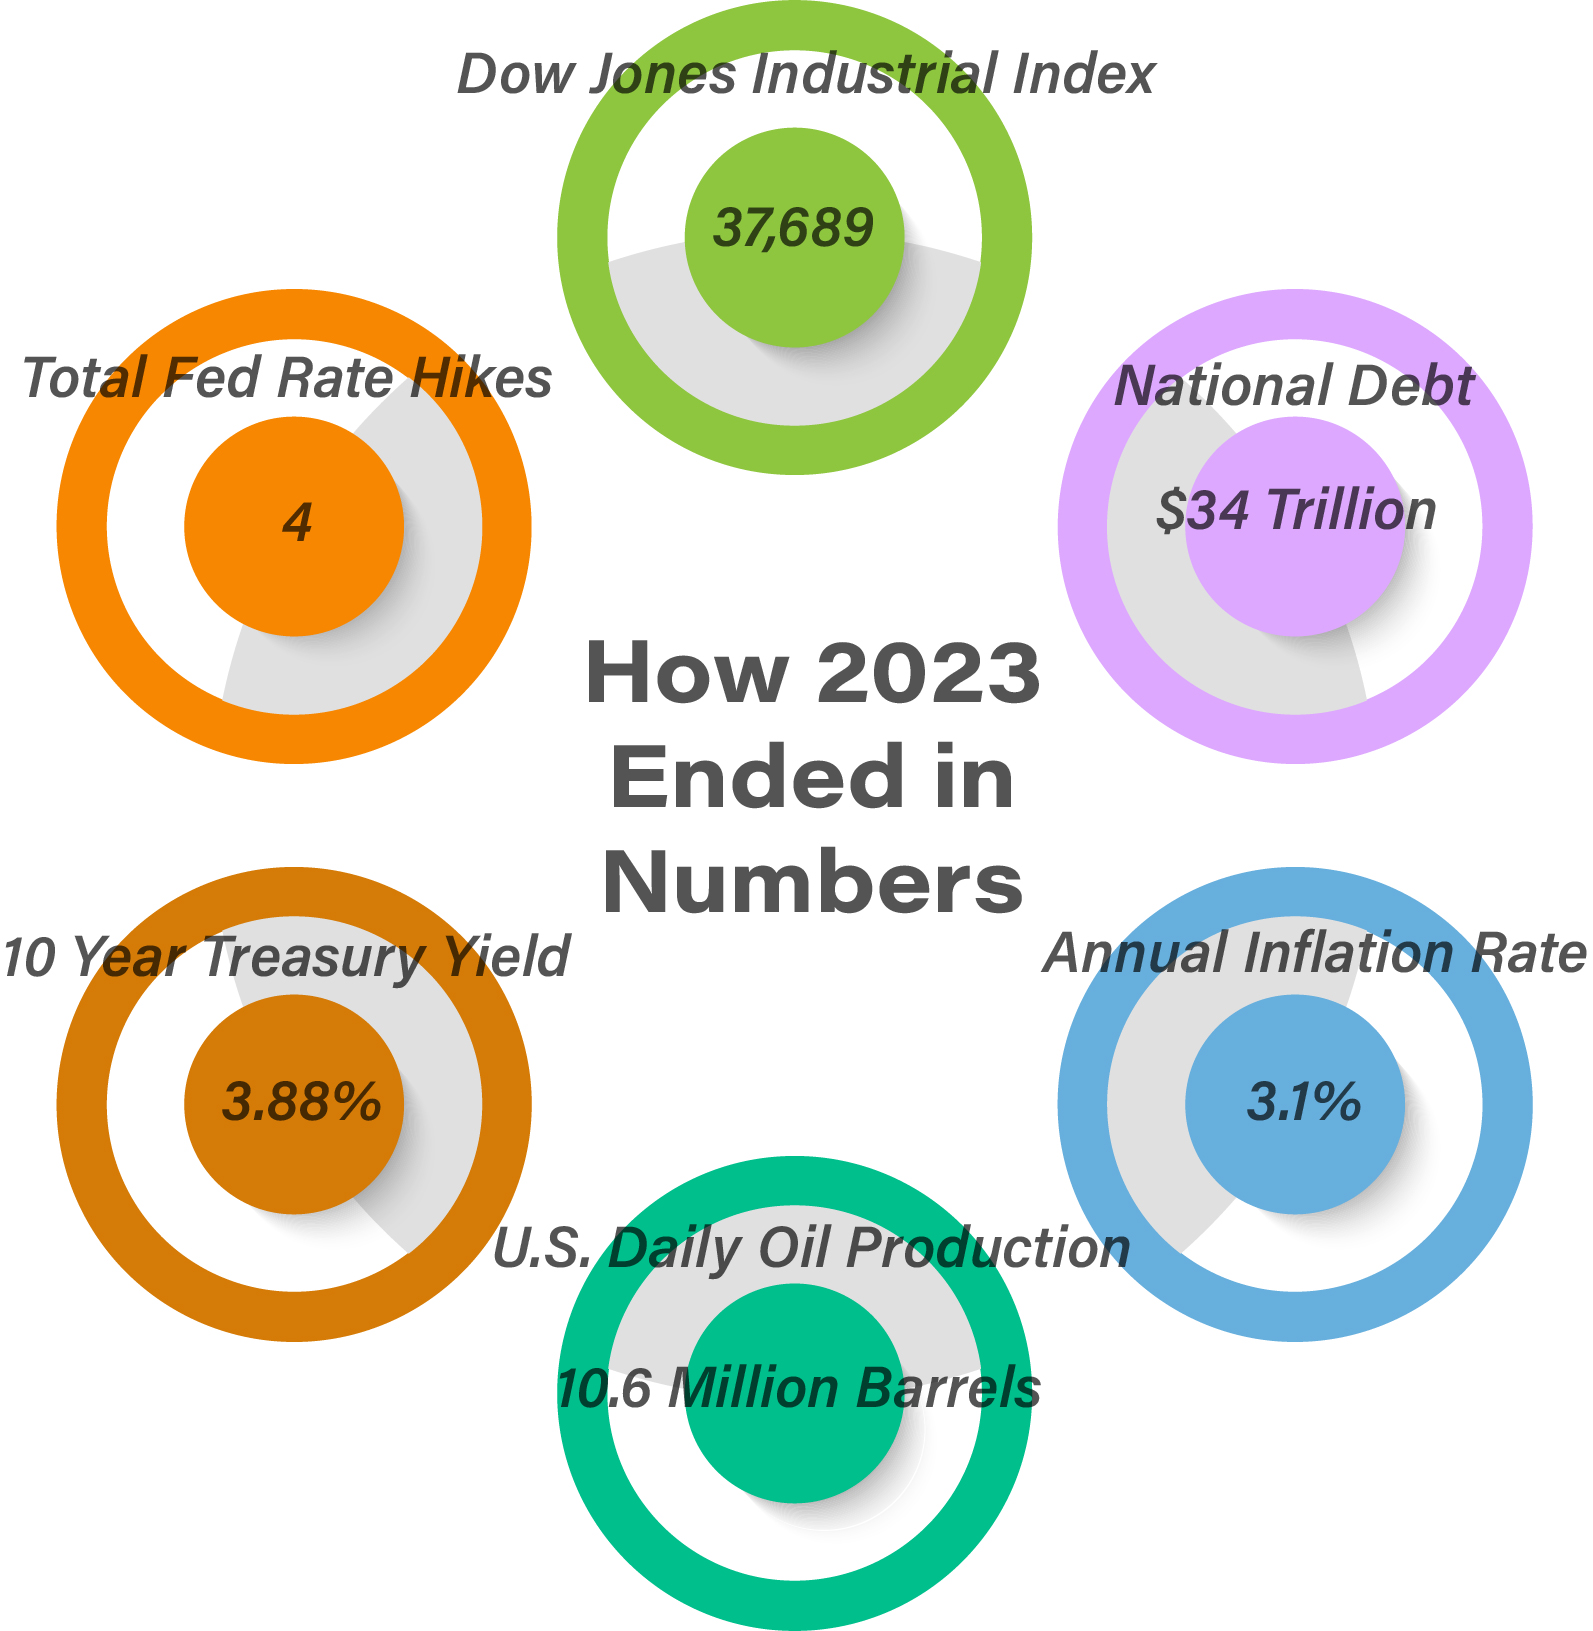
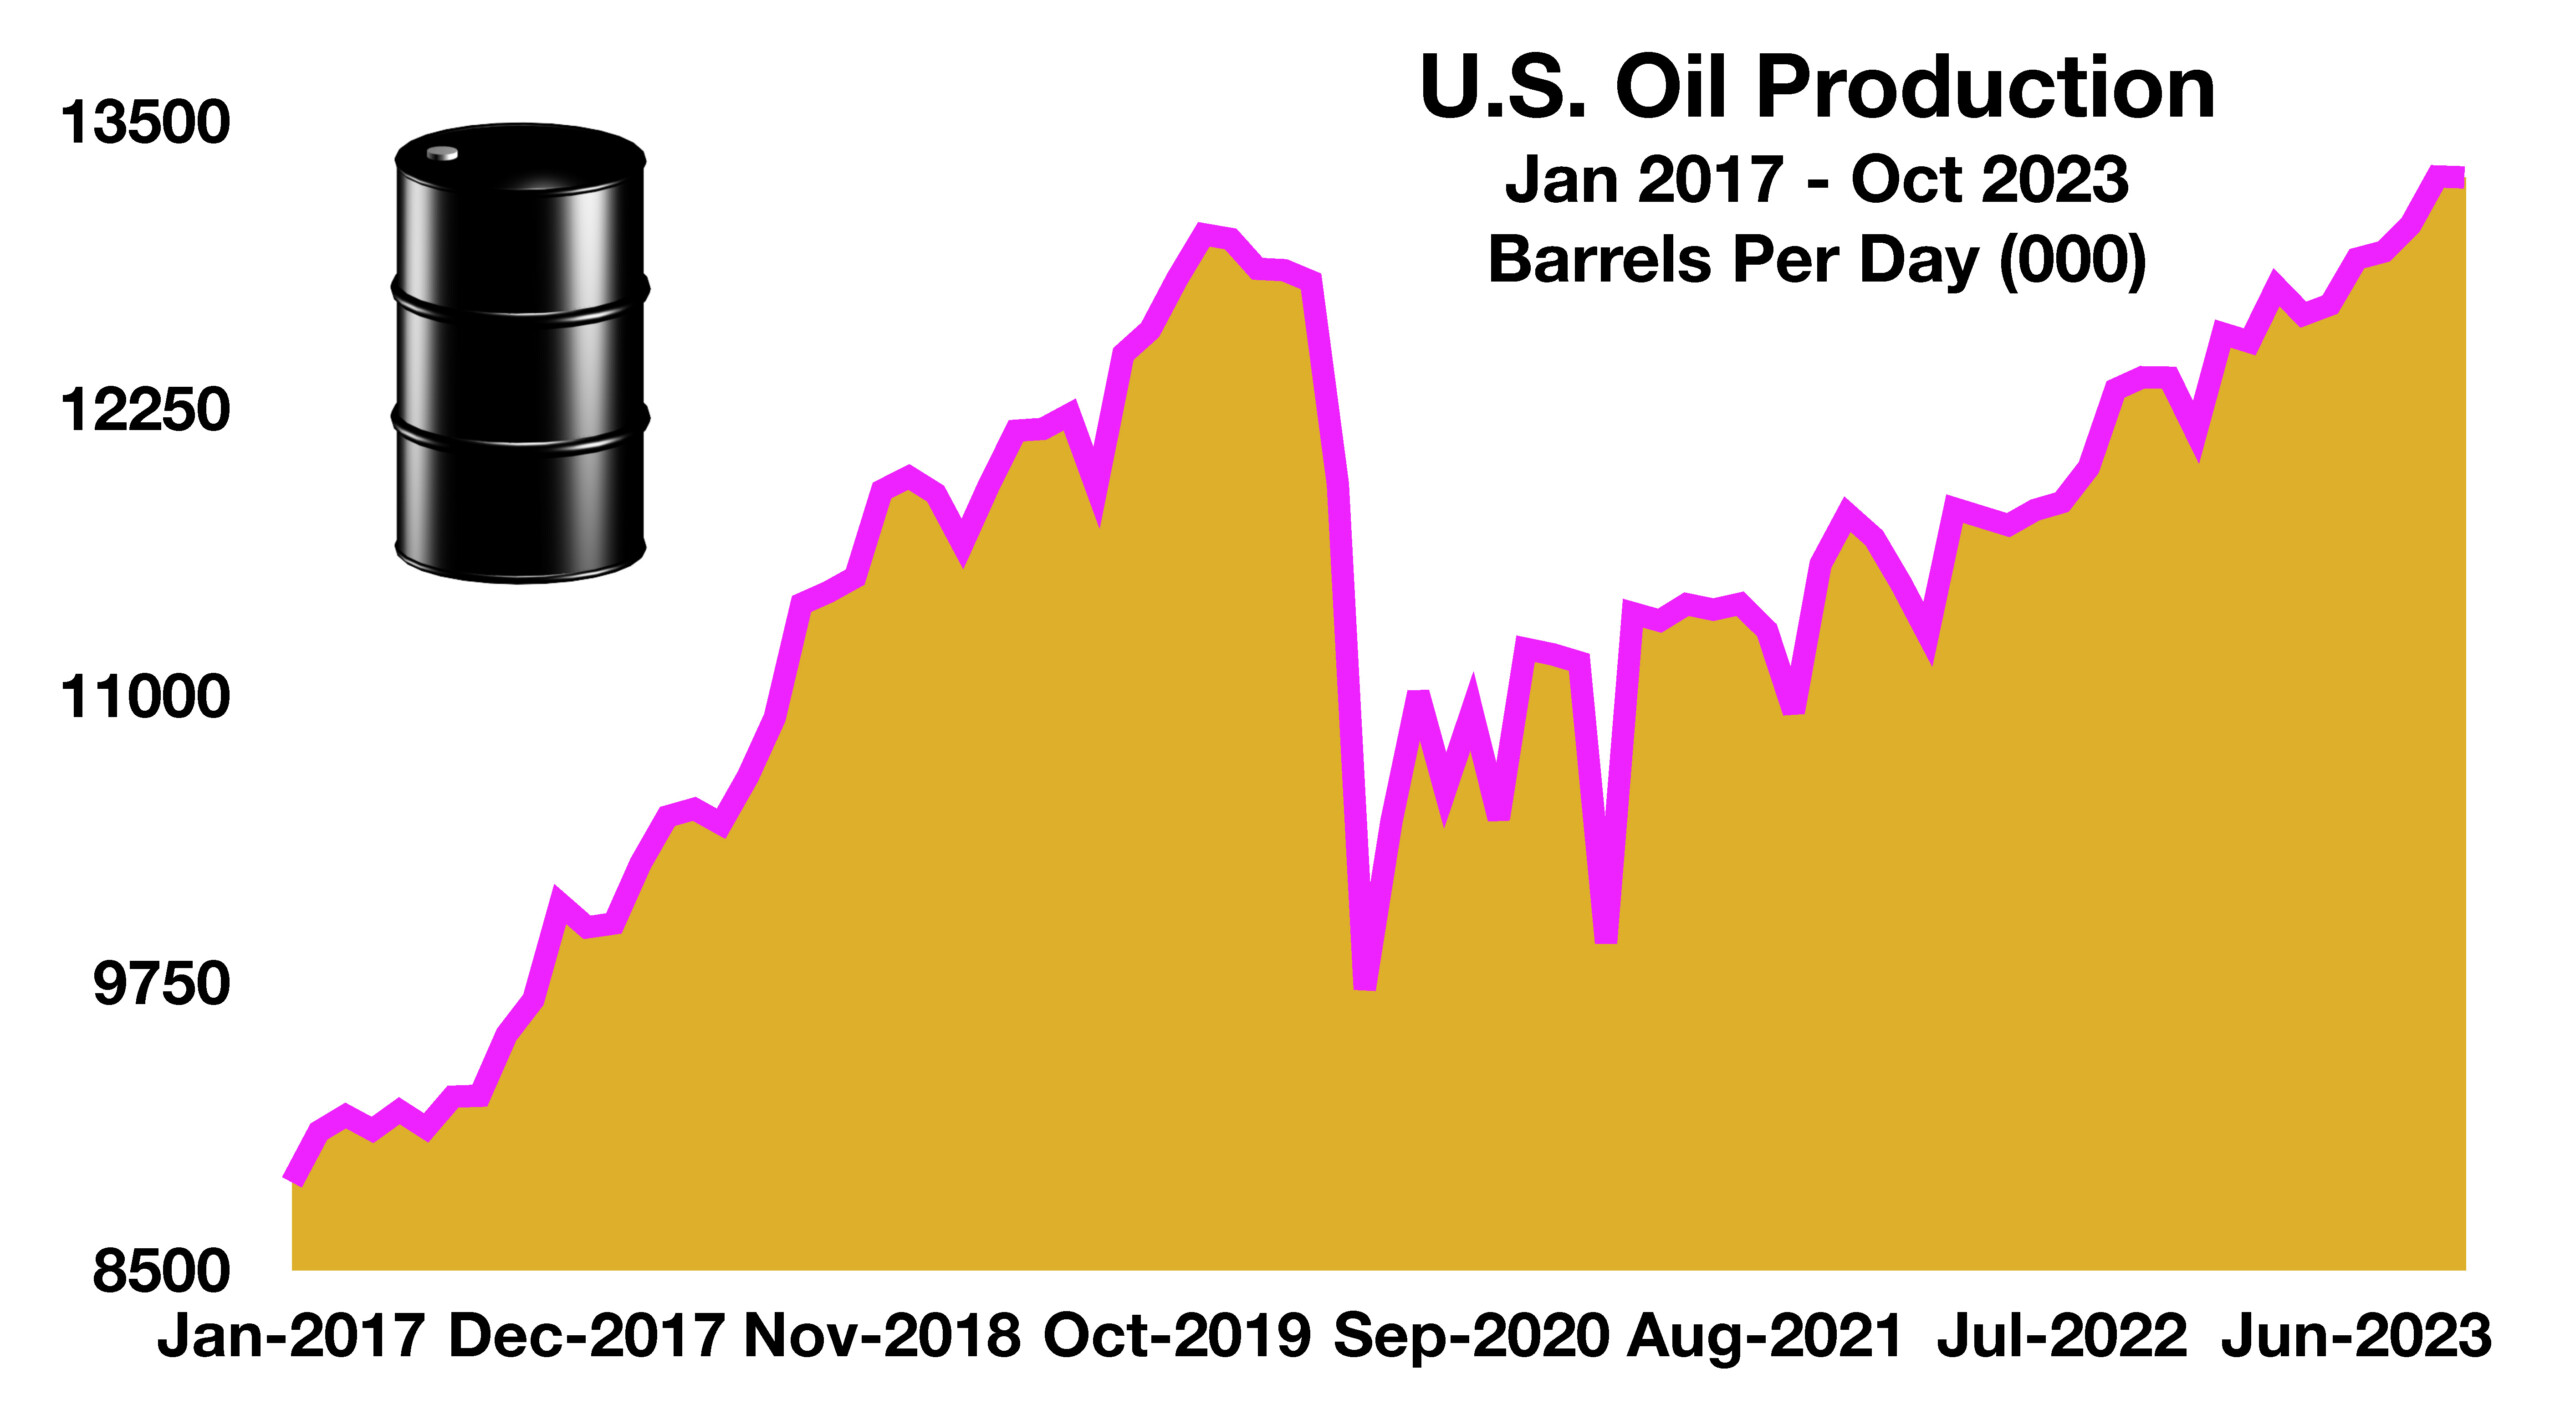
The U.S. exported approximately 75% of total domestic oil production in 2023, supplying both developed and emerging countries worldwide. Supply constraints for oil may pose a challenge as a result of worsening shipping disruptions in the Middle East, affecting prices globally.

Total Federal Debt for the U.S. reached $34 trillion at the end of 2023, up from $27.6 trillion at the beginning of 2021. Rising rates this past year have added additional debt costs for the U.S. government as interest expenses on outstanding U.S. debt has risen substantially. (Sources: Fed, BEA, Treasury Dept., EIA)

 
7 stocks accounted for roughly half of the return for the S&P 500 Index in 2023

The Fed Hikes Rates Four Times In 2023 – Bond Market Overview

The Federal Reserve raised rates eleven times between 2023 and 2022, increasing the Fed Funds rate from 0% at the beginning of 2022 to 5.5% at the end of 2023. Expectations are that the Fed will begin easing rates in 2024, reversing its tightening monetary policy. Lower consumer and mortgage rates are expected to materialize as the Fed eases.

Fed influenced rate reductions among other central banks globally is creating a lower rate scenario in 2024. The European Central Bank (ECB) as well as the central banks of Canada and England signaled a continued easing of rate policy in 2024.

A unique dynamic started to occur in the 4th quarter of 2023, with Treasury yields and commodity prices falling in tandem. Some economists perceive this dynamic as deflationary in nature, adding to an eventual lower rate environment. Deteriorating inflation concerns have also led the Fed to project possible lower rates as the year progresses. The yield on the 10-year Treasury bond ended 2023 at 3.88%, down from 4.95% earlier in October.

Sources: Federal Reserve Bank of St. Louis; https://fred.stlouisfed.org/series/FEDFUNDS

Stocks Finish 2023 On A Positive Note – Global Equity Review

Major global equity indices experienced a reversal in performance towards the end of 2023 relative to earlier in the year. Domestic indices including the Dow Jones Industrial Index and the S&P 500 Index, finished the year positively, along with international indices including the Japanese Nikkei 225 and the German DAX.

Seven stocks accounted for roughly half of the return for the S&P 500 Index in 2023. Such a disparity can distort the actual representation of the index, with only seven stocks representing such a large portion of returns relative to the other 493 stocks within the index. Information technology stocks contributed the most to the performance of the S&P 500 Index, accounting for approximately half of the indices’s return in 2023. Seventy-one percent of the S&P 500 Index rose less than the index itself in 2023, a disconnect from the top seven. It was the first time since 2012 that the S&P 500 Index failed to close at a record high at least once during the year. The index closed at its current record high in January 2022.

Sources: S&P, Bloomberg, Reuters, https://fred.stlouisfed.org/series/SP500


58% of U.S. households own stocks up from 53% in 2019

More U.S. Households Own Stocks – Consumer Finances

A recent survey conducted by the Federal Reserve, called the Survey of Consumer Finances has identified that 58% of U.S. households own stocks, up from 53% in 2019. The findings released in the fall of 2023 reflect the most available data from 2022. The same survey identified that 52% of households owned stocks in 2019, validating a gradual increase in stock ownership over the past few years.

Equity ownership varies among households, varying by age and income across the country. The survey did find that the bulk of equity holdings remains concentrated with older and higher income households. The survey includes consumer household accounts holding individual stocks, mutual funds, and Exchange Traded Funds (ETFs).

Source: federalreserve.gov

Market Performance During Presidential Election Years – Political Dynamics

Election year markets are always a quandary, as candidates propose economic and fiscal plans in order to boost the nation’s economy. Interestingly enough, political parties have had nearly no bearing on market performance during election years as far back as 1928.

Federal Reserve policy during an election year can be construed as politically influenced, even though the Fed’s stated disconnect from the administration and political sway is clearly defined. The Fed has risen interest rates 60% of election years since 1928, with varying political parties in office. The average return for the S&P 500 Index since 1928 during an election year has been approximately 11.25%.

A multitude of factors affect presidential elections, including fiscal and tax policies, foreign policy initiatives, social programs, and economic stimulus objectives. Congressional control of the House and Senate are also a factor during elections, as some states strive to either synergize or disconnect from Federal initiative. (Source: Federal Reserve Bank of St. Louis)


The u.s. produces over 13 million barrels of oil daily

U.S. Oil Production Reaches Another Record – Commodity Sector Overview

Despite efforts to curtail oil consumption and production of domestic oil, the U.S. achieved another record producing year in 2023. With over 13 million barrels of oil produced per day, the U.S. continues to be the worlds largest producer, eclipsing Russia and Saudi Arabia as a distant second and third. The United States has ranked as the world’s top oil producer since 2018.

The U.S. shale industry, known for its fracking technology to extract oil from shale rock formations, has continued to surprise the world oil markets with its resistance to varying prices. U.S. drillers have thus far been able to beat Saudi Arabia’s “pump and dump” strategy over the past few years to lower oil prices in order to maintain market share.

Global demand for oil has been steadily increasing for the past two decades, with a slight pullback during the pandemic in 2020. The broadening demand has been from both developed and emerging economies, as the reliance on crude oil and gasoline remains intact worldwide. The United States has become one of the top five exporting oil countries, with over 10 million barrels exported each month, representing two thirds of total U.S. production (Source: U.S. Energy Information Administration; U.S. Field Production of Crude Oil)

Global Tax Rates On The Rise – Global Tax Policy

Governments worldwide rely on tax revenue in order to fund government expenses and operations. Tax policies and initiatives vary from country to country depending on the economic prosperity and health of the country’s economy. Developed countries tend have more comprehensive and structured tax policies in place, relative to emerging market countries.

The recent rise in interest rates worldwide has led to a higher cost of governments issuing debt, thus prompting governments to instead resort to raising taxes. France, Japan and South Korea are among countries with increasing tax revenue in lieu of issuing additional government debt. Certain developed economies are also seeing an increase in labor force participating rates, including France, Germany, Italy, and Japan. Increasing participating rates tend to increase tax revenues as more workers add to the tax revenue base. (Sources: OECD; Tax On Personal Income Publication)