Ocean Park Capital Management

2503 Main Street

Santa Monica, CA 90405

Main: 310.392.7300

Daily Performance Line:  310.281.8577

December 2024
Market Update
(all values as of 04.30.2025)

Stock Indices:

Dow Jones 40,669
S&P 500 5,569
Nasdaq 17,446

Bond Sector Yields:

2 Yr Treasury 3.60%
10 Yr Treasury 4.17%
10 Yr Municipal 3.36%
High Yield 7.69%

YTD Market Returns:

Dow Jones -4.41%
S&P 500 -5.31%
Nasdaq -9.65%
MSCI-EAFE 12.00%
MSCI-Europe 15.70%
MSCI-Pacific 5.80%
MSCI-Emg Mkt 4.40%
 
US Agg Bond 3.18%
US Corp Bond 2.27%
US Gov’t Bond 3.13%

Commodity Prices:

Gold 3,298
Silver 32.78
Oil (WTI) 58.22

Currencies:

Dollar / Euro 1.13
Dollar / Pound 1.34
Yen / Dollar 142.35
Canadian /Dollar 0.72

Portfolio Overview

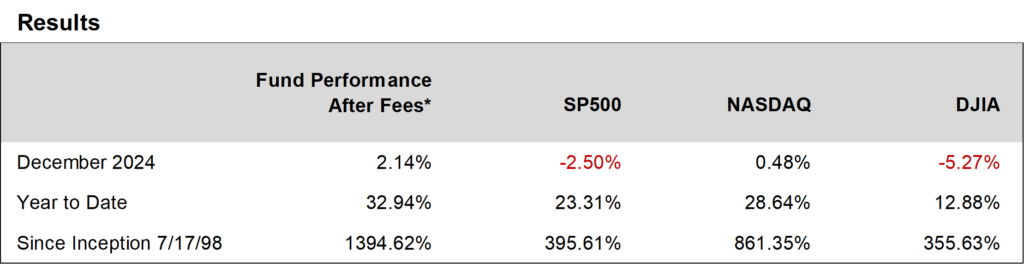
Ocean Park Investors Fund delivered excellent results in 2024, gaining 32.94%* for the year (after a 33.46%* gain in 2023), while the S&P 500 gained 23.31% and the NASDAQ Composite gained 28.64%.

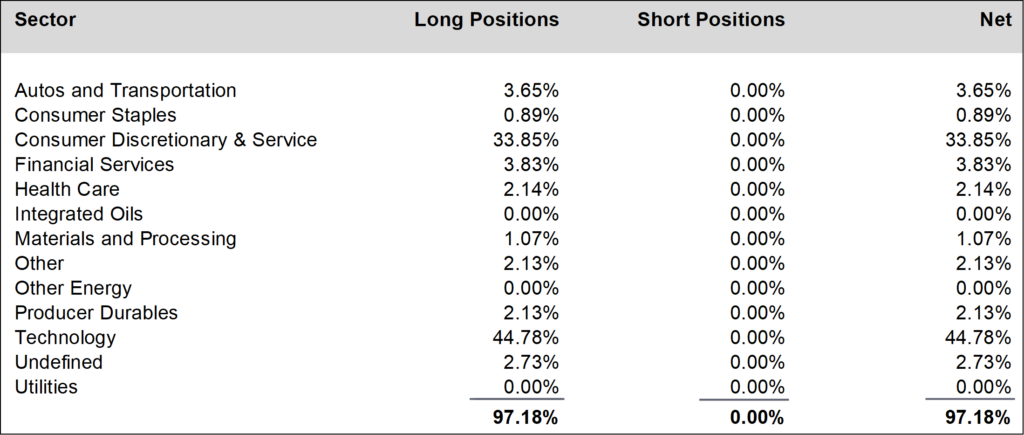
Our investment approach has always focused on identifying companies with earnings potential that exceeds consensus expectations. Historically, this strategy resulted in a portfolio of 60 to 90 positions. However, over the past two years, we have shifted toward concentrating larger investments in a smaller number of high-conviction opportunities, especially in companies which benefit from technological innovation.  While maintaining diversification, we’ve reduced the number of holdings from 64 at the end of 2022 to 54 at the end of 2023, and further to 44 by the close of 2024.  We believe that this streamlined approach has been a key driver of the fund’s exceptional performance over the past two years—among the strongest since its inception.

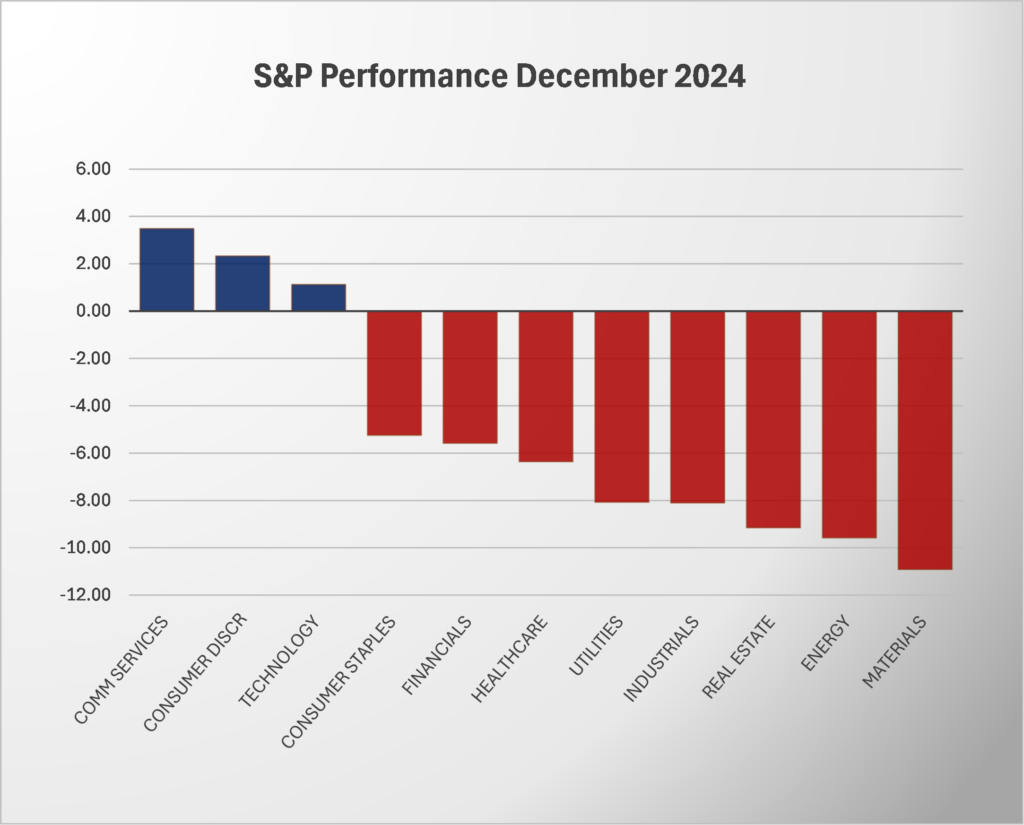
In December, the fund rose 2.14%* while the S&P 500 fell 2.50% and the NASDAQ Composite rose 0.48%.  Portfolio holdings in technology stocks led the way, with gains in Broadcom (up 43%) and Astera Labs (up 28%) offsetting a modest decline in Nvidia.  During the month we increased positions in the consumer discretionary and service sector and reduced exposure to the IVV ETF.  We finished the month at about 96% net long, down from about 97% in November.

We once again thank you for your investment in the Fund, as we strive to build upon our long-term performance and earn your continued confidence.


Daily updates on our activity are available on our Results Line, at 310-281-8577, and current information is also maintained on our website at www.oceanparkcapital.com.

*These results are pro forma. Actual results for most investors will vary. See Asset Allocations and additional disclosures on page 4. Past performance does not guarantee future results.


Equity Overview

Equity Overview

Only 3 of 11 sectors gained in December.  Communication Services were the strongest and Materials were the weakest.  Growth stocks outperformed value for the month and the full year.

Market volatility was elevated, as the S&P 500 moved by 1% or more on 5 of 21 trading days.

Stock valuations remain stretched as the 12-month forward price/earnings ratio for the S&P 500 reached 22.6, above the 5-year average of 18.8.


Macro Overview

Macro Overview

Positive economic news on many fronts powered stock performance in 2024.  Inflation moderated further, with the CPI declining to 2.9%.  The Fed lowered short-term interest rates by a full point, to a range of 4.25-4.50%.  GDP growth was strong at 2.7%.  Unemployment was low at 4.1%.  Consumer spending was robust, increasing by 3.7%, and consumer sentiment was high.

Equally important, corporate earnings were impressive as third-quarter S&P 500 aggregate earnings growth was 5.9% year-over year.  Fourth-quarter aggregate growth is projected even higher, at 11.9%.

The wrinkle for 2025 is the unknown impact on the stock market of policy changes by the new presidential administration.  U-turns are likely in numerous areas, including government spending, tax cuts, deregulation, immigration, and geopolitics, to name a few.  On the other hand, translating these policies into actual legislation will be more difficult given the extremely narrow Republican majority in the House of Representatives.  Hopefully this will mitigate the more draconian possibilities.


Asset Allocations and Additional Disclosures

Asset Allocations


Additional Disclosures

Performance data for OPI reflect the reinvestment of dividends and other earnings on the fund’s assets.  Performance data for the major indices reflect only changes in the value of those indices, and would be higher if dividends were included. However, the index data do not reflect fees that would be paid to index fund managers and transaction costs that would be incurred when their component stocks are bought or sold, while OPI’s data do reflect quarterly fees and expenses incurred by the fund.  The information provided is believed to be reliable, but its accuracy or completeness is not warranted. This material is not intended as an offer or solicitation for the purchase or sale of any stock, bond, mutual fund, or any other financial instrument. The views and strategies discussed herein may not be appropriate and/or suitable for all investors. This material is meant solely for informational purposes, and is not intended to suffice as any type of accounting, legal, tax, or estate planning advice. Any and all forecasts mentioned are for illustrative purposes only and should not be interpreted as investment recommendations.