Ocean Park Capital Management
2503 Main Street
Santa Monica, CA 90405
Main: 310.392.7300
Daily Performance Line: 310.281.8577
| Dow Jones | 48,063 |
| S&P 500 | 6,845 |
| Nasdaq | 23,241 |
| 2 Yr Treasury | 3.47% |
| 10 Yr Treasury | 4.18% |
| 10 Yr Municipal | 2.73% |
| High Yield | 6.48% |
| Dow Jones | 13.07% |
| S&P 500 | 16.46% |
| Nasdaq | 20.36% |
| MSCI-EAFE | 27.89% |
| MSCI-Europe | 31.95% |
| MSCI-Pacific | 29.87% |
| MSCI-Emg Mkt | 30.58% |
| US Agg Bond | 7.30% |
| US Corp Bond | 7.77% |
| US Gov’t Bond | 6.88% |
| Gold | 4,325 |
| Silver | 70.34 |
| Oil (WTI) | 57.42 |
| Dollar / Euro | 1.17 |
| Dollar / Pound | 1.34 |
| Yen / Dollar | 156.18 |
| Canadian /Dollar | 0.73 |
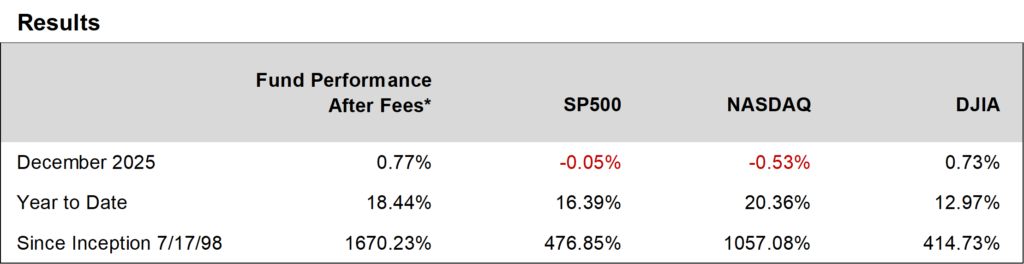
Ocean Park Investors Fund delivered solid returns in 2025, gaining 18.44%* for the year while the S&P 500 gained 16.39% and the NASDAQ Composite gained 20.36%.
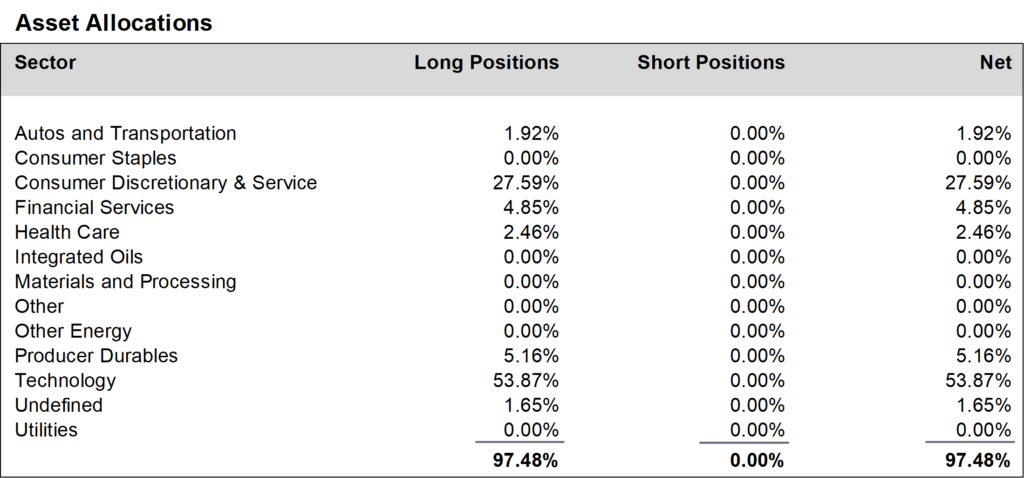
Our investment approach remains unchanged: identifying companies whose earnings are likely to exceed consensus expectations. In recent years, we have further concentrated the portfolio toward our highest-conviction opportunities in businesses benefiting from technological innovation, reducing the number of holdings from 64 at the end of 2022 to 44 by the end of 2024. This focus on fewer, higher-conviction positions has served our investors well and contributed to one of the strongest multi-year performance periods in the Fund’s history.
In December, the Fund rose 0.77%* while the S&P 500 declined 0.05% and the NASDAQ Composite declined 0.53%. The month was characterized by modest volatility and continued sector rotation as investors repositioned heading into year-end.
We remain grateful for your investment in the Fund as we work to build on our long-term performance and earn your continued confidence.
Daily updates on our activity are available on our Results Line, at 310-281-8577, and on our website at www.oceanparkcapital.com. Enter password opcap.
*These results are pro forma. Actual results for most investors will vary. Additional disclosures on page 4. Past performance does not guarantee future results.
The S&P 500 finished 2025 with a gain of 16.39%, exceeding long-term historical averages. Despite a complex macro backdrop—including persistent inflation, a divided Federal Reserve, and a narrowly divided Congress that limited legislative flexibility—equities demonstrated notable resilience throughout the year.
Sector performance was uneven. Technology and communication services led the broader market, driven by sustained investment in and adoption of artificial intelligence. Semiconductor companies and other AI infrastructure beneficiaries produced particularly strong gains, while energy stocks lagged as oil prices moderated from early-year levels.
Market volatility remained moderate for much of the year, with episodic increases tied to economic data surprises and monetary policy communication. By year-end, the S&P 500 was trading at a forward price-to-earnings multiple in the low-20s, reflecting elevated but not historically extreme valuations.
Growth stocks outperformed value stocks for the full year, extending a multi-year trend favoring companies with strong earnings momentum and exposure to secular technology growth.
2025 presented an unusual combination of economic crosscurrents that tested both investors and policymakers. The Federal Reserve implemented three quarter-point rate cuts during 2025, lowering the federal funds target range to 3.50%–3.75% by year-end. Inflation moderated during 2025 but remained persistent. The U.S. labor market showed signs of cooling, with job growth slowing and the unemployment rate edging modestly higher. Even so, the economy continued to expand and avoided the recession many had anticipated following the 2022–2023 tightening cycle. Economic growth, while moderate, remained sufficient to support corporate profitability.
Corporate earnings were the primary driver of equity performance in 2025. S&P 500 earnings growth for the year is estimated to have exceeded 12%, led by large-capitalization technology companies and businesses benefiting from artificial intelligence investment. This earnings strength has underpinned equity valuations and supported the positive returns realized by investors.
Artificial intelligence remained the dominant market theme, with Microsoft, Alphabet, Amazon, and Meta collectively expected to invest more than $440 billion in AI-related infrastructure in 2026, about one-third above current levels. While questions have emerged regarding the long-term returns on this investment, the near-term impact on semiconductor manufacturers, software platforms, and infrastructure providers has been significant. An important question for markets is whether productivity gains from AI will ultimately broaden beyond core infrastructure and software providers to a wider range of industries. A broader diffusion of benefits would strengthen the foundation for sustained economic and earnings growth.
2025 was a strong year for equities and a strong year for Ocean Park Investors Fund. Our performance relative to broad market indices reflects the investment discipline we have followed for more than two decades: identifying companies with underappreciated earnings potential and positioning the portfolio accordingly. This approach does not produce uniform results in every market cycle, as 2022 clearly demonstrated. Over time, however, corporate earnings and earnings surprises remain the primary drivers of long-term equity returns, and we remain committed to this discipline.
Performance data for OPI reflect the reinvestment of dividends and other earnings on the fund’s assets. Performance data for the major indices reflect only changes in the value of those indices, and would be higher if dividends were included. However, the index data do not reflect fees that would be paid to index fund managers and transaction costs that would be incurred when their component stocks are bought or sold, while OPI’s data do reflect quarterly fees and expenses incurred by the fund. The information provided is believed to be reliable, but its accuracy or completeness is not warranted. This material is not intended as an offer or solicitation for the purchase or sale of any stock, bond, mutual fund, or any other financial instrument. The views and strategies discussed herein may not be appropriate and/or suitable for all investors. This material is meant solely for informational purposes, and is not intended to suffice as any type of accounting, legal, tax, or estate planning advice. Any and all forecasts mentioned are for illustrative purposes only and should not be interpreted as investment recommendations.