Earl R. King Sr., CFP®

Managing Member

1300 Caraway Court, Suite 200

Largo, MD 20774

Tel: 301-364-1617/Cell: 240-472-6570

 eking@erogerfinancial.com / www.erogerfinancial.com


July 2018
Market Update
(all values as of 07.31.2024)

Stock Indices:

Dow Jones 40,842
S&P 500 5,522
Nasdaq 17,599

Bond Sector Yields:

2 Yr Treasury 4.29%
10 Yr Treasury 4.09%
10 Yr Municipal 2.78%
High Yield 7.30%

YTD Market Returns:

Dow Jones 8.37%
S&P 500 15.78%
Nasdaq 17.24%
MSCI-EAFE 6.50%
MSCI-Europe 5.88%
MSCI-Pacific 7.62%
MSCI-Emg Mkt 6.26%
 
US Agg Bond 2.03%
US Corp Bond 2.16%
US Gov’t Bond 1.92%

Commodity Prices:

Gold 2,491
Silver 29.22
Oil (WTI) 78.50

Currencies:

Dollar / Euro 1.08
Dollar / Pound 1.28
Yen / Dollar 154.01
Canadian /Dollar 0.72
 

Macro Overview

Trade and tariffs disrupted markets in June as the U.S. Commerce Department announced tariffs on $250 billion worth of Chinese imports. The 25% tariffs will be imposed on 1,300 items encompassing a variety of products including aluminum, iron, gas turbines, snow blowers, milking machines, and dental drills.

A flattening yield curve, characteristic of rising short-term rates along with lingering long-term rates, startled fixed income markets. Higher interest rates reflect expectations of inflationary pressures and robust growth, while lower rates imply less inflation and dismal economic expansion. As expected by economists and the markets, the Federal Reserve raised its short-term key policy rate, the federal funds rate, by 25 basis points to 1.75% – 2.00%. The gradual rise in rates is seen as a normalization of interest rates as the U.S. economy continues to expand. The Fed is accelerating the rate of tightening with increases slated for 2019 and 2020 now expected to occur in 2018 and 2019.

Reports from various Federal Reserve district banks reveal that a robust economy, growing tariff pressures, rising wage costs, and a tight labor market are contributing to consumer inflation. The Atlanta Federal Reserve’s economic growth model, GDPNow, estimates GDP growth for the second quarter of 2018 at 4.5%, adding to inflationary pressures. The Fed also reported that household wealth reached $100 trillion for the first time ever, double of where household wealth was at the lows of the financial crisis in 2009.
The Supreme Court ruled in June that public sector unions cannot charge fees to government employees who do not support the union and who do not want to pay. The decision is expected to further weaken the influence of unions, which have been in a decades-long decline.

Volatility in the second quarter didn’t deter equity indices, as the S&P 500 was up 2.9% and the Dow Jones was up 0.7%. The tech heavy Nasdaq advanced 6.3% for the quarter, driven by buyers seeking shelter from the imposed tariffs. A stronger U.S. dollar is starting to weigh on the technology sector as earnings may become affected.

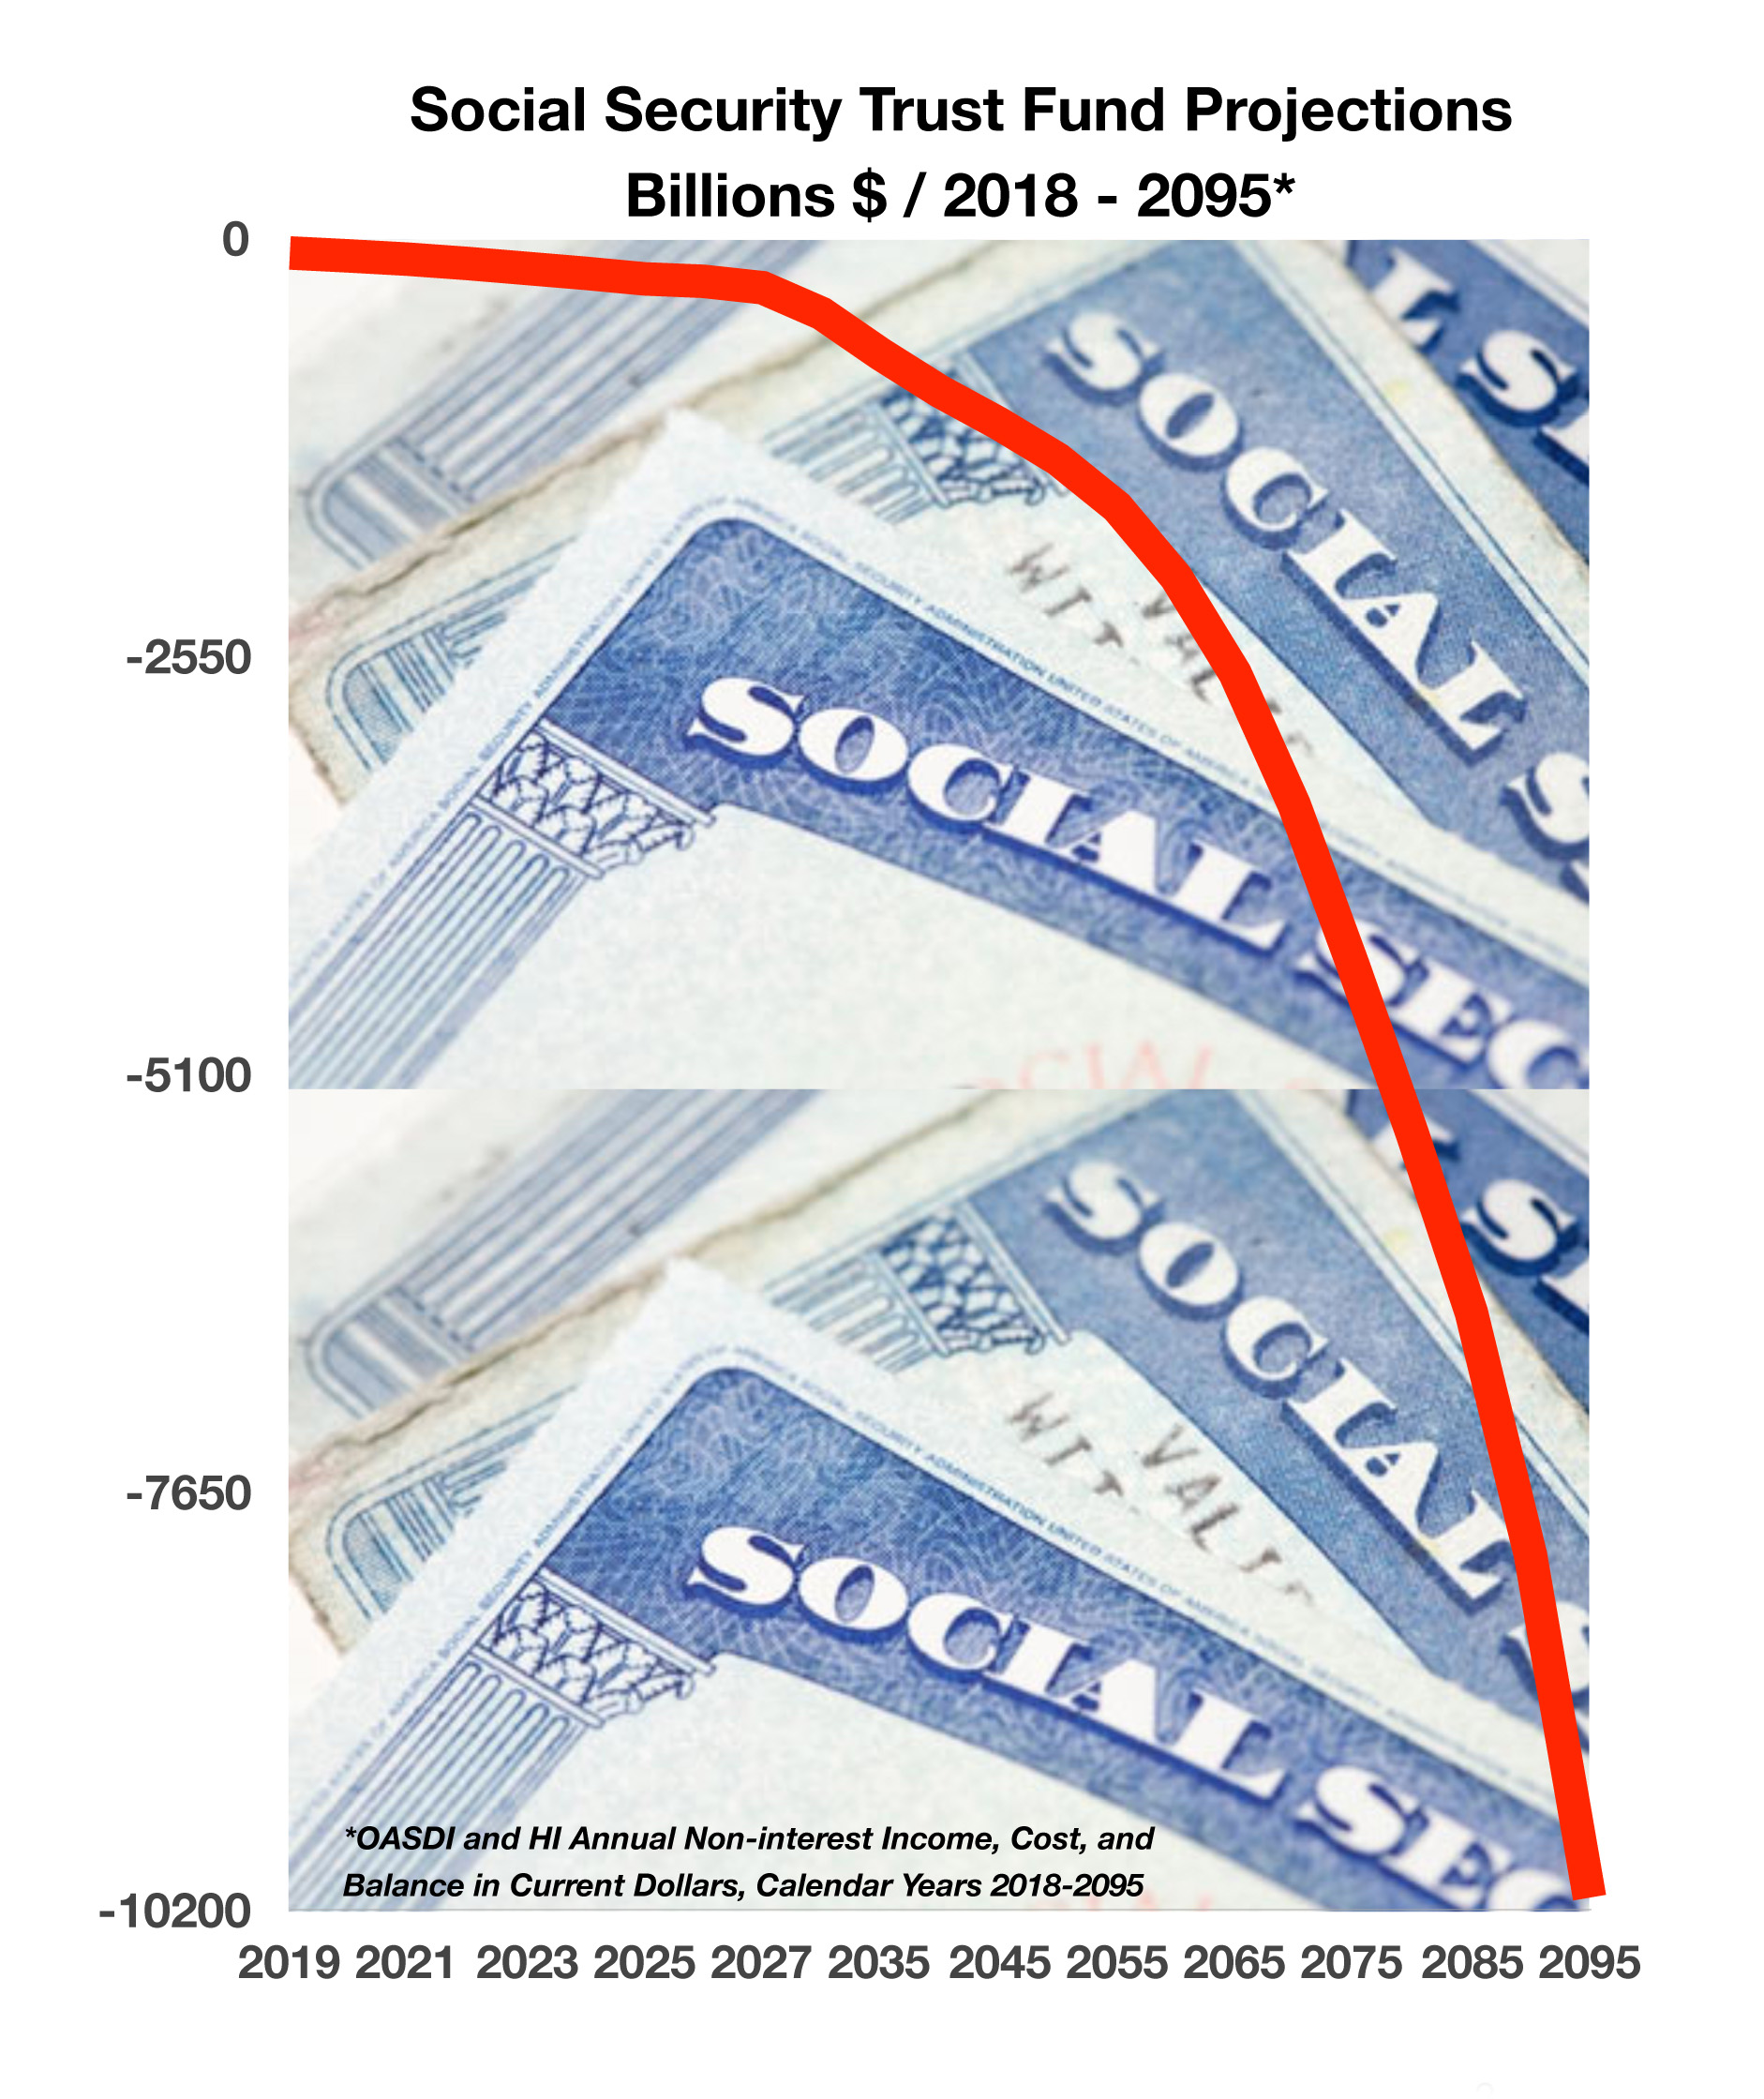
The Social Security program’s cost will exceed its income this year for the first time since 1982, forcing the program to access a $3 trillion trust fund to cover future benefits. It is estimated that the trust fund will be depleted by 2034, meaning that Social Security recipients may no longer be receiving full scheduled benefits. (Sources: U.S. Commerce Dept., Federal Reserve, U.S. Treasury, https://www.supremecourt.gov, Bloomberg, S&P,Dow Jones, Nasdaq, Social Security Admin.)

 
25 companies in the S&P account for over 55% of the $1.9 trillion in cash

Equities Achieve Positive Quarter Despite Volatility – Domestic Equity Markets Update

Energy and technology sector stocks led the markets in the second quarter. All three major indices ended the quarter positively, in light of volatility and trade policy tensions. The S&P 500 was up 2.9% and the Dow Jones was up 0.7%. The tech heavy Nasdaq advanced 6.3% for the quarter.

With oil prices climbing, the energy sector was the market’s top performer for the second quarter, marking its single largest quarterly gain since 2011. Technology sector stocks were also up for the quarter as the sector dodged the tariff turmoil during most of the second quarter, but may be adversely affected by a continuing strengthening dollar. US intellectual property and the growing prominence of technology in the global economy is becoming forefront for regulators, as the administration focuses on protecting U.S. intellectual assets.

Markets are attempting to decipher what industry and companies may be hindered by the newly imposed tariffs. Some companies plan to absorb a portion of the tariffs while others will pass along the costs in the form of higher prices to customers.

Liquidity among S&P 500 companies is distributed unevenly, with the top 25 companies in the index accounting for over 55% of the $1.9 trillion in corporate cash. The bottom 250 companies in the S&P 500 hold essentially no cash.

(Sources: S&P, Dow Jones, Nasdaq, Bloomberg)

Flattening Yield Curve Startles Markets – Domestic Fixed Income Update

The rapid rise of short-term rates along with lingering long-term rates created unease with markets. A lack of rising long-term rates is indicative of weak long-term economic growth, where inflationary pressures may not be present or expanding.

The continued increase in the 2-year Treasury yield is drawing interest from short-term investors as the 2.52 % yield at the end of June was greater than the 1.84% yield on the S&P 500.

The difference in yield between the 2-year Treasury note and the 10-year Treasury bond narrowed to levels not seen since 2007. Also known as the spread, the difference between the 2-year note and 10-year bond is a barometer of economic sentiment. Should shorter term rates, such as the 2-year note, yield more than longer term rates such as the 10-year bond, then economic growth is expected to be lackluster. Some analysts view this narrow spread as a temporary event until economic growth accelerates driving longer term rates higher.

(Sources: U.S. Treasury, S&P, Bloomberg)

 
Recipients might receive about three-quarters of scheduled benefits after 2034

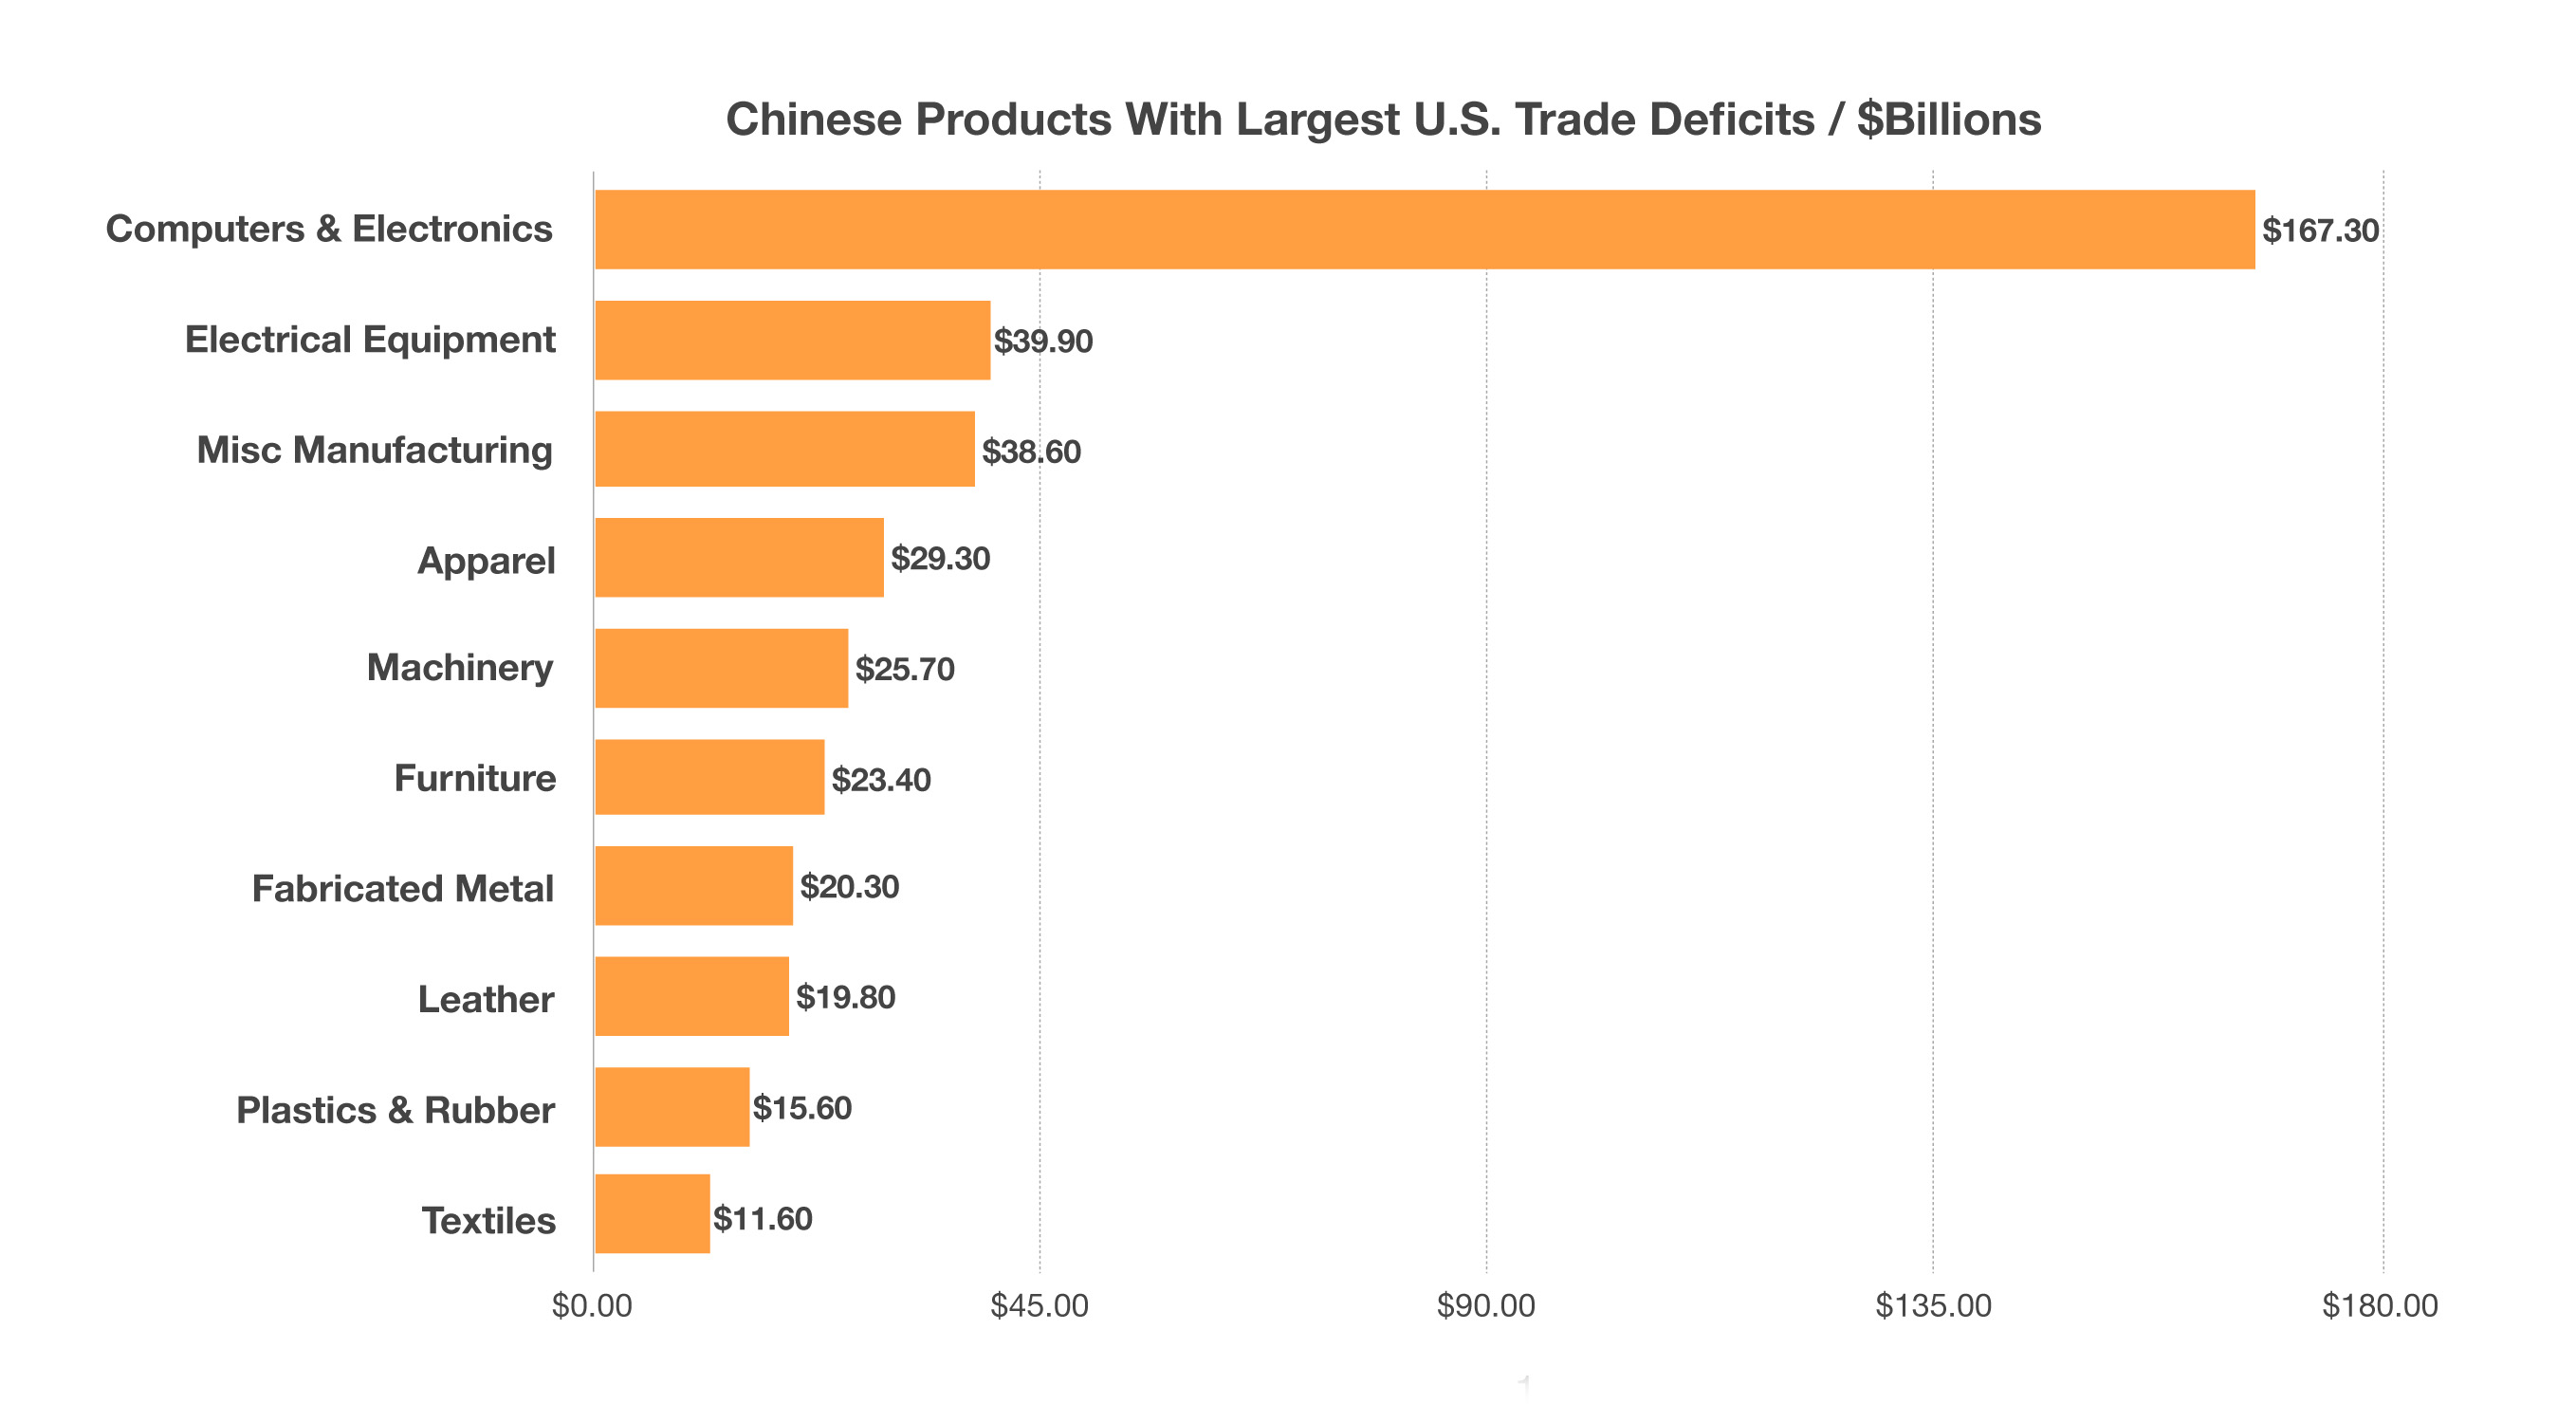
Chinese Products With The Largest Trade Deficits With U.S. – Trade Policy

Electronic devices and computers are the products with the largest trade deficits with the U.S. Over the past few years, American consumers have become accustomed to inexpensive Chinese made products available in every retail and online store across the country.

One of the biggest casualties of the imposed tariffs are auto manufacturers located in the United States. Ironically, there are currently 10 foreign auto manufacturers with plants in the U.S. compared to only two U.S. owned auto manufacturers. These manufacturers all rely on components primarily imported from Asia and China whose controlled costs are critical to the profitability of the companies.

A list of 1300 identified products imported from China are primarily used as components for larger more expensive products. The question is what percentage of these products are comprised of imported components subject to tariffs. Foreign manufacturers have skirted tariffs and manufacturing rifts over the years by having certain products assembled in the United States, but comprised of imported components. Hence the controversial tag noting “assembled in the USA”, which many consumers and consumer groups have found to be misleading. (Sources: U.S. Department of Commerce)
 

Social Security Taps Trust Fund – Financial Planning

The Social Security program’s cost will exceed its income this year for the first time since 1982, forcing the program to access a $3 trillion trust fund to cover future benefits. Social Security is funded by two trust funds, one for retiree benefits and another for disability benefits.

The latest annual report issued by the trustees of Social Security and Medicare revealed that by 2034, the program’s trust fund will be depleted. Depletion means that Social Security recipients will no longer be receiving full scheduled benefits. Recipients would receive about three-quarters of their scheduled benefits after 2034. The report also mentioned that Medicare’s hospital insurance fund would be depleted in 2026, three years earlier than anticipated in last year’s report. The trustees noted that the aging population of the country has placed additional pressure on both the Social Security and Medicare programs. A decade ago, roughly 12% of Americans were age 65 or older, today 16% of Americans have already surpassed 65, the eligibility age for Medicare. The Social Security Administration considers various factors in projecting its estimates, including fertility, immigration, wages, health, and economic growth. A recent drop in U.S. birthrates along with stagnant wages has placed additional burden on the viability of future benefit payments. (Sources: https://www.ssa.gov/oact/TR/2018/index.html)

 
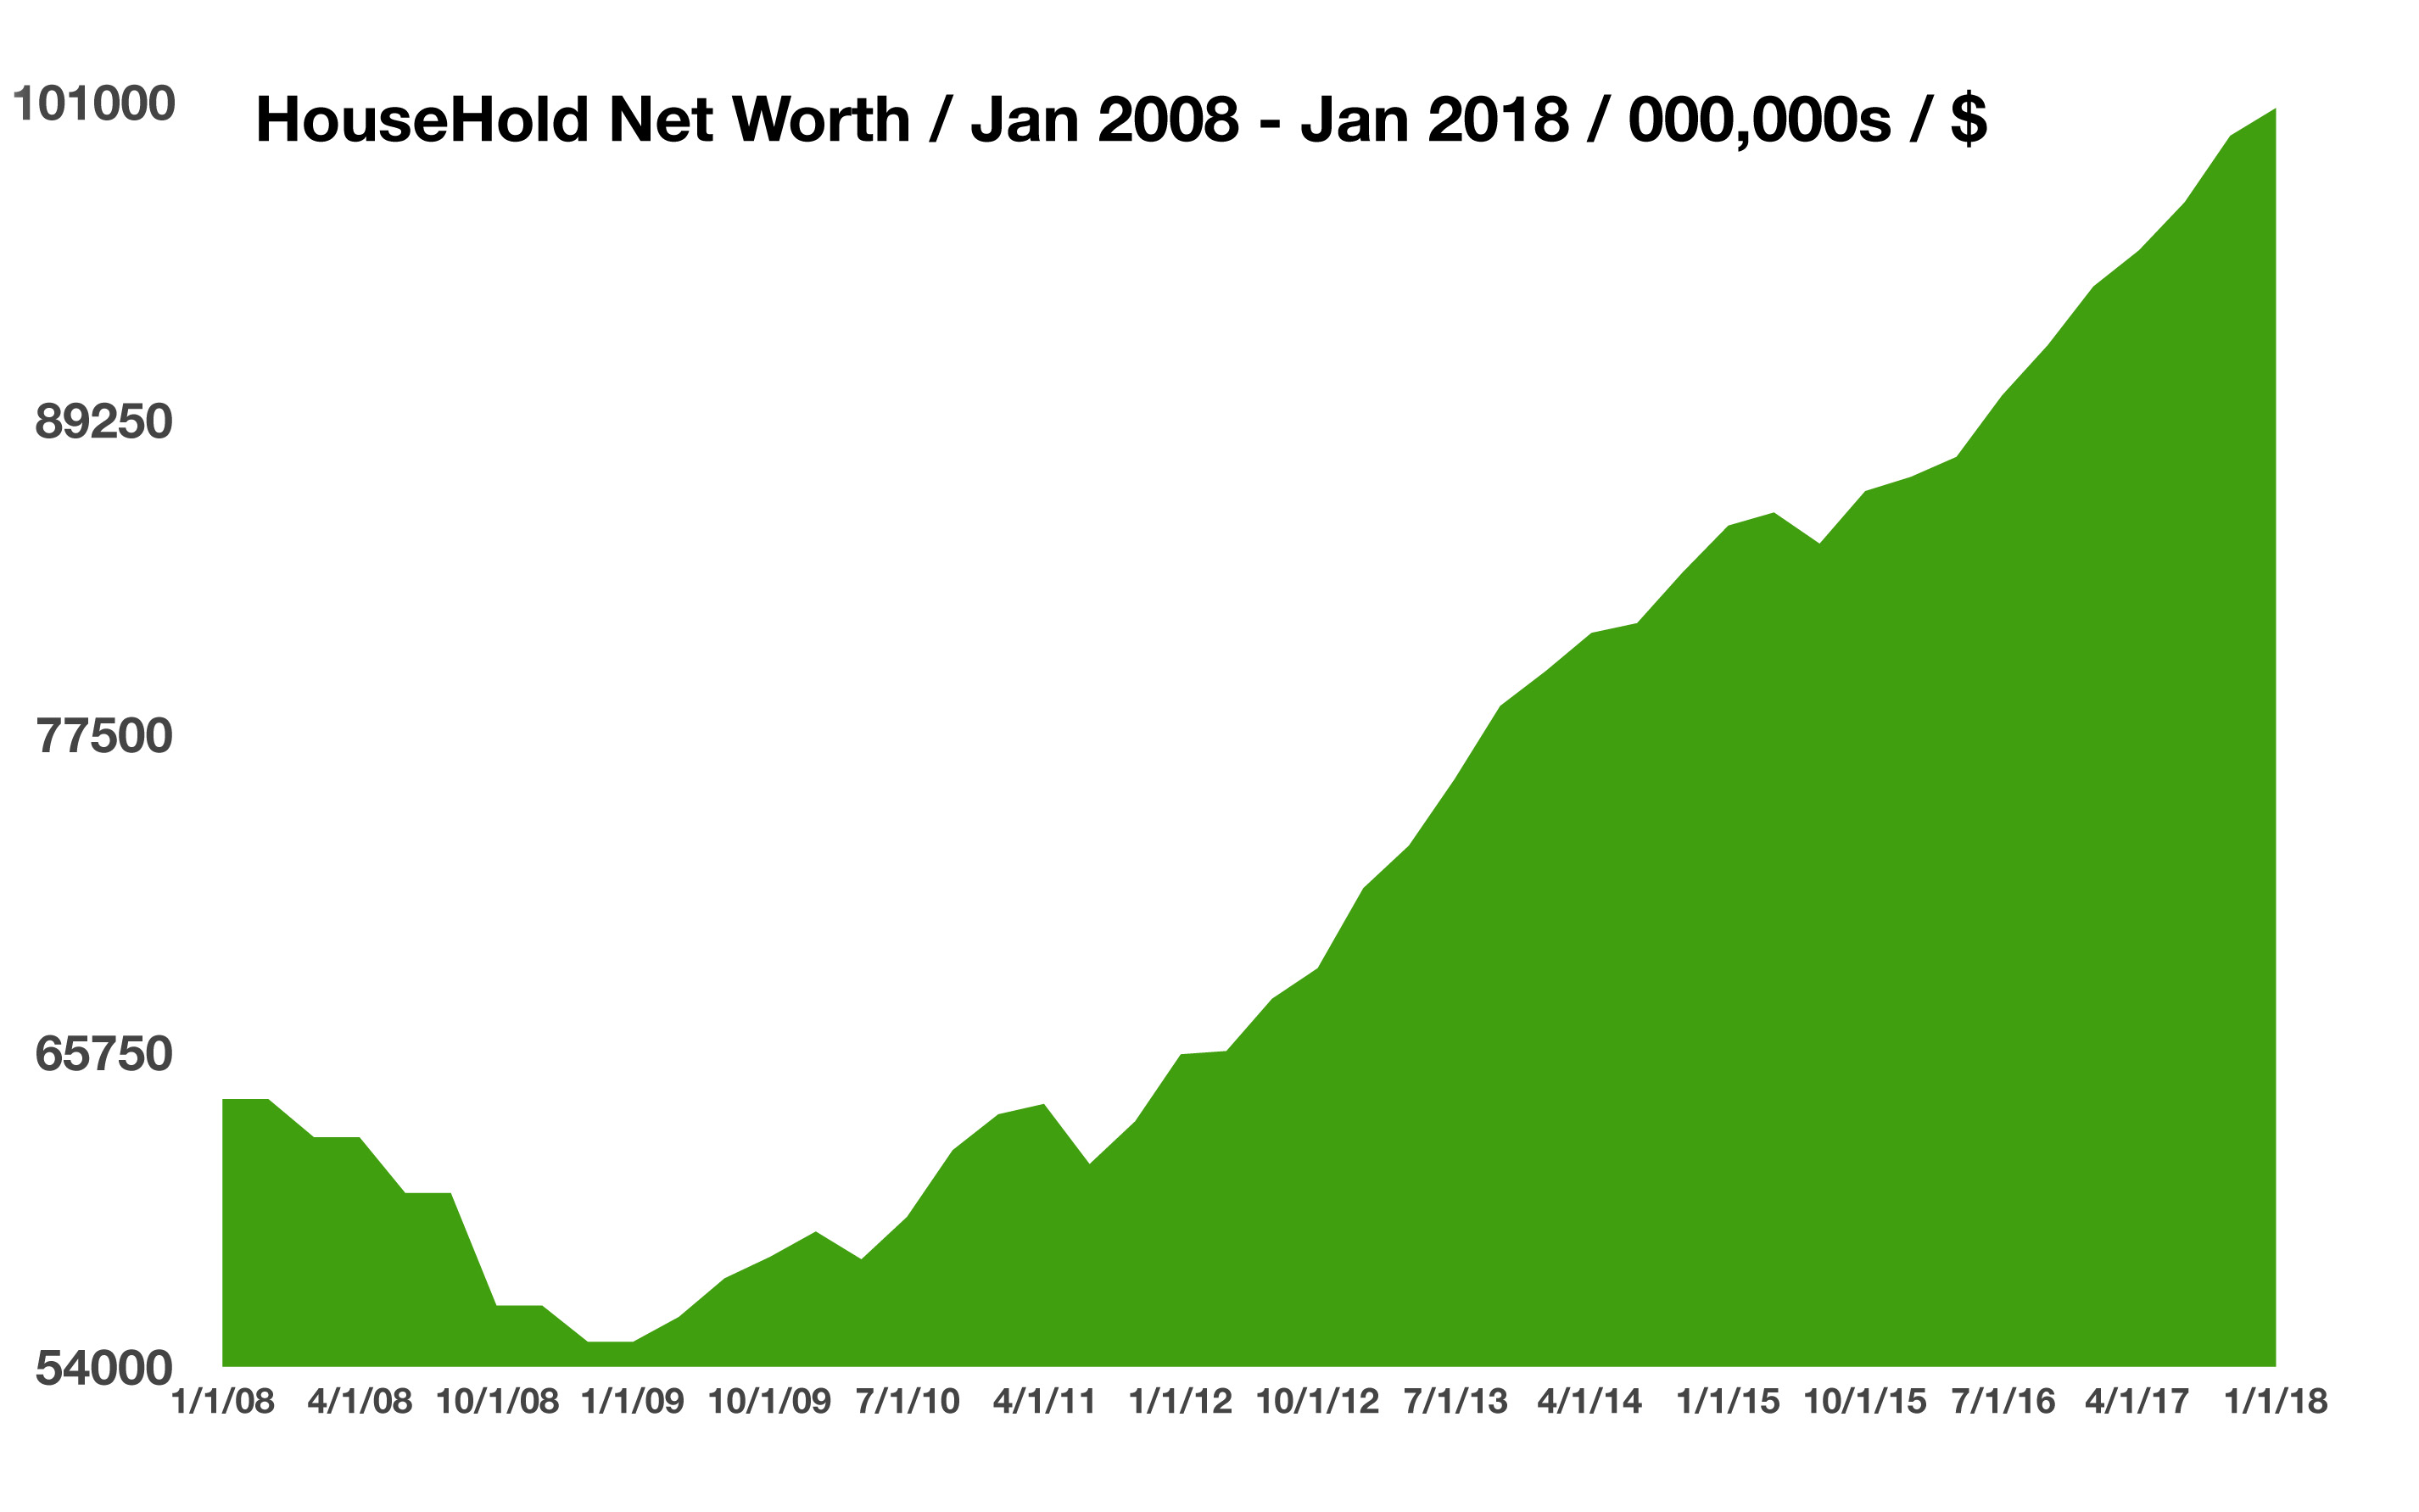
Real estate makes up about 30% of household wealth

Household Net Worth Exceeds $1 Trillion – Domestic Economy

Every quarter the Federal Reserve releases its flow of funds survey, a report measuring the net worth of households. The report includes a “balance sheet” of assets such as real estate, financial assets, bank accounts, as well as outstanding debt.

The net worth of U.S. households and nonprofit organizations rose in the first quarter of 2018 to $100.7 trillion, making it the highest on record. Rising home prices in addition to an increase in the equity markets has helped propel household net worth.

Real estate makes up the single largest component of household wealth, representing about 30%. Corporate equities (individual stocks) make up another 15% of net worth. The components making up household wealth fluctuate in value and are affected by different factors, including monetary and fiscal policy. All in all, a rise in the overall value of these assets is of benefit to economic well-being.

Some economists that follow consumer behavior believe that increases in wealth could make consumers feel more comfortable spending their money, thus contributing to economic growth. (Source: Federal Reserve)

Emerging Markets Struggle – International Update

Rising rates and a stronger U.S. dollar are weighing on emerging markets, which benefited from years of record low U.S. interest rates. Elevated rates in the U.S. make emerging market assets less attractive than U.S. assets and influence investment overseas to migrate back to the U.S. marketplace.

Currencies from emerging countries including Brazil, South Africa, South Korea, Argentina, and China have all seen pullbacks relative to the U.S. dollar. Many believe that a weaker Chinese currency is a strategy to retaliate against the newly imposed U.S. tariffs. Any continuation of a weakening Chinese currency could amplify risks and volatility for emerging markets.

Trade tensions have also negatively affected China’s stock market, with the Shanghai Composite index down over 13% year to date. Worrisome for China is the fact that the Chinese currency and stock market have both headed negative for the year, a gauge for other Asian currencies and equity markets. (Sources: U.S. Treasury, Bloomberg, IMF)