Market Commentary & Investment Perspective July 2018
Market Update
(all values as of 04.30.2024)

Stock Indices:

Dow Jones 37,815
S&P 500 5,035
Nasdaq 15,657

Bond Sector Yields:

2 Yr Treasury 5.04%
10 Yr Treasury 4.69%
10 Yr Municipal 2.80%
High Yield 7.99%

YTD Market Returns:

Dow Jones 0.34%
S&P 500 5.57%
Nasdaq 4.31%
MSCI-EAFE 1.98%
MSCI-Europe 2.05%
MSCI-Pacific 1.82%
MSCI-Emg Mkt 2.17%
 
US Agg Bond 0.50%
US Corp Bond 0.56%
US Gov’t Bond 0.48%

Commodity Prices:

Gold 2,297
Silver 26.58
Oil (WTI) 81.13

Currencies:

Dollar / Euro 1.07
Dollar / Pound 1.25
Yen / Dollar 156.66
Canadian /Dollar 0.79
 

Macro Overview

Trade and tariffs disrupted markets in June as the U.S. Commerce Department announced tariffs on $250 billion worth of Chinese imports. The 25% tariffs will be imposed on 1,300 items encompassing a variety of products including aluminum, iron, gas turbines, snow blowers, milking machines, and dental drills.

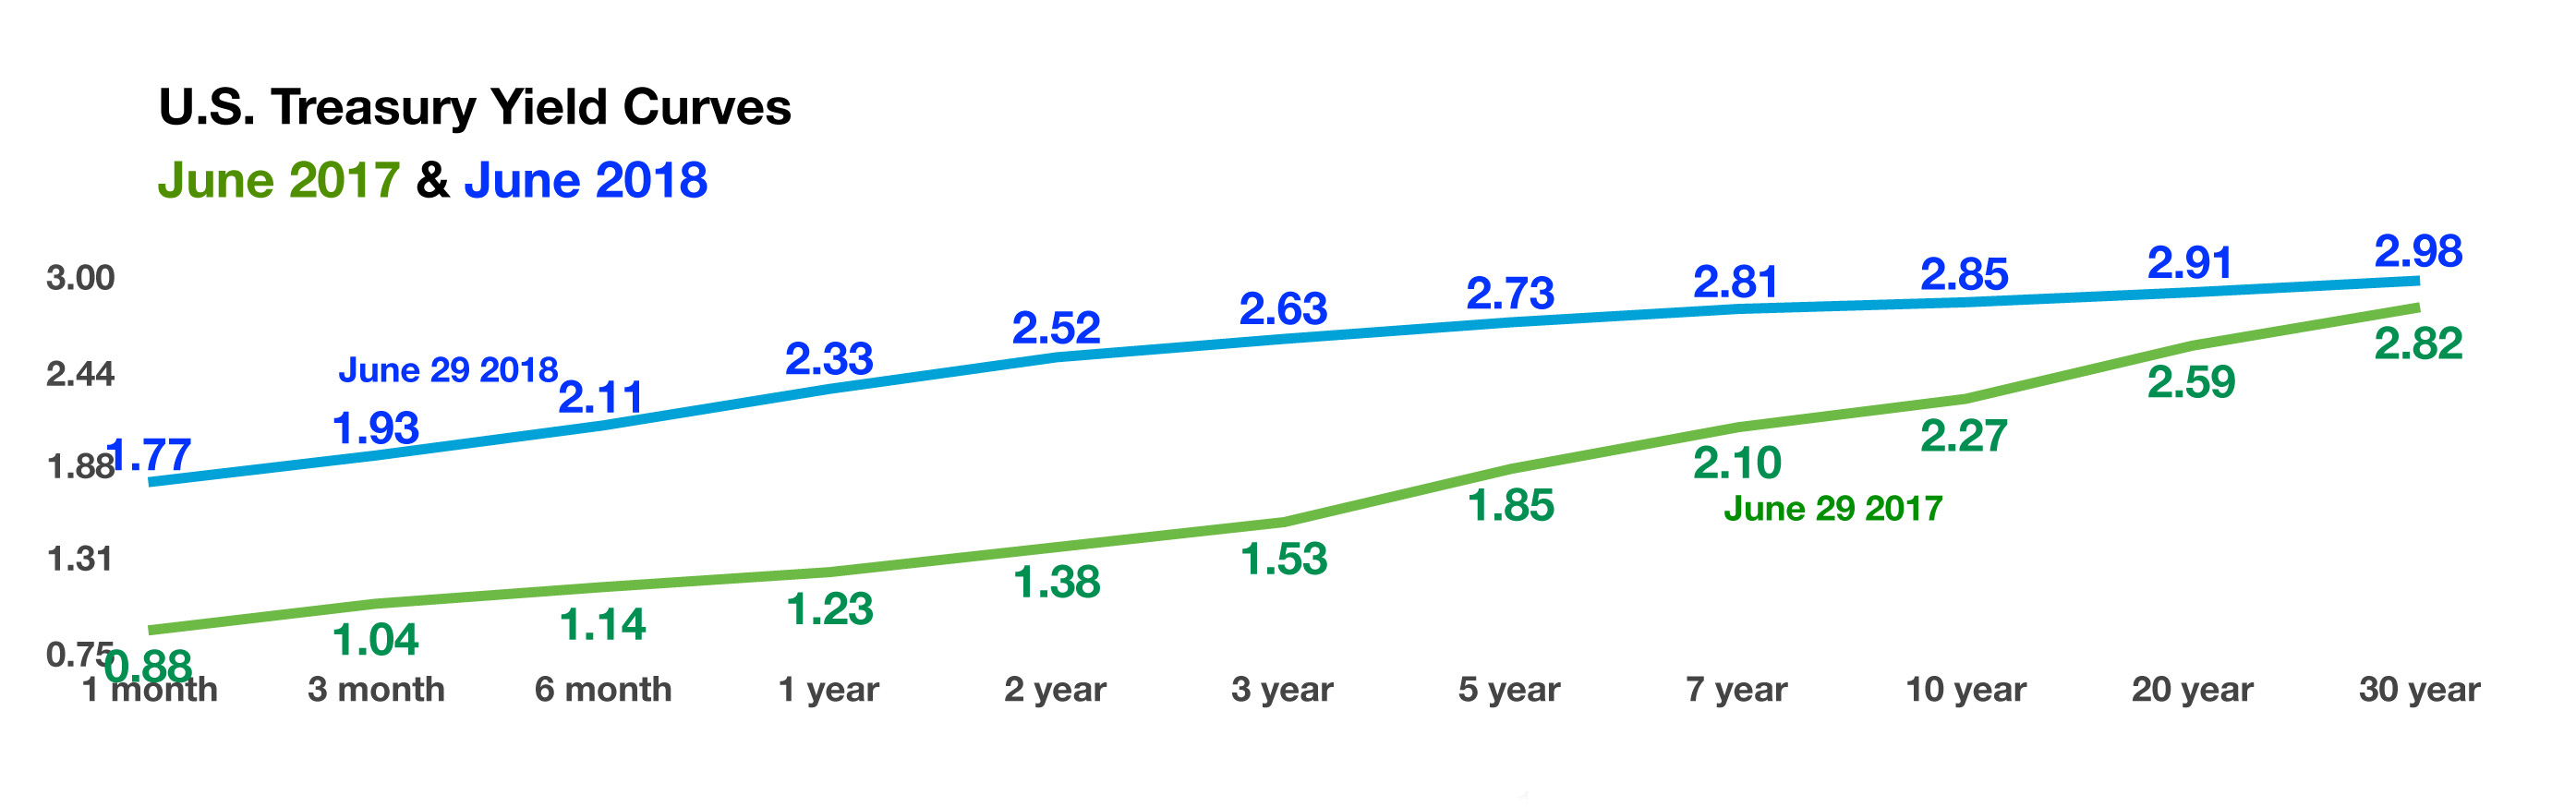
A flattening yield curve, characteristic of rising short-term rates along with lingering long-term rates, startled fixed income markets. Higher interest rates reflect expectations of inflationary pressures and robust growth, while lower rates imply less inflation and dismal economic expansion. As expected by economists and the markets, the Federal Reserve raised its short-term key policy rate, the federal funds rate, by 25 basis points to 1.75% – 2.00%. The gradual rise in rates is seen as a normalization of interest rates as the U.S. economy continues to expand. The Fed is accelerating the rate of tightening with increases slated for 2019 and 2020 now expected to occur in 2018 and 2019.

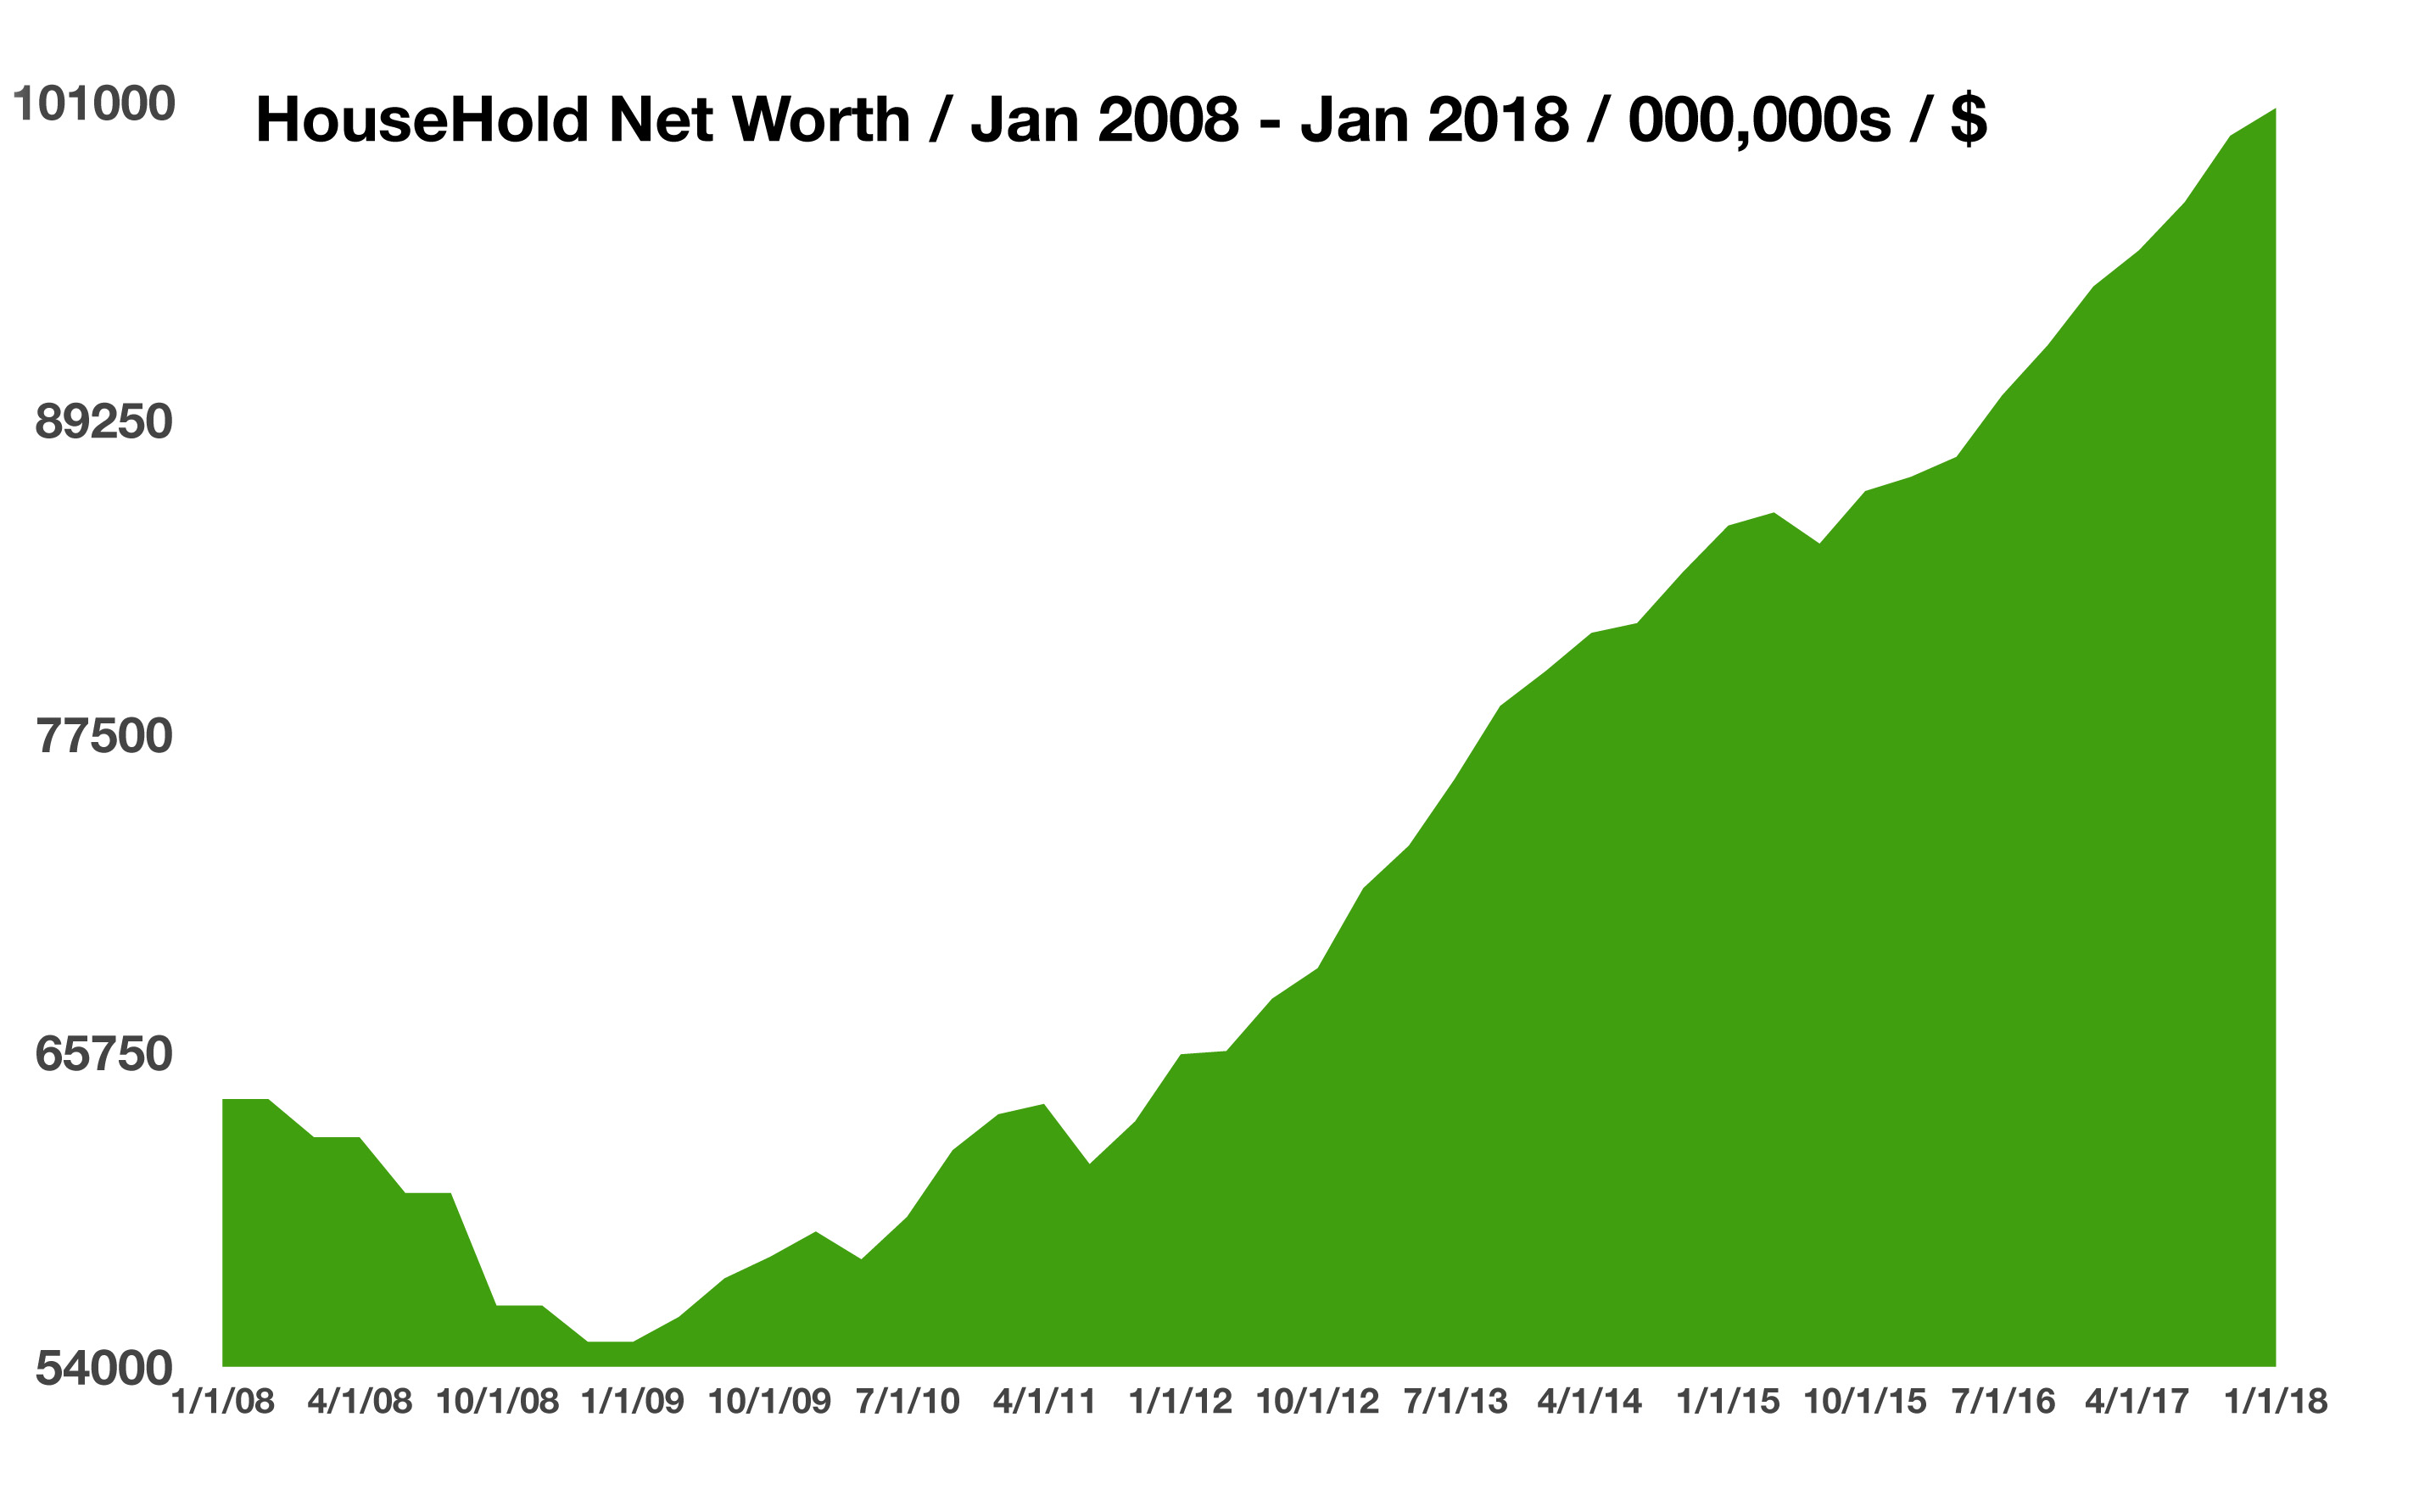
Reports from various Federal Reserve district banks reveal that a robust economy, growing tariff pressures, rising wage costs, and a tight labor market are contributing to consumer inflation. The Atlanta Federal Reserve’s economic growth model, GDPNow, estimates GDP growth for the second quarter of 2018 at 4.5%, adding to inflationary pressures. The Fed also reported that household wealth reached $100 trillion for the first time ever, double of where household wealth was at the lows of the financial crisis in 2009.

Volatility in the second quarter didn’t deter Equity Indices, as the S&P 500 was up 2.9% and the Dow Jones was up 0.7%. The tech heavy Nasdaq advanced 6.3% for the quarter, driven by buyers seeking shelter from the imposed tariffs. A stronger U.S. dollar is starting to weigh on the technology sector as earnings may become affected.  Energy and technology sector stocks led the markets in the second quarter. All three major indices ended the quarter positively, in light of volatility and trade policy tensions. The S&P 500 was up 2.9% and the Dow Jones was up 0.7%.

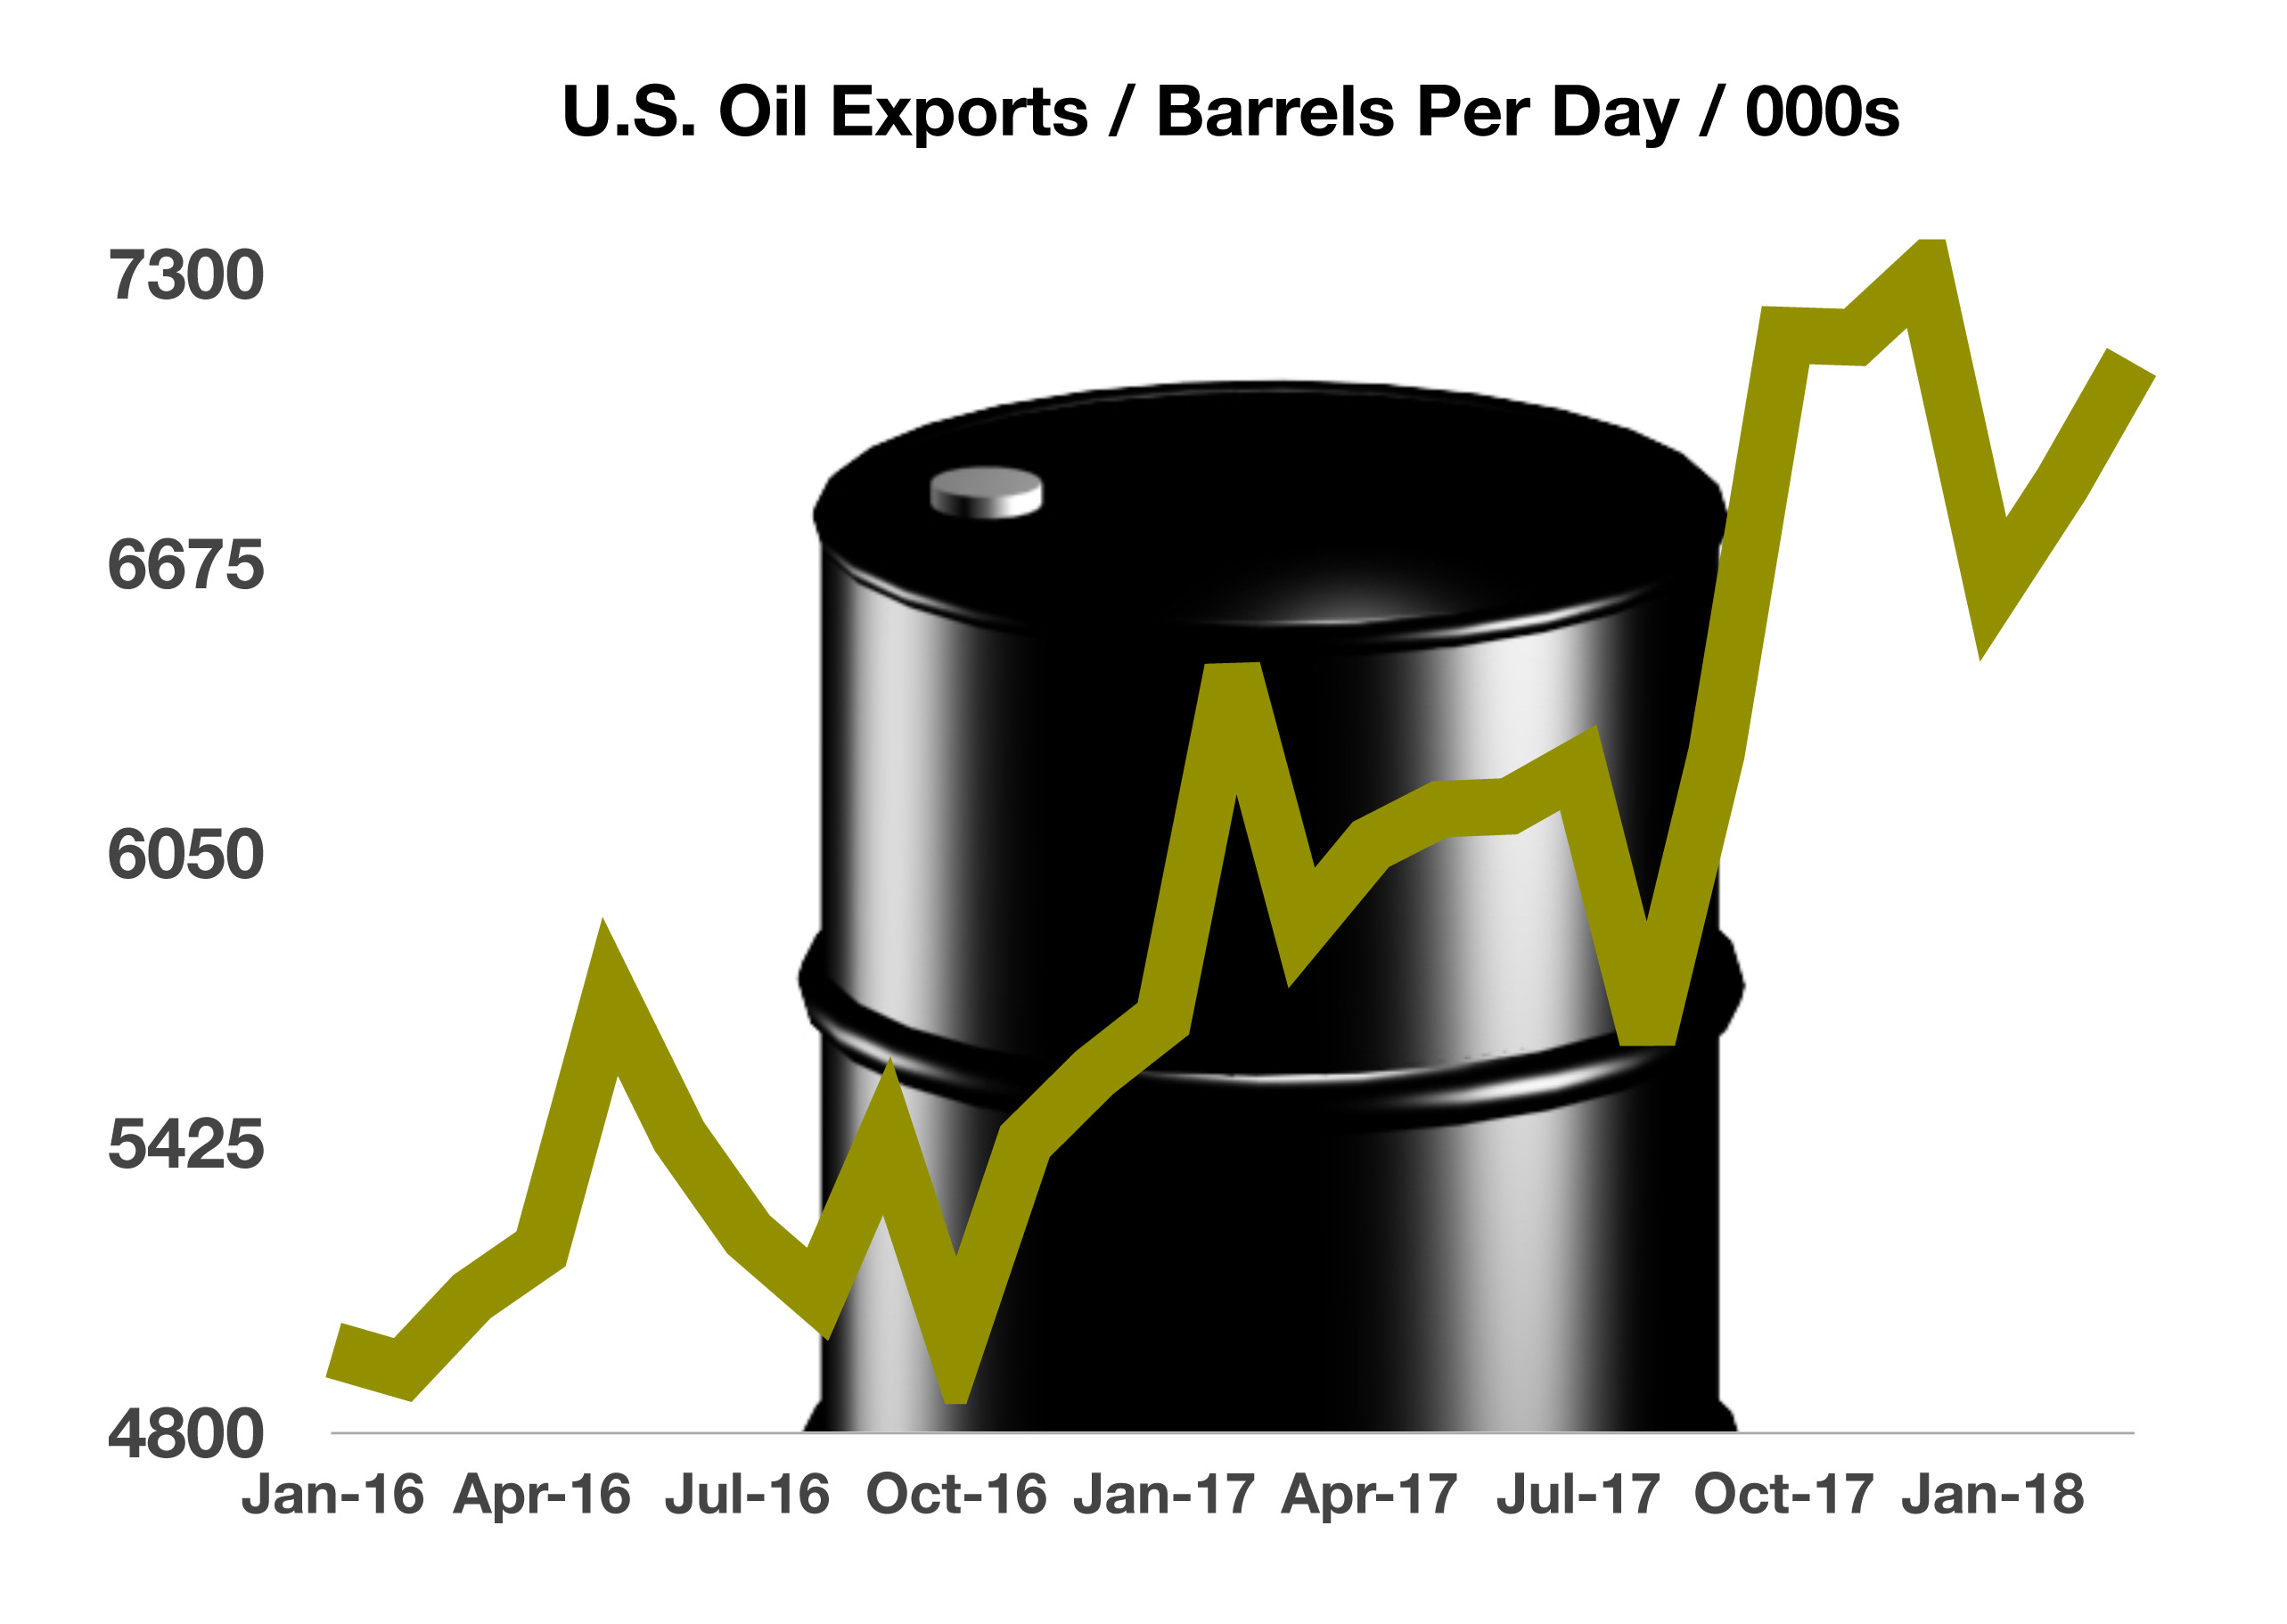
With oil prices climbing, the energy sector was the market’s top performer for the second quarter, marking its single largest quarterly gain since 2011. Technology sector stocks were also up for the quarter as the sector dodged the tariff turmoil during most of the second quarter, but may be adversely affected by a continuing strengthening dollar. US intellectual property and the growing prominence of technology in the global economy is becoming fore front for regulators, as the administration focuses on protecting U.S. intellectual assets.  (Sources: U.S. Commerce Dept., Federal Reserve, U.S. Treasury, https://www.supremecourt.gov, Bloomberg, S&P, Dow Jones, Nasdaq)

 
What does it mean?

Flattening Yield Curve Startles Markets – Domestic Fixed Income Update

The rapid rise of short-term rates along with lingering long-term rates created unease with markets. A lack of rising long-term rates is indicative of weak long-term economic growth, where inflationary pressures may not be present or expanding.

The continued increase in the 2-year Treasury yield is drawing interest from short-term investors as the 2.52 % yield at the end of June was greater than the 1.84% yield on the S&P 500.

The difference in yield between the 2-year Treasury note and the 10-year Treasury bond narrowed to levels not seen since 2007. Also known as the spread, the difference between the 2-year note and 10-year bond is a barometer of economic sentiment. Should shorter term rates, such as the 2-year note, yield more than longer term rates such as the 10-year bond, then economic growth is expected to be lackluster. Some analysts view this narrow spread as a temporary event until economic growth accelerates driving longer term rates higher.

According to the July 8, 2018 Wall Street Journal, some Fed officials have said the current spread isn’t as reliable an indicator of future growth [as it once was] because large-scale bond purchases by the Fed, ECB and BOJ in recent years (QE or Quantitative Easing)- designed to spur economic growth by forcing investors to buy stocks and other riskier assets – have depressed long-term bond yields.

This so-called term premium has been slightly negative in recent years, [and that] “may temper the conclusions drawn about the historical relationship between an inverted yield curve and recession”, according to Fed governor Lael Brainard.  Her willingness to consider alternate explanations for a narrowing spread is noteworthy because last year she was one of the leading voices for caution in raising rates, citing stubborn soft inflation.  Those concerns have faded this year with inflation returning to the Fed’s 2% target.

Research done last month by Fed staff economists said a more reliable gauge of market-derived recession probabilities can be found by comparing the difference between the yields on short-term Treasury bills and the yield implied by futures markets for the same bills some six quarters later.  This measure hasn’t flattened in recent years and implied a low probability of recessionSources: (U.S. Treasury, S&P, Bloomberg, The Wall Street Journal)

 
Domestic Economy & Looking Ahead

Household Net Worth Exceeds $100 Trillion – Domestic Economy

Every quarter the Federal Reserve releases its flow of funds survey, a report measuring
the net worth of households. The report includes a “balance sheet” of assets such as real
estate, financial assets, bank accounts, as well as outstanding debt.

The net worth of U.S. households and nonprofit organizations rose in the first quarter of
2018 to $100.7 trillion, making it the highest on record. Rising home prices in addition to
an increase in the equity markets has helped propel household net worth.

Real estate makes up the single largest component of household wealth, representing
about 30%. Corporate equities (individual stocks) make up another 15% of net worth.
The components making up household wealth fluctuate in value and are affected by
different factors, including monetary and fiscal policy. All in all, a rise in the overall
value of these assets is of benefit to economic well-being.

Some economists that follow consumer behavior believe that increases in wealth could
make consumers feel more comfortable spending their money, thus contributing to
economic growth.  (Source: Federal Reserve)

Looking Ahead

Economic Fundamentals indicate that KCG portfolios are well positioned in Cyclical Sectors that benefit from nominal (inflationary) rather than real growth.  We have maintained an overweight position in Technology and Materials, and are recommending moving toward market-weight holdings in Energy.    The Industrials Sector and International asset allocations appear to be hardest hit by the tariff talk.  Irregular indications of an anticipated correction persist.  KCG continues to hold a wait and see posture in the International and Emerging Market arenas while seeking an opportunistic entry point for Industrials.

 
The Three Big Things

Profit
Markets are attempting to decipher what industry and companies may be hindered by the newly imposed tariffs. Some companies plan to absorb a portion of the tariffs while others will pass along the costs in the form of higher prices to customers.  Higher Inflation is also characteristic of the late-cycle environment.  It has taken longer than historically normal to reach today’s inflationary constraints because of the elongation of market and profit cycles due to the effects of Quantitative Easing.  Labor markets have become tight and longer vendor delivery times reflect demand is greater than supply.  We are beginning to see wage inflation and immigration seems unlikely to alleviate the labor shortage.

Liquidity
Because product markets are already tight, tariffs’ impeding the flow of good could worsen the existing supply shortages and delivery times.
Cash is always King, but especially in a tightening economy.  Those with significant cash holdings will have an advantage over companies with high debt [to equity]. Liquidity among S&P 500 companies is distributed unevenly, with the top 25 companies in the index accounting for over 55% of the $1.9 trillion in corporate cash. The bottom 250 companies in the S&P 500 hold essentially no cash.

Energy markets are also tight.  According to Cornerstone Analytics, OPEC does not have enough spare capacity to make up for a full reduction in Iranian exports and non-OPEC production is running at nearly full capacity.  This bodes well for U.S. oil exports while gas price increases so far have equated to a relatively small portion of wages.

With dollar strength negatively impacting our international investments, we recently added the iShares Currency Hedged All Country World Index ETF (HACW) to our global holdings with positive outcomes thus far.

Sentiment
Upon completing a thorough attribution analysis of our current Emerging Market holdings, we have acted to eliminate all EM allocations outside of the Asia Pacific region.  The geo-politics of South Africa and the Middle East are negatively impacting sectors including financials and telecom for more than Trade or Tariff talks.  While Asia Pacific is being hit affected by the tariffs, China is feeling pressure to find a resolution sooner rather than later.  As long as fundamentals remain strong, we are committed to riding out the volatility.

While we do not hesitate to point out market and economic implications of public policy, our attention is strictly centered on the investment implications of policy.  We, as investors, must remain unbiased and objective when evaluating investment choices.  KCG remains committed to target-weighted, well-diversified  allocations.  Our portfolios include small allotments to zero and low correlated alternative strategies with the potential of additional return but intended to conserve the value of our portfolios in the long run.