Fortis Wealth Management

(888) 336-7847 (3FORTIS)

www.investfortis.com

July 2022
Market Update
(all values as of 04.30.2024)

Stock Indices:

Dow Jones 37,815
S&P 500 5,035
Nasdaq 15,657

Bond Sector Yields:

2 Yr Treasury 5.04%
10 Yr Treasury 4.69%
10 Yr Municipal 2.80%
High Yield 7.99%

YTD Market Returns:

Dow Jones 0.34%
S&P 500 5.57%
Nasdaq 4.31%
MSCI-EAFE 1.98%
MSCI-Europe 2.05%
MSCI-Pacific 1.82%
MSCI-Emg Mkt 2.17%
 
US Agg Bond 0.50%
US Corp Bond 0.56%
US Gov’t Bond 0.48%

Commodity Prices:

Gold 2,297
Silver 26.58
Oil (WTI) 81.13

Currencies:

Dollar / Euro 1.07
Dollar / Pound 1.25
Yen / Dollar 156.66
Canadian /Dollar 0.79
 

Macro Overview

Attention shifted from inflation to potential recession as housing, wages, interest rates, commodities, and consumer expenditures receded from their highs, an indication to economists that an economic slowdown or recession may be evolving.

Numerous countries worldwide are restricting the export of food, adding to global supply constraints already causing shortages and hunger in various third-world countries. Such restrictions, which have been exacerbated by the invasion of Ukraine, are considered a form of food protectionism.

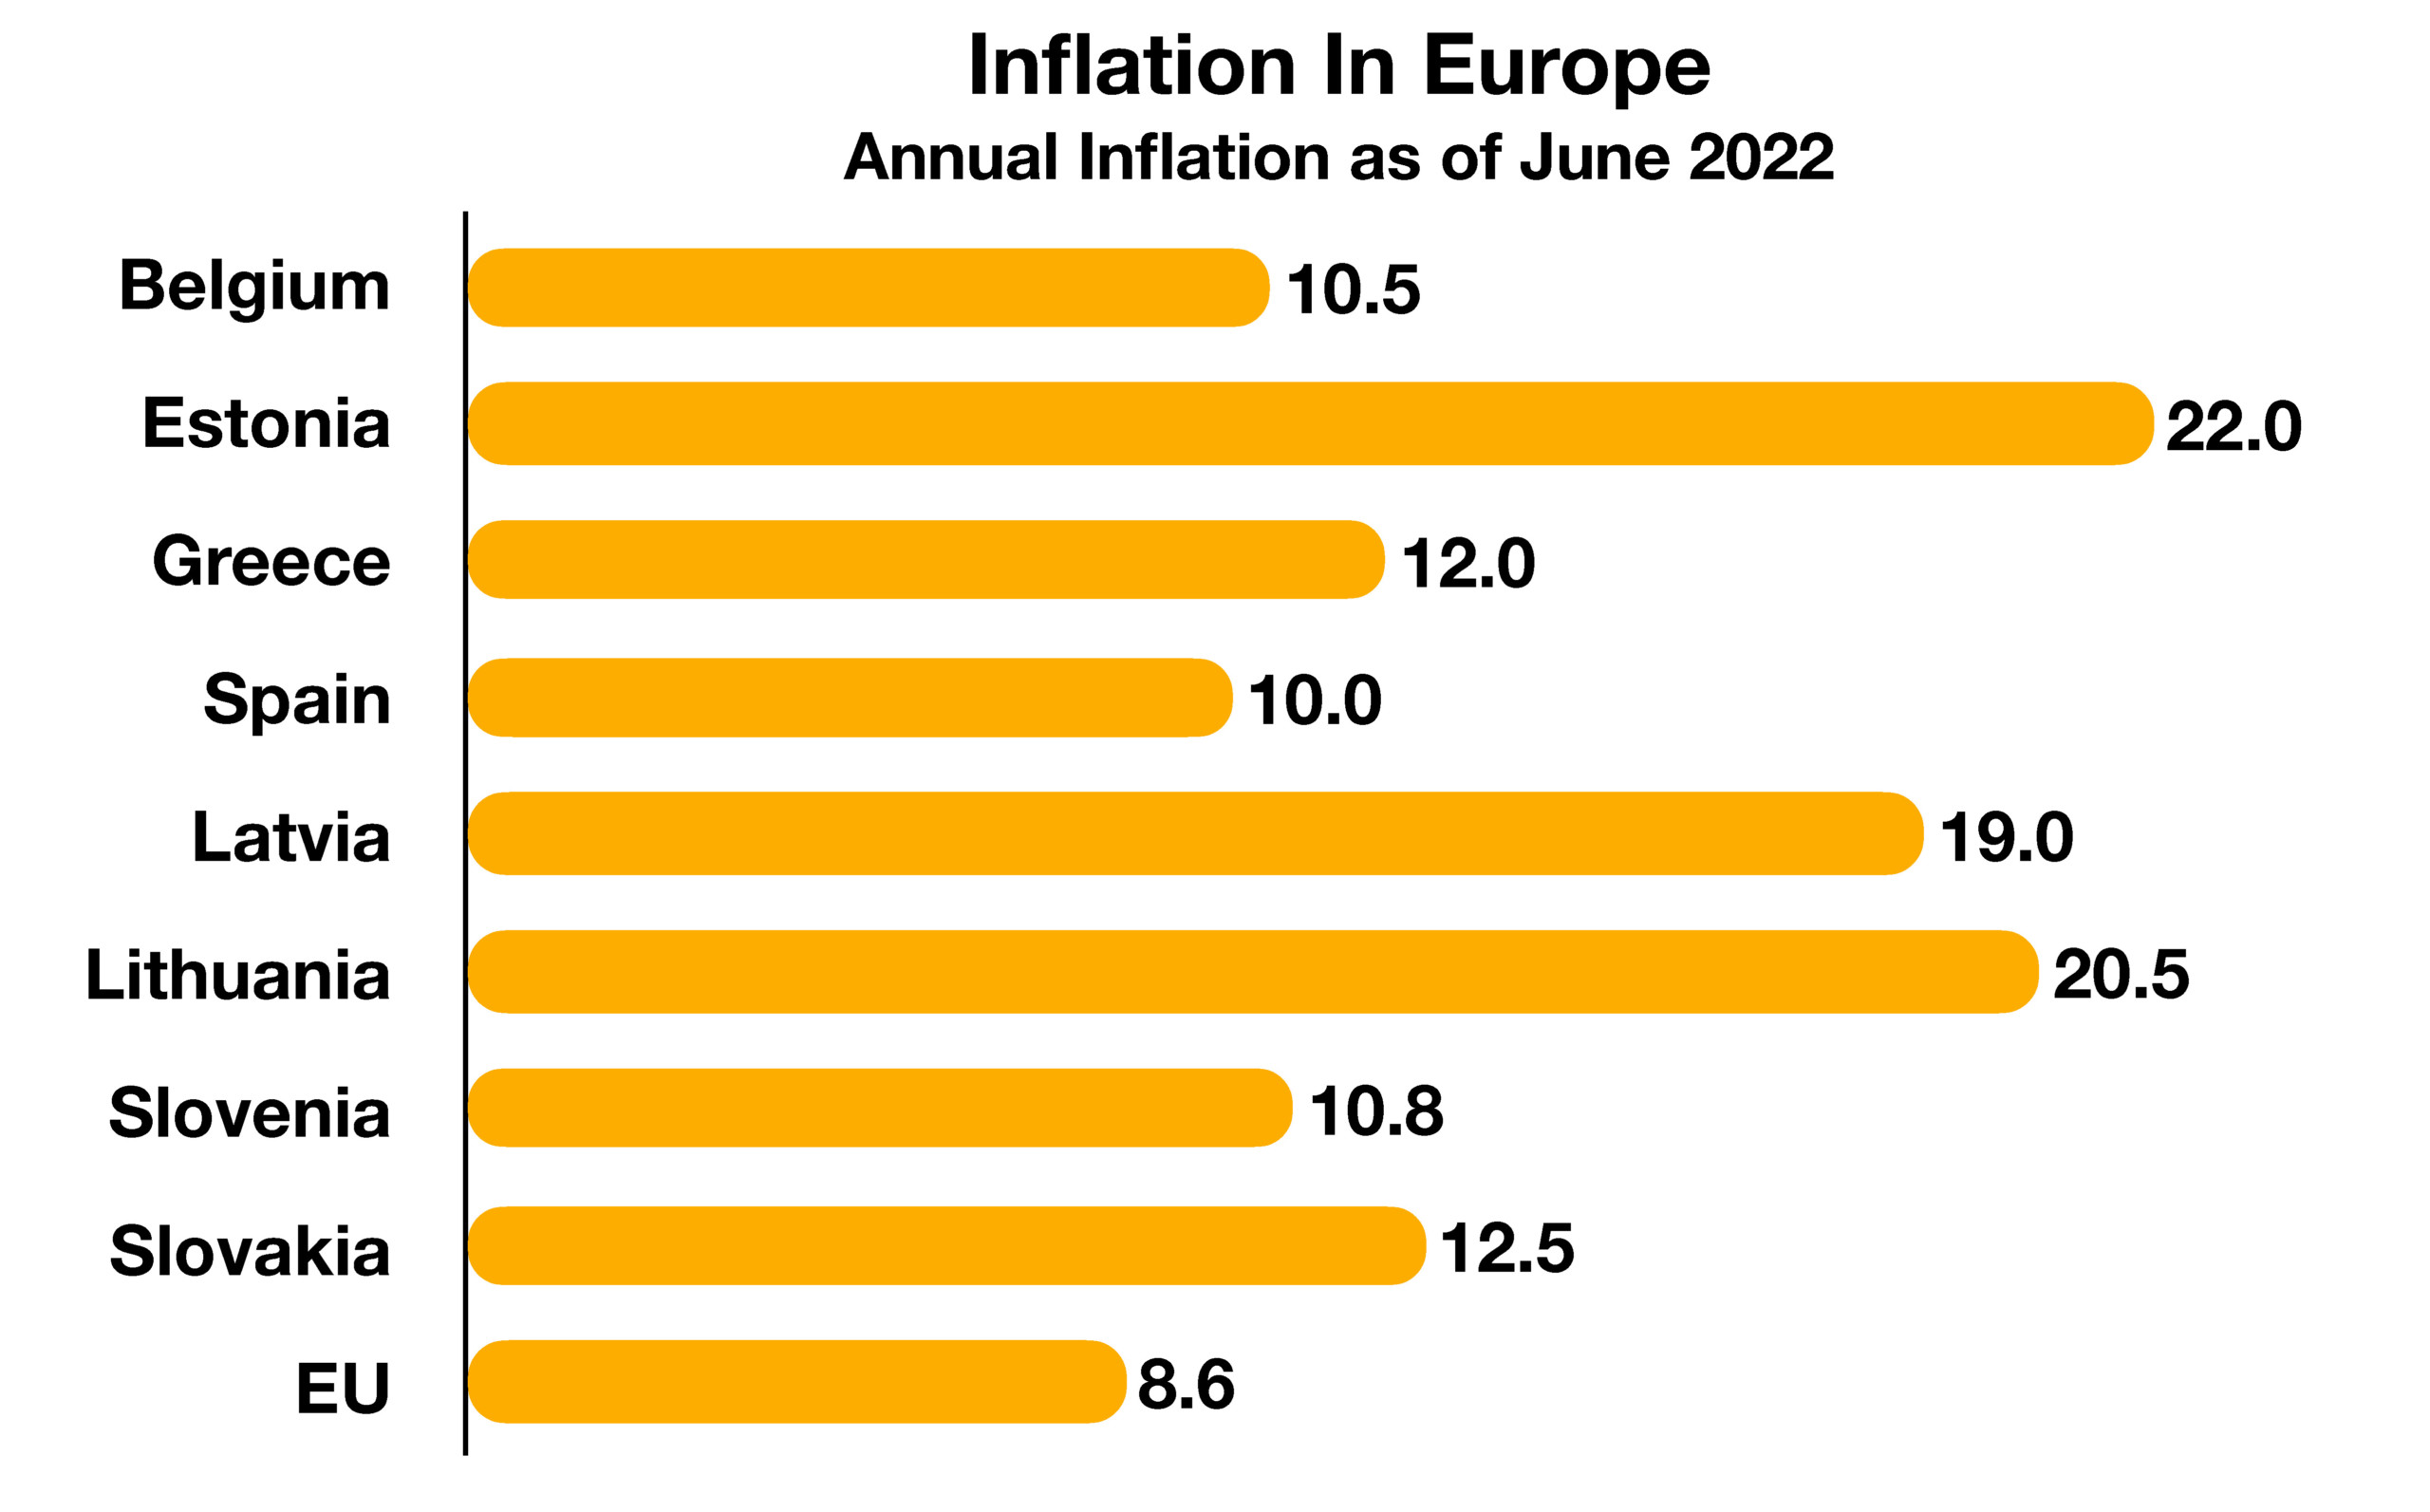
The EU imposed a partial ban on crude oil imports from Russia in response to the invasion of Ukraine. With energy prices already soaring in Europe, the ban is expected to cause further inflationary pressures throughout the European region.

Equity indices saw their worst first half-year returns in decades, with the Dow Jones, S&P 500, and Nasdaq averages all posting negative returns. Elevated labor and material costs, recessionary concerns, and faltering consumer sentiment drove downward momentum.

The Federal Reserve Bank of Atlanta estimates Gross Domestic Product (GDP) with a model it has utilized for years, with a very low average tracking error of just -0.3. The model, known as GDPNow, estimates GDP for the second quarter of 2022 at negative 2.1%, following a negative 1st quarter GDP of 1.6%. Many economists consider two consecutive quarters of negative GDP as indicators of a recessionary environment. Fed Chairman Jerome Powell noted that the risk of a recession is heightened as interest rates move higher, stating that a recession is not the Fed’s “intended outcome”, but that it is “certainly a possibility.”

Signs of stabilizing inflationary pressures are visible in the commodities market, where copper, oil, wheat, rice, and lumber fell from their highs over the past month. Lower commodity prices tend to alleviate some expenses and inflation for consumers.

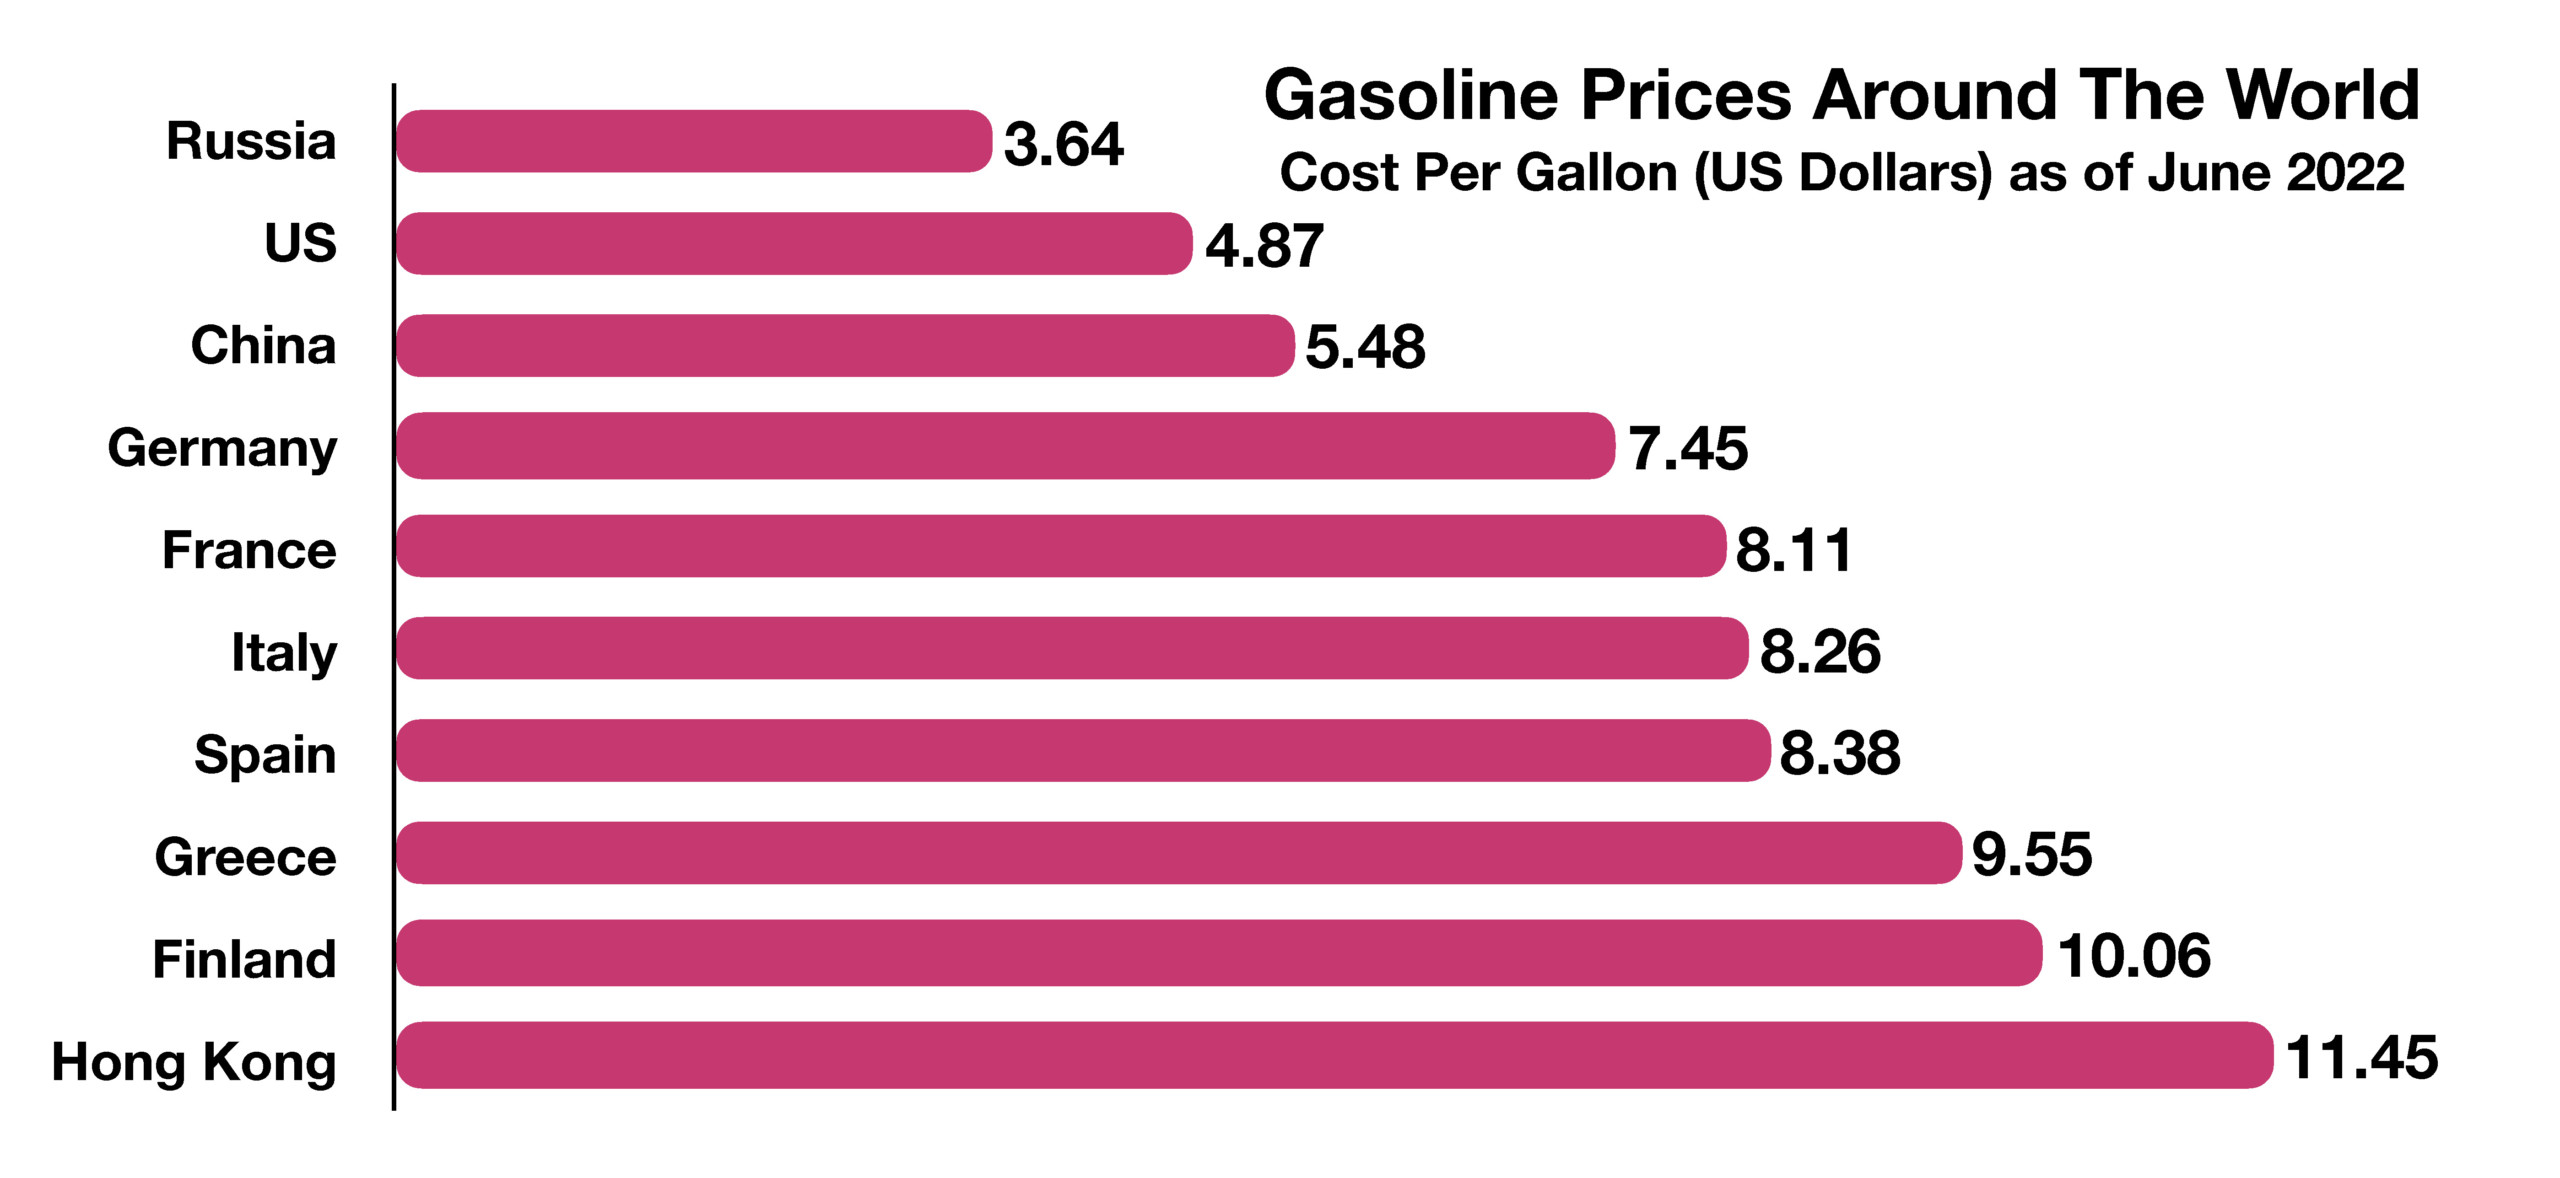
Gasoline prices eased slightly over the past month, with the national average for a gallon of regular gasoline falling to $4.87 at the end of June, down from $5.00 earlier in the month. As expensive as gasoline seems, gasoline prices are much higher in some other countries, including in Hong Kong where consumers are paying upwards of $11 per gallon.(Sources: The Federal Reserve Bank of Atlanta, EuroStat, Dept. of Energy, S&P, UN World Food Programme)


the Dow Jones Index suffered its worst six months since 1962

Equity Indices Have a Rough First Half – Domestic Equity Overview

Equity indices had a difficult first half of the year, their worst in decades. The S&P 500 Index had its worst first half in over five decades, the Dow Jones Index suffered its worst six months since 1962, and the Nasdaq had its worst first six months ever.

Energy was the only positive sector in the S&P 500 for the first six months, while the other ten sectors including health care, financials, communications, and real estate were negative. Consumer discretionary and technology sector stocks were among the worst-performing sectors, with consumer staple stocks among the better performers.

Second-quarter earnings, due for release in July, are expected to reveal how company profits fared with exceptionally elevated material and labor costs earlier in the year. Analysts are sensitive to a growing consensus expecting a recessionary environment before the end of the year.

Sources: Bloomberg, S&P, Reuters, Dow Jones

Yields Hold Steady Until Fed Decides – Fixed Income Update

The yield on the 2-year Treasury bond fell to 2.84% on July 1st, the biggest drop since March 2020. Yields on the 5, 10, and 30-year Treasury bonds also fell, indicative of deflationary trends.

Many analysts expect the Fed to raise short-term rates at least once more by 75bps in July, with a possible pause thereafter. Some are projecting that the Fed may reverse course and start easing rates in 2023, should the economy fall into a recession. (Sources: Treasury Dept., Federal Reserve)

What is ESG – Socially Conscience Investing – Part 1 of a 3 Part Series

As an investor, deciding which companies to invest in can be daunting. ESG investing may influence financial choices, but what really is it? Firstly, ESG stands for Environmental, Social, and Governance. These are three aspects that many institutional and individual investors now consider. ESG investing is the financial philosophy wherein investors inspect these non-traditional considerations, an approach that has seen increasing popularity in recent years.

Environmental, social, and governance (ESG) considerations are focal points for many companies, analysts, and investors. The evolution of ESG created a growing awareness among the public about how companies formulate criteria for socially conscious decisions.

For decades, analysts and financial advisors assessed how well companies performed by their earnings and revenue. ESG investing injects a subjective, non-traditional metric into how well companies are managed for the future impact of the environment and social consciousness.

Recent global events, including the invasion of Ukraine by Russia and climate trends, have prompted governments in Europe, Asia, and the U.S. to re-examine energy initiatives and mandates for corporations. Companies today are measured, in part, by how they apply ESG considerations to their business models and operations. As a result, asset managers, mutual funds, ETFs, and advisors introduced portfolios and screening methods that identify which companies are implementing and adhering to ESG guidelines.

 
inflation rate of 7.6% for the CPI-E is lower than the 8.6% rate for the CPI

High Earners Hold Most Savings On Hand – Consumer Behavior

Consumers are saving less now than before the pandemic, as stimulus assistance funds and generous unemployment benefits gradually evaporated, encouraging consumers to tap their savings at an accelerating pace. The drop in savings has been particularly notable for those nearing retirement. As markets pulled back, so did retirement fund values, extending the required retirement savings timeline for many.

Savings rates rose dramatically in 2020 as billions of dollars in stimulus relief payments
made their way into consumer accounts. Federal Reserve data found that households
spent only 40 percent of their stimulus payments, used 30 percent to pay down debt, and saved
about 30 percent on the initial round of stimulus payments. The spectacular rise in the U.S.
savings rate to nearly 34 percent in April 2020 confirmed this assessment.

As additional relief programs and generous unemployment benefits went into effect, the savings rate remained elevated through the end of 2021. The most recent data show that the savings rate dropped to 5.4 percent in May 2022, lower than where it stood at roughly 7.5 percent before the pandemic began.

A Fed analysis found that lower-income households tend to spend most or all of their income and have very little disposable income by the end of each month. Most lower-income households depleted their pandemic surplus funds and were squeezed by inflation as food and energy prices rose. (Source: U.S. Bureau of Economic Analysis, St. Louis Federal Reserve Bank, Marginal Propensity to Consume Working Paper; Federal Reserve Bank of Boston)

Inflation Is Different For Those Over Age 62 – Retirement Planning

Data compiled by the government via the Bureau of Labor Statistics (BLS) maintains a separate tally of inflation for people over 62. The resulting index, known as the CPI-E (the E stands for “elderly”), is a variation of the traditional CPI (Consumer Price Index), but with an emphasis on goods and services mostly used by those over 62 years of age. This past month, the recent releases of the CPI-E and the CPI revealed an inflation rate of 7.6% for the CPI-E versus an 8.6% rate for the traditional CPI over the past year.

The CPI-E assigns greater weight to expenses such as medical services and housing, and a lesser weight to education and transportation. The index was first created in 1987 when Congress directed the BLS to identify inflationary pressures among senior citizens. The index currently represents roughly 25% of all U.S. consumers. (Source: BLS)


Estonia and Lithuania have seen inflation exceed 20%

Falling Labor Productivity – Labor Market Overview

The most recent data released by the Labor Department revealed the largest quarterly drop in productivity since 1947, decreasing at an annualized rate of 7.5%. The drop in productivity was concurrent with the largest rise in labor costs since 1982. Both of these measures are indicators of inflationary pressures for both companies and consumers. Many companies pass along higher costs to consumers, but are constrained by competition that often forces companies to hold prices steady and absorb higher costs. This can lead to decreased levels of hiring and lower wages as companies struggle to maintain profitability levels.

Data regarding labor during the pandemic was widely considered unreliable and inconsistent by many economists, meaning that the true effects of the COVID-19 pandemic on wages and worker retention are not entirely clear. An essential data set is labor productivity, which is a measure of how efficiently companies are utilizing workers to produce products and services. This past month, the Bureau of Labor Statistics observed the largest fourth quarter drop in labor productivity since 1993, marking a historic decline.

Federal Reserve survey results, reported in the Fed’s Beige Book, identified that a growing number of manufacturers and industrial companies are increasingly moving towards automation, replacing workers with robotic gear. Rising wages and a dwindling labor pool forced many companies to accelerate automation efforts. (Sources: Labor Department, Federal Reserve Beige Book; https://www.federalreserve.gov/monetarypolicy/files/BeigeBook_20220601)

Inflation Varies From Country To Country In Europe – European Inflation

A tremendous surge in inflation affected European countries, in part as a result of the Russian invasion of Ukraine. Essential energy and food products that have for years been imported from Russia and Ukraine elevated overall prices throughout Europe. Energy-related products have risen roughly 42% in the past year, hindering economic growth and consumer sentiment in the 27-member European Union (EU).

Overall inflation for the 27 countries that comprise the EU rose 8.6% in the past year, essentially identical to the inflation rate in the United States. The Harmonised Index of Consumer Prices, which measures inflation in the EU, saw the EU’s inflation rate reach its all-time high in May of this year at 8.8%. This figure is more than four times the EU’s average inflation rate from 2000 to 2022, which was at a stable 2.03% and even reached lows of -0.6% in 2015. Inflation is exceptionally harsh for Estonia and Lithuania, where inflation exceeded 20%. Supply constraints, energy costs, and imported foods have been among the primary drivers of inflation in the EU.

Source: Eurostat; https://ec.europa.eu/eurostat/documents/2995521/14644614/2-01072022