W.P. "Bill" Atkinson, III

Certified Financial Planner TM / Attorney

Access Financial Resources, Inc.

3621 NW 63rd Street, Suite A1

Oklahoma City, OK  73116

(405) 848-9826

www.afradvice.com / bill@apaplans.com

July 2022 Newsletter
Market Update
(all values as of 04.30.2024)

Stock Indices:

Dow Jones 37,815
S&P 500 5,035
Nasdaq 15,657

Bond Sector Yields:

2 Yr Treasury 5.04%
10 Yr Treasury 4.69%
10 Yr Municipal 2.80%
High Yield 7.99%

YTD Market Returns:

Dow Jones 0.34%
S&P 500 5.57%
Nasdaq 4.31%
MSCI-EAFE 1.98%
MSCI-Europe 2.05%
MSCI-Pacific 1.82%
MSCI-Emg Mkt 2.17%
 
US Agg Bond 0.50%
US Corp Bond 0.56%
US Gov’t Bond 0.48%

Commodity Prices:

Gold 2,297
Silver 26.58
Oil (WTI) 81.13

Currencies:

Dollar / Euro 1.07
Dollar / Pound 1.25
Yen / Dollar 156.66
Canadian /Dollar 0.79
 

Equity Indices Have a Rough First Half – Equity indices have had a difficult first half of the year, their worst in decades. The S&P 500 Index had its worst first half in over five decades, the Dow Jones Index suffered its worst six months since 1962, and the Nasdaq had its worst first six months ever. Energy was the only positive sector in the S&P 500 for the first six months, while the other ten sectors, including health care, financials, communications, and real estate, were negative. Consumer discretionary and technology sector stocks were among the worst-performing sectors, with consumer staple stocks among the better performers. Second-quarter earnings, due for release in July, are expected to reveal how company profits fared with exceptionally elevated material and labor costs earlier in the year. Analysts are also sensitive to a growing consensus expecting a recessionary environment before the end of the year. On the fixed side, the yield on the 2-year Treasury bond fell to 2.84% on July 1st, the biggest drop since March 2020. Yields on the 5, 10, and 30-year Treasury bonds also fell, indicative of deflationary trends. Many analysts expect the Fed to raise short-term rates at least once more by 75bps in July, with a possible pause thereafter. Some are even projecting the Fed to reverse course and start easing rates in 2023 should the economy fall into a recession. (Sources: Bloomberg, S&P, Reuters, Dow Jones, Treasury Dept., Federal Reserve)

What’s Risen the Most – Tracking Inflation 
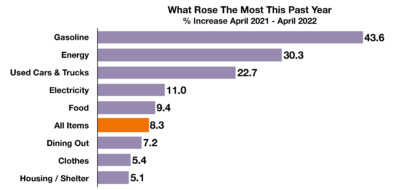
– With higher gas prices, I would not look to gas stations for any breaks. According to a recent article at the American Institute for Economic Research: “most gas stations earn a pittance from, or actually lose money, selling gasoline alone. According to IBISWorld, whereas the average US business has a profit margin of just under 8 percent (7.7 percent), the average gas station scrapes by at less than a quarter of that: 1.4 percent. At $5.34 per gallon, the average national price of gasoline over the Independence Day weekend, a 1.7 percent profit would come to $0.09 cents a gallon. The Hustle estimates that after overhead (labor, utilities, insurance, credit card transaction fees, and so on), a gas station owner receives on the order of five to seven cents per gallon. Even selling a few thousand gallons of gasoline per day would only generate a few hundred dollars free and clear to the owner. Franchise City estimates that $50 spent at the gas pump goes $30.75 to the oil company, $7.00 to refineries, $4.00 to the delivery company, $1.25 on processing and transaction fees, and finally right at the end of the chain you get $1.00. And that number can and does change, sometimes even lower, most owners [make] average [profit] of 1 to 3 cents net per gallon.” 

Compare that with the Federal government making $.18 (3.4%) per gallon, and some state governments make much more, like Pennsylvania ($0.57 per gallon), California ($0.51 per gallon), Washington ($0.49 per gallon), New Jersey ($0.42 per gallon), and Illinois ($0.39 cents per gallon). (Sources:  EIA, BLS, Labor Dept.The Federal Reserve Bank of Atlanta, EuroStat, Dept. of Energy, S&P, UN World Food Programme, AIER – Leave the Gas Station Owners Out of It | AIER)


Savings and Inflation

Upper Earners Hold Most Savings On Hand

Consumers are now saving less than before the pandemic, as stimulus assistance funds and generous unemployment benefits have gradually evaporated, encouraging consumers to tap their savings at an accelerating pace. The drop in savings has been especially prolific for those nearing retirement. As markets have pulled back, so have retirement fund values, elongating the retirement threshold for many.

Savings rates rose dramatically in 2020 as billions of dollars in stimulus relief payments made their way into consumer accounts. Federal Reserve data found that households spent only 40 percent of their payments, used 30 percent to pay down debt, and saved about 30 percent on the initial round of stimulus payments. The spectacular rise in the savings rate to nearly 34 percent in April 2020 was a validation of how much of the payments went towards savings.

As additional relief programs along with generous unemployment benefits became effective, the savings rate remained elevated through the end of 2021. The most recent data show that the savings rate dropped to 5.4 percent in May 2022, lower than where it stood at roughly 7.5 percent before the pandemic began.

A Fed analysis found that lower-income households tend to spend most if not all of their income and end up having very little disposable income at the end of each month. Most lower-income households have already depleted their pandemic surplus funds in savings and are also being squeezed by inflation as food and energy prices continue to escalate. This has led to upper-income earners holding the most savings on hand, while lower-income savings begin to dwindle. (Source: U.S. Bureau of Economic Analysis, St. Louis Federal Reserve Bank, Marginal Propensity to Consume Working Paper; Federal Reserve Bank of Boston)

Strengthening U.S. Dollar May Help Curtail Inflation

The U.S. dollar has risen over 12.73% since the beginning of the year, driven by increasing interest rates and a flight to safety for international investors.

A stronger dollar can also hinder certain U.S. companies with a large portion of their sales overseas. Should the dollar continue on its rising trend, economists and analysts believe that the run-up in the dollar will translate into lower earnings for several U.S. companies. Foreign investors tend to flock to the U.S. dollar as rates increase, seeking higher returns on idle cash and during periods of geopolitical turmoil.

A challenge that emerges for U.S. multinationals when the dollar rises is that the price of U.S. exports becomes more expensive worldwide. As the dollar increases in value versus other currencies, U.S. exported goods become less affordable in the international markets. Conversely, the strengthening dollar has also made imported goods into the United States more affordable, which become less expensive for American consumers as the dollar rises.

Sources: https://fred.stlouisfed.org/, Bloomberg, Commerce Department

 
Falling Labor Productivity / Supreme Court Ruling

What Falling Labor Productivity Means

The most recent data released by the Labor Department revealed the largest quarterly drop in productivity since 1947, decreasing at an annualized rate of 7.5%. The drop in productivity was concurrent with the largest rise in labor costs since 1982. Both of these measures are also indicators of inflationary pressures for both companies and consumers. Many companies have been passing along higher costs to consumers but can only do so for so long until competition forces companies to hold prices steady and absorb higher costs. This can also lead to decreased levels of hiring, and lower wages as companies struggle to maintain profitability levels.

Data surrounding labor during the pandemic has been considered unreliable and inconsistent by many economists, meaning that the true effects of the COVID-19 pandemic and worker retention are still not certain. An essential data set is labor productivity, which is a measure of how efficiently companies are utilizing workers to produce products and services. This past month, the largest fourth-quarter drop in labor productivity since 1993 was observed, according to the Bureau of Labor Statistics, marking a historic decline in productivity.

Federal Reserve survey results, reported in the Fed’s Beige Book, have identified that a growing number of manufacturers and industrial companies are increasingly moving towards automation, replacing previously desired workers with robotic gear. Rising wages and a dwindling labor pool have forced some companies to resort to machines instead of hiring workers. (Sources: Labor Department, Federal Reserve Beige Book; https://www.federalreserve.gov/monetarypolicy/files/BeigeBook_20220601)

Notable Supreme Court Ruling Impacting the Economy:

The United States Supreme Court recently ruled in West Virginia v. Environmental Protection Agency (EPA) ruled the agency overstepped its statutory authority in regulating emissions of carbon dioxide (CO2) from power plants. Chief Justice John Roberts, for the 6-3 majority decision, stated that “Capping carbon dioxide emissions at a level that will force a nationwide transition away from the use of coal to generate electricity may be a sensible ‘solution to the crisis of the day…but it is not plausible that Congress gave EPA the authority to adopt on its own such a regulatory scheme. A decision of such magnitude and consequence rests with Congress itself, or an agency acting pursuant to a clear delegation from that representative body.”

This ruling could very well impact the SEC’s attempt to regulate through its proposed ESG (environment, social, governance) rules and requirements. In fact, many are not happy about such upcoming requirements. Elon Musk stated that “Exxon is rated top ten best in [the] world for environment, social & governance (ESG) by S&P 500, while Tesla didn’t make the list! ESG is a scam. It has been weaponized by phony social justice warriors.” In any event, “Republican state officials, emboldened by [the] recent Supreme Court ruling, are already threatening to sue, claiming regulators don’t have the authority.” (Source: The Conversation, Heartland Institute)


RMD's and the SECURE ACT / Estate Planning

Required Minimum Distributions: You cannot keep retirement savings in your account indefinitely. Generally, when you reach the age of 70½, you should start withdrawing from your IRA, SIMPLE IRA, SEP IRA, or severance pay account. However, due to the recent revision of the SECURE Act, if your 70th birthday is after July 1, 2019, you do not need to withdraw until you are 72 years old. Roth IRAs do not require a withdrawal until after the owner’s death. So, the minimum distribution rules discussed below apply to: traditional IRAs, SEP IRAs, SIMPLE IRAs, 401(k) plans, 403(b) plans, 457(b) plans, profit-sharing plans, and other defined-contribution plans.

Required Minimum Distributions after the Account Owner Dies: For the year of the account owner’s death, use the RMD that the account owner would have received. However, for the year following the owner’s death, the RMD will depend on the identity of the designated beneficiary; and for owner accounts who die after December 31, 2019, the SECURE Act distinguishes between an “eligible designated beneficiary” and other beneficiaries who inherit an account or IRA. An eligible designated beneficiary includes a surviving spouse, a disabled individual, a chronically ill individual, a minor child, or an individual who is not more than ten years younger than the account owner. Certain trusts created for the exclusive benefit of disabled or chronically ill beneficiaries are included. These eligible designated beneficiaries may take their distributions over the beneficiary’s life expectancy. However, minor children must still take the remaining distributions within ten years of reaching age 18. Additionally, a surviving spouse beneficiary may delay the commencement of distributions until the later of the end of the year that the employee or IRA owner would have attained age 72 or the surviving spouse’s required beginning date. Designated beneficiaries, who are not eligible designated beneficiaries, must withdraw the entire account by the 10th calendar year following the year of the account owner’s post-2019 death. Non-designated beneficiaries (including an estate, charity, or some trusts) must withdraw the entire account within five years of the account owner’s death if distributions have not begun before death. (Source: IRS)

Estate Planning – Identifying Probate and Non-Probate Assets – All of the decedent’s property at death can be divided into probate and non-probate property. Probate property is property that passes through the probate court under the decedent’s Will or by intestacy. On the other hand, non-probate property is property that passes outside of probate by way of a Will substitute or operation of law.

Probate Asset Examples: Non-Probate Asset Examples:
Real property titled solely in the decedent’s name Employer-Provided Pension Plans (beneficiary designation)
Personal property such as jewelry, furniture, automobiles, boats, etc. 401(k)s and IRA Accounts (beneficiary designation)
Bank accounts solely in the decedent’s name Life Insurance (beneficiary designation)
An interest in a partnership, corporation, or limited liability company Payable-on-Death (POD) and Transfer-on-Death (TOD) Assets
Stock or Brokerage Accounts solely in the Decedent’s name Jointly Held Property