Ocean Park Capital Management

2503 Main Street

Santa Monica, CA 90405

Main: 310.392.7300

Daily Performance Line:  310.281.8577

June 2022
Market Update
(all values as of 04.30.2024)

Stock Indices:

Dow Jones 37,815
S&P 500 5,035
Nasdaq 15,657

Bond Sector Yields:

2 Yr Treasury 5.04%
10 Yr Treasury 4.69%
10 Yr Municipal 2.80%
High Yield 7.99%

YTD Market Returns:

Dow Jones 0.34%
S&P 500 5.57%
Nasdaq 4.31%
MSCI-EAFE 1.98%
MSCI-Europe 2.05%
MSCI-Pacific 1.82%
MSCI-Emg Mkt 2.17%
 
US Agg Bond 0.50%
US Corp Bond 0.56%
US Gov’t Bond 0.48%

Commodity Prices:

Gold 2,297
Silver 26.58
Oil (WTI) 81.13

Currencies:

Dollar / Euro 1.07
Dollar / Pound 1.25
Yen / Dollar 156.66
Canadian /Dollar 0.79
 

Portfolio Overview

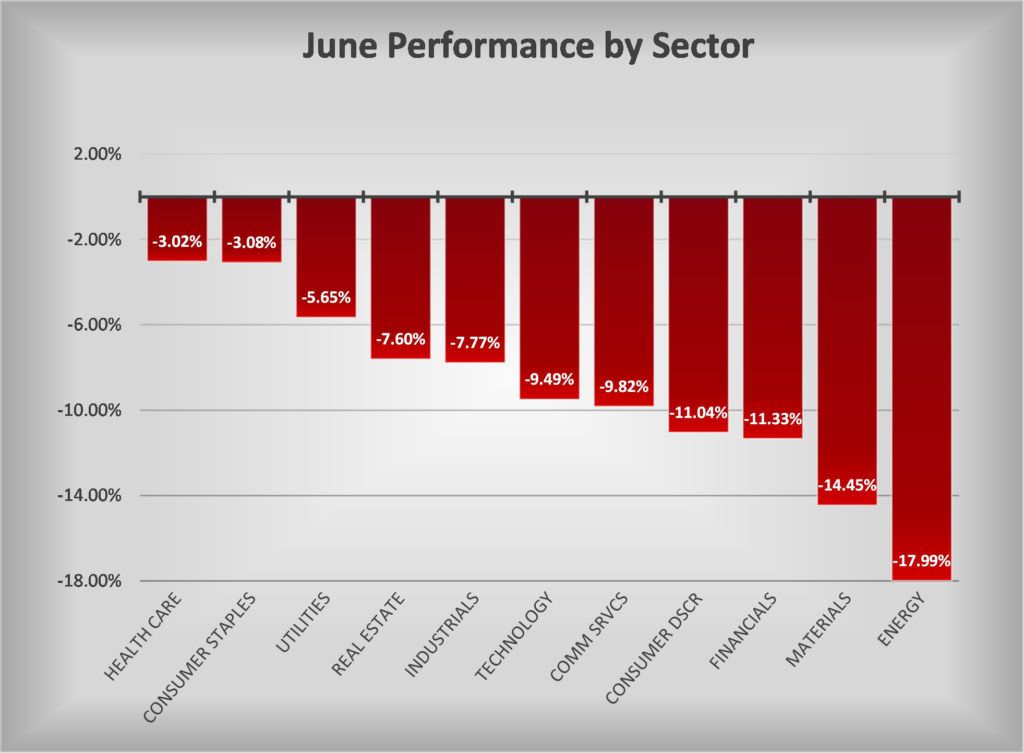
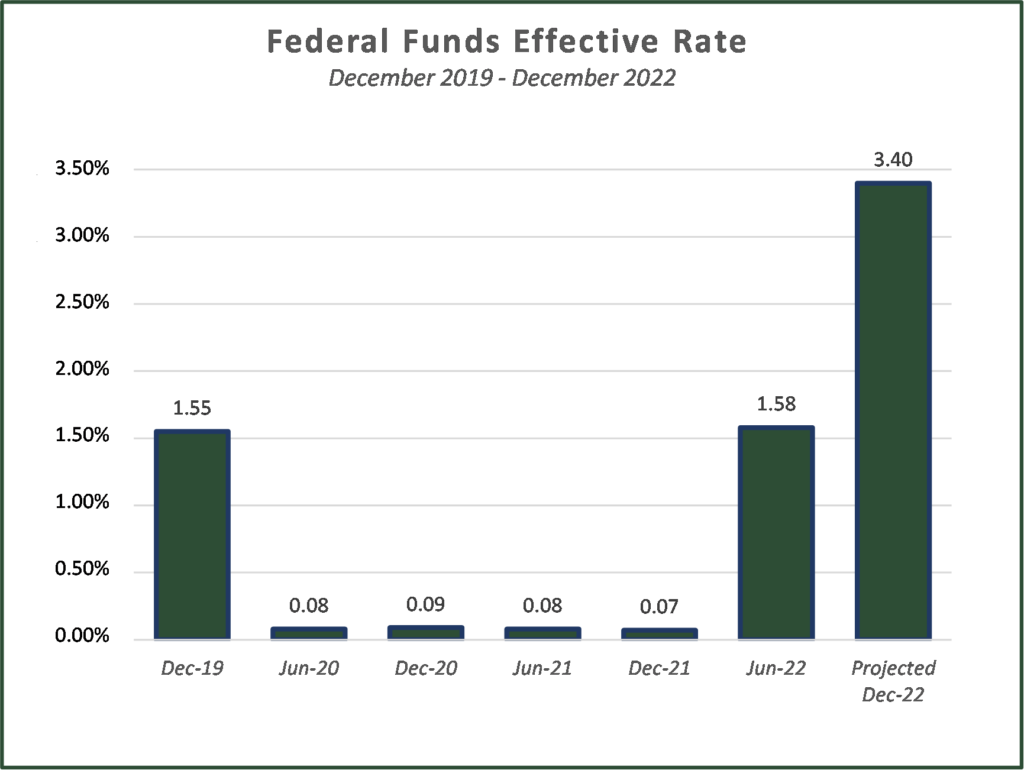
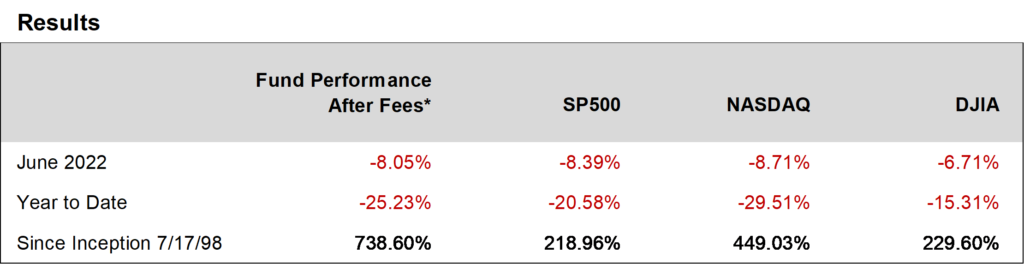
Ocean Park Investors Fund lost 8.05%* in June.  The S&P 500 lost 8.39% and the NASDAQ Composite lost 8.71%.  Among portfolio holdings, health care stocks were strongest and technology and consumer discretionary stocks were weakest.  Equities reacted to worse than expected inflation and fears that aggressive action by the Fed could stall economic growth.  At the same time, analysts suggest that markets may be nearing a bottom as the S&P 500 forward price earnings ratio dipped to 15.7, well below its five-year average of 18.6 and 10-year average of 17.0.

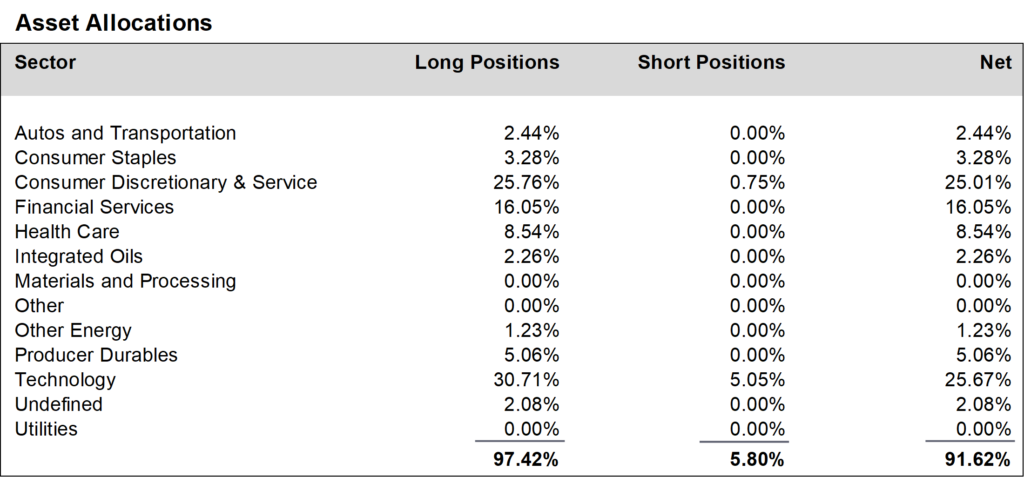
During June, we added to positions in the consumer staples and health care sectors and reduced positions in the technology sector.  We finished the month at about 92% net long, down slightly from about 93% in May.


Daily updates on our activity are available on our Results Line, at 310-281-8577, and current information is also maintained on our website at www.oceanparkcapital.com. To gain access to the site enter password opcap.

*These results are pro forma. Actual results for most investors will vary. See additional disclosures on page 4. Past performance does not guarantee future results.


Equity Overview

Equity Overview

Stocks hit a downdraft in June, as all sectors fell substantially.  Health care stocks were hurt the least, while energy stocks were hurt worst. Value stocks were no haven, as they underperformed growth stocks at all capitalization levels.

As it has been for most of 2022, volatility was dramatic.  The S&P 500 moved more than 1% on 12 of 22 trading days during the month, including 7 days on which the index moved more than 2%, and a four-day stretch in mid-month when the index lost 10%.


Macro Overview

Macro Overview

Economic data reported in June was mixed.  Manufacturing and housing were weak and consumer confidence fell.  But retail sales were solid.  The National Retail Federation points out that restaurant sales—which it describes as a proxy for broader services spending for recreation and travel—gained 17.5% year-over-year.  And there was good news for workers, as wages rose 5.2% year-over-year.

Inflation continued its upward march, as the Consumer Price Index rose 8.6% year-over-year.  In response, the Fed raised interest rates by 0.75%, its most aggressive increase since 1994.  This brought the Fed Funds rate to a range of 1.5% to 1.75%.  The Fed projects that this rate will rise to 3.4% by year-end.

The Fed also projected that the U.S. economy will grow by 1.7% in 2022 (down from its estimate of 2.8% in March), and that inflation will subside to 2.6% in 2023.


Additional Disclosures

Additional Disclosures

Performance data for OPI reflect the reinvestment of dividends and other earnings on the fund’s assets.  Performance data for the major indices reflect only changes in the value of those indices, and would be higher if dividends were included. However, the index data do not reflect fees that would be paid to index fund managers and transaction costs that would be incurred when their component stocks are bought or sold, while OPI’s data do reflect quarterly fees and expenses incurred by the fund.  The information provided is believed to be reliable, but its accuracy or completeness is not warranted. This material is not intended as an offer or solicitation for the purchase or sale of any stock, bond, mutual fund, or any other financial instrument. The views and strategies discussed herein may not be appropriate and/or suitable for all investors. This material is meant solely for informational purposes, and is not intended to suffice as any type of accounting, legal, tax, or estate planning advice. Any and all forecasts mentioned are for illustrative purposes only and should not be interpreted as investment recommendations.