Ocean Park Capital Management

2503 Main Street

Santa Monica, CA 90405

Main: 310.392.7300

Daily Performance Line:  310.281.8577

June 2023
Market Update
(all values as of 04.30.2024)

Stock Indices:

Dow Jones 37,815
S&P 500 5,035
Nasdaq 15,657

Bond Sector Yields:

2 Yr Treasury 5.04%
10 Yr Treasury 4.69%
10 Yr Municipal 2.80%
High Yield 7.99%

YTD Market Returns:

Dow Jones 0.34%
S&P 500 5.57%
Nasdaq 4.31%
MSCI-EAFE 1.98%
MSCI-Europe 2.05%
MSCI-Pacific 1.82%
MSCI-Emg Mkt 2.17%
 
US Agg Bond 0.50%
US Corp Bond 0.56%
US Gov’t Bond 0.48%

Commodity Prices:

Gold 2,297
Silver 26.58
Oil (WTI) 81.13

Currencies:

Dollar / Euro 1.07
Dollar / Pound 1.25
Yen / Dollar 156.66
Canadian /Dollar 0.79
 

Portfolio Overview

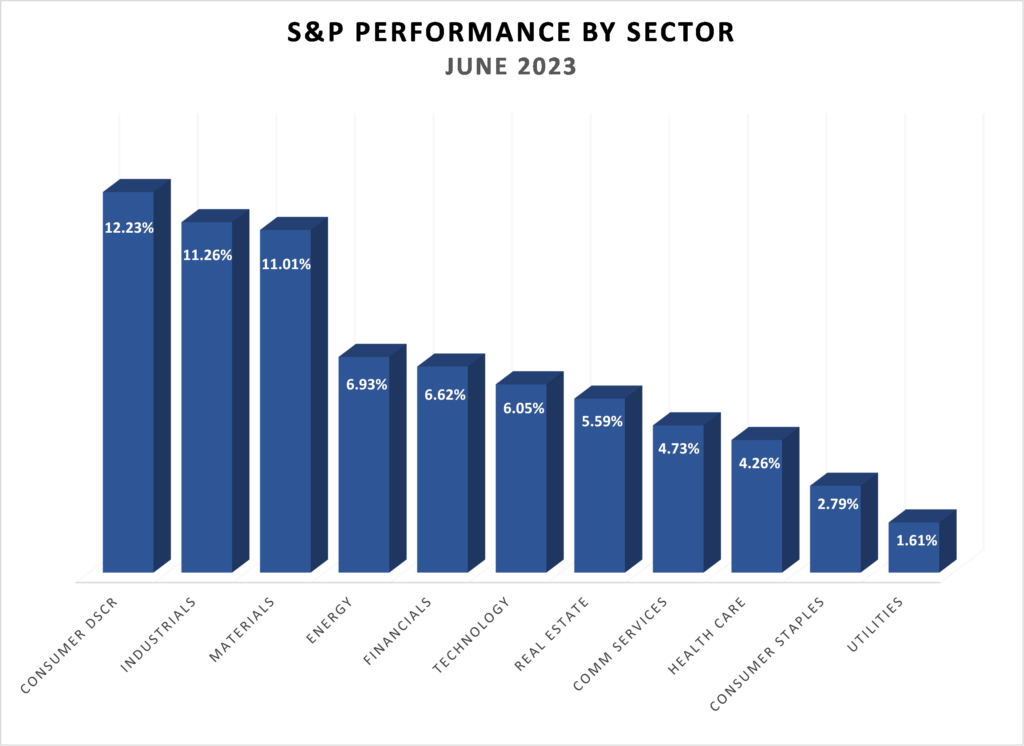
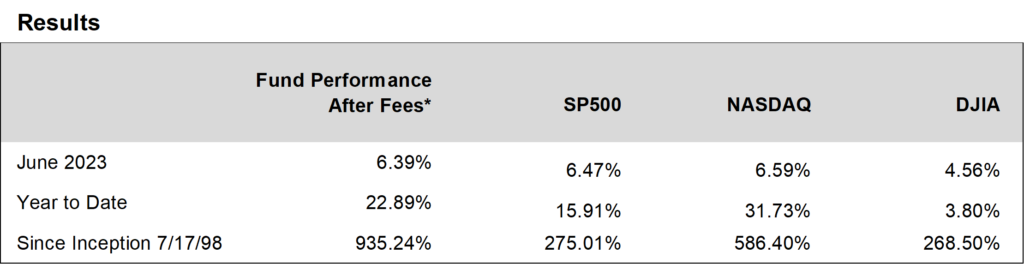
Ocean Park Investors Fund rose 6.39%* in June, while the S&P 500 rose 6.47% and the NASDAQ Composite rose 6.59%.  The fund’s technology holdings led the way as Nvidia gained another 12% (hitting a $1-trillion market cap) and numerous other tech positions posted double-digit gains.  One analyst noted that “Tech is the only S&P 500 sector to outperform over the last 4 years” due to superior earnings growth.

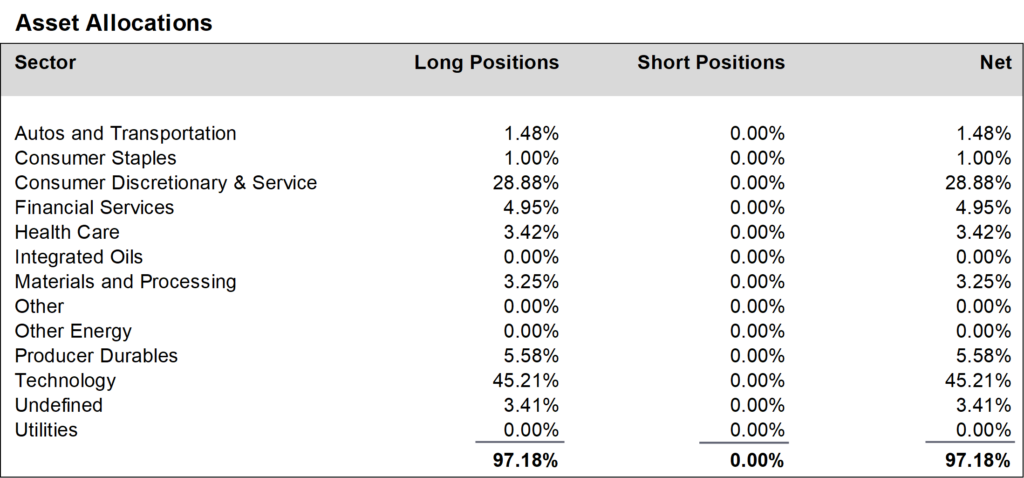
During June, we increased positions in the technology sector and the materials and processing sector and reduced positions in the SPY and QQQ ETFs.  We finished the month at about 97% net long, up from about 94% in May.


Daily updates on our activity are available on our Results Line, at 310-281-8577, and current information is also maintained on our website at www.oceanparkcapital.com. To gain access to the site enter password opcap.

*These results are pro forma. Actual results for most investors will vary. See additional disclosures on page 4. Past performance does not guarantee future results.


Equity Overview

Equity Overview

All eleven sectors in the S&P 500 rose in March, with consumer discretionary the best sector and utilities the weakest.  Gains were distributed almost evenly across growth and value stocks.  Volatility was benign, as the S&P 500 moved more than 1% on only 4 of 21 trading days.

The NASDAQ-100, which tracks the one hundred largest non-financial companies in the NASDAQ Composite, rose 39.4% in the first half of 2023, the largest first-half gain since its inception in 1985. Much of that gain was attributable to mega-cap tech stocks.  Importantly, however, June saw eye-opening performance among less flashy sectors like industrials and materials, which each gained over 11% for the month.  This suggests that economic activity may be broader than currently appreciated, and therefore that a recession is less likely than anticipated.


Macro Overview

Macro Overview

Economic headlines in June were promising.  Job growth jumped as employers added 339,000 jobs, well above estimates of 190,000.  Housing was solid.   Factory orders were higher, although manufacturing was slightly lower.  Retail sales gained.  Consumer confidence spiked to its highest level since January 2022. Inflation as measured by the Consumer Price Index declined to 4.0% year-over-year.

The Commerce Department issued its final revision of GDP growth in the first quarter and it was sharply higher at 2.0%, well above the previous estimate of 1.3%

Any residual concerns about the banking sector were alleviated as all the major banks passed the Fed’s annual stress test (which assumes a 10% unemployment rate and a 40% drop in commercial real estate prices.)


Additional Disclosures

Additional Disclosures

Performance data for OPI reflect the reinvestment of dividends and other earnings on the fund’s assets.  Performance data for the major indices reflect only changes in the value of those indices, and would be higher if dividends were included. However, the index data do not reflect fees that would be paid to index fund managers and transaction costs that would be incurred when their component stocks are bought or sold, while OPI’s data do reflect quarterly fees and expenses incurred by the fund.  The information provided is believed to be reliable, but its accuracy or completeness is not warranted. This material is not intended as an offer or solicitation for the purchase or sale of any stock, bond, mutual fund, or any other financial instrument. The views and strategies discussed herein may not be appropriate and/or suitable for all investors. This material is meant solely for informational purposes, and is not intended to suffice as any type of accounting, legal, tax, or estate planning advice. Any and all forecasts mentioned are for illustrative purposes only and should not be interpreted as investment recommendations.