Aspen Wealth Management, Inc.

9300 W. 110th Street, Suite 680

Overland Park, KS  66210

913.491.0500

www.aspenwealth.com

Market Update
(all values as of 04.30.2024)

Stock Indices:

Dow Jones 37,815
S&P 500 5,035
Nasdaq 15,657

Bond Sector Yields:

2 Yr Treasury 5.04%
10 Yr Treasury 4.69%
10 Yr Municipal 2.80%
High Yield 7.99%

YTD Market Returns:

Dow Jones 0.34%
S&P 500 5.57%
Nasdaq 4.31%
MSCI-EAFE 1.98%
MSCI-Europe 2.05%
MSCI-Pacific 1.82%
MSCI-Emg Mkt 2.17%
 
US Agg Bond 0.50%
US Corp Bond 0.56%
US Gov’t Bond 0.48%

Commodity Prices:

Gold 2,297
Silver 26.58
Oil (WTI) 81.13

Currencies:

Dollar / Euro 1.07
Dollar / Pound 1.25
Yen / Dollar 156.66
Canadian /Dollar 0.79
 

Macro Overview

The US debt ceiling resolution in early June aided US equity markets to rally. Recently, the Federal Reserve has essentially signaled that it is more concerned about combating inflation than the negative consequences of continued rising rates on the economy.  The Fed indicated that it intends to raise rates at least two more instances this year. As a result, the yield on the benchmark 10-year US Treasury increased from 3.48% to 3.81% (now at 4.06%). This was a headwind for US fixed income/bond prices.

Once each year, the Federal Reserve conducts a test to assess how large banks are likely to perform under hypothetical economic conditions. The results of the most recent tests revealed that all the major banking institutions passed this year’s stress test. The tests assumed a hypothetical 10% unemployment rate and a 40% drop in commercial real estate prices.

US Equities Rally

The S&P 500 delivered attractive returns for the first six months of the year, achieving a commendable increase of 15.91%. It is important to note that these gains were largely concentrated in a few very large companies often called megacaps.  In fact, the dominance of the top five stocks, namely Apple, Microsoft, Alphabet-Google, Amazon, and Nvidia, significantly influenced the benchmark index’s performance. Despite comprising just 22% of the index’s allocation, these five stocks accounted for over 80% of the overall index return. In contrast, the Dow Jones Industrial Average lagged behind, exhibiting a modest advance (+3.80% year-to-date).  The remarkable surge witnessed in the SP500 benchmark index during the first half of the year can be attributed to a confluence of factors, with the foremost among them being the phenomenal progress made by technology-led growth stocks. The prevailing optimism was further bolstered by indications that the Federal Reserve’s aggressive stance on interest rate hikes was indeed achieving the desired deceleration effect on the economy, prompting market participants to escalate their expectations of the central bank curtailing its monetary policy tightening before year-end.

However, the primary impetus behind the formidable gains observed in the initial six months primarily stems from the exceptional performance exhibited by growth-oriented industries, driven by the fervor surrounding artificial intelligence and a notable upswing in earnings trajectory. Notably, outpacing the S&P 500 are solely three sectors, all of which fall under the purview of growth sectors. Information Technology jumped 42.06% year-to-date, boosted by chipmakers (Nvidia – NVDA) and some behemoths such as Apple (APPL) and Microsoft (MSFT). Communications Services, which include Alphabet (GOOG) and Meta Platforms (META), gained 35.58%, and Consumer Discretionary, which holds Amazon (AMZN) and Tesla (TSLA), was up 32.33%. Combined, these three sectors account for about 47% of the overall market weighting and 112% of the YTD performance of the S&P 500.  All the other sectors significantly underperformed the benchmark index over the last six months. The S&P 500 gains aren’t broad across all sectors as the financial (-1.5%), utilities (-7.16%), health care (-2.33%), and energy (-7.26%) sectors all experience first half losses.


For the first-half stock market rally to strengthen and continue, the market breadth needs to improve to include many more stocks than just the megacaps. It is also possible that the megacaps will take a breather and over time become less pricey.  Remember that the price paid for a stock reflects the expectations for future profit streams.

As of June 30, Nvidia Corporation (symbol: NVDA), the AI microchip company, is priced at 40 times revenue; that means that to get a payback on your investment, NVDA will have to pay 100% of its revenues for 40 straight years in dividends. This assumes zero expenses: costs of goods sold (not practical), research & development, employee payroll, zero taxes (Uncle Sam probably would object) and no taxes on dividends (illegal). So before jumping on the megacap bandwagon, does it really make sense to pay the current price for the stock of NVDA and others?  For perspective, the S&P 500 sells for 2 times sales.

How accurate is the inverted yield curve at predicting recessions?

A growing discussion among economists is whether or not the economy will experience a recession. Can interest rates help predict a recession?  When it comes to economic forecasts, the U.S. Treasury yield curve is a go-to gauge for many seasoned investors. And for good reason: An inverted yield curve has accurately foreshadowed all 10 recessions since 1955, according to data from the Federal Reserve Bank of San Francisco.  The time between an inverted yield curve and a recession has ranged from 6 to 24 months. The current yield curve inversion, where 2-year Treasury yields (4.97%) are greater than 10-year Treasury yields (4.06%), commenced in July of 2022.

Although an inverted yield curve is a frequently referenced warning signal for economic forecasts, especially recessions, it does not provide insight regarding the severity or duration of looming recessions.   This chart shows 100 years of Chair Powell’s preferred US yield curve (10-year minue 3-month US Treasury rates). Whatever your view about the accuracy of the yield curve as a recession predictor, the curve has only been this inverted three times before – 1929, 1973 and 1979-80. None of those ended well.


America Is Getting Older – Demographics

The average age in the U.S. increased to a historic high in 2022, rising 0.2 years between 2021 and 2022 to reach median age of 38.9 years. The average age has steadily risen over the past decades, primarily due to declining birth rates coupled with longer life spans over the past 20 years.

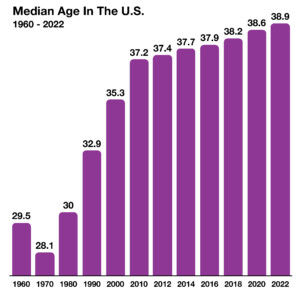
Americans’ median age reached 30 years old in 1980 and rose to 35 years old in 2000. In the past 22 years, the average age has risen by 3.6 years. America has been steadily aging over the past 50 years, with the median age rising 10.8 years since 1970.

In 2022, 17 states had a median age of above 40, while no state experienced a decrease from their 2021 median age. Maine had the highest median age at 44.8, while Utah was the youngest state at 31.9 years. Florida had two of the nation’s six oldest counties, including the oldest county with a median age of 68.1 years old.

Other key populations across Europe and Asia have seen similar trends and steady increases in age. The oldest median ages in nations across the world include Japan at 48.6, Monaco at 55.4, and Germany at 47.8 years. On the flip side, the youngest median ages include Niger at 14.8, Uganda at 15.7, and Angola at 15.9 years. The United States is the 61st oldest nation globally world, with a similar median age to China and Thailand. (Sources: Federal Reserve Bank of the United States, Federal Reserve Bank of Atlanta, U.S. Census Bureau, U.S. Treasury, U.S. Labor Department)

Paper Check Fraud On The Rise – Consumer Awareness

Despite electronic deposits and checks on the rise, paper checks remain an extremely common way to pay expenses such as rent, utilities, donations, and taxes. However, fraud is increasingly targeting paper checks, raising the risks of writing a check.

Such fraud can occur in a wide variety of ways, including the targeting of mailboxes where checks lay susceptible. Most of these tactics are low-tech and primarily target a more elderly population that still heavily relies on paper checks. Americans sent out 11.2 billion checks in 2021 alone. Banks are reporting that check fraud has been rising significantly, with credit card fraud the next highest form of fraud.

Certain methods could prevent check fraud. For one, individuals and businesses should limit the number of written checks to reduce the chances of a check being stolen. Experts recommend using gel ink pens rather than ballpoint pens to make it more difficult to remove the ink with chemicals. Additionally, always keep an eye on any unusual transactions and report them as soon as possible to your bank. (Sources: Financial Crimes Enforcement Network, Federal Reserve Bank of the U.S., U.S. Treasury Department)


US Debt

On June 3, President Biden signed legislation to avert a default on the nation’s debt. Below is a graph of the US debt since 1
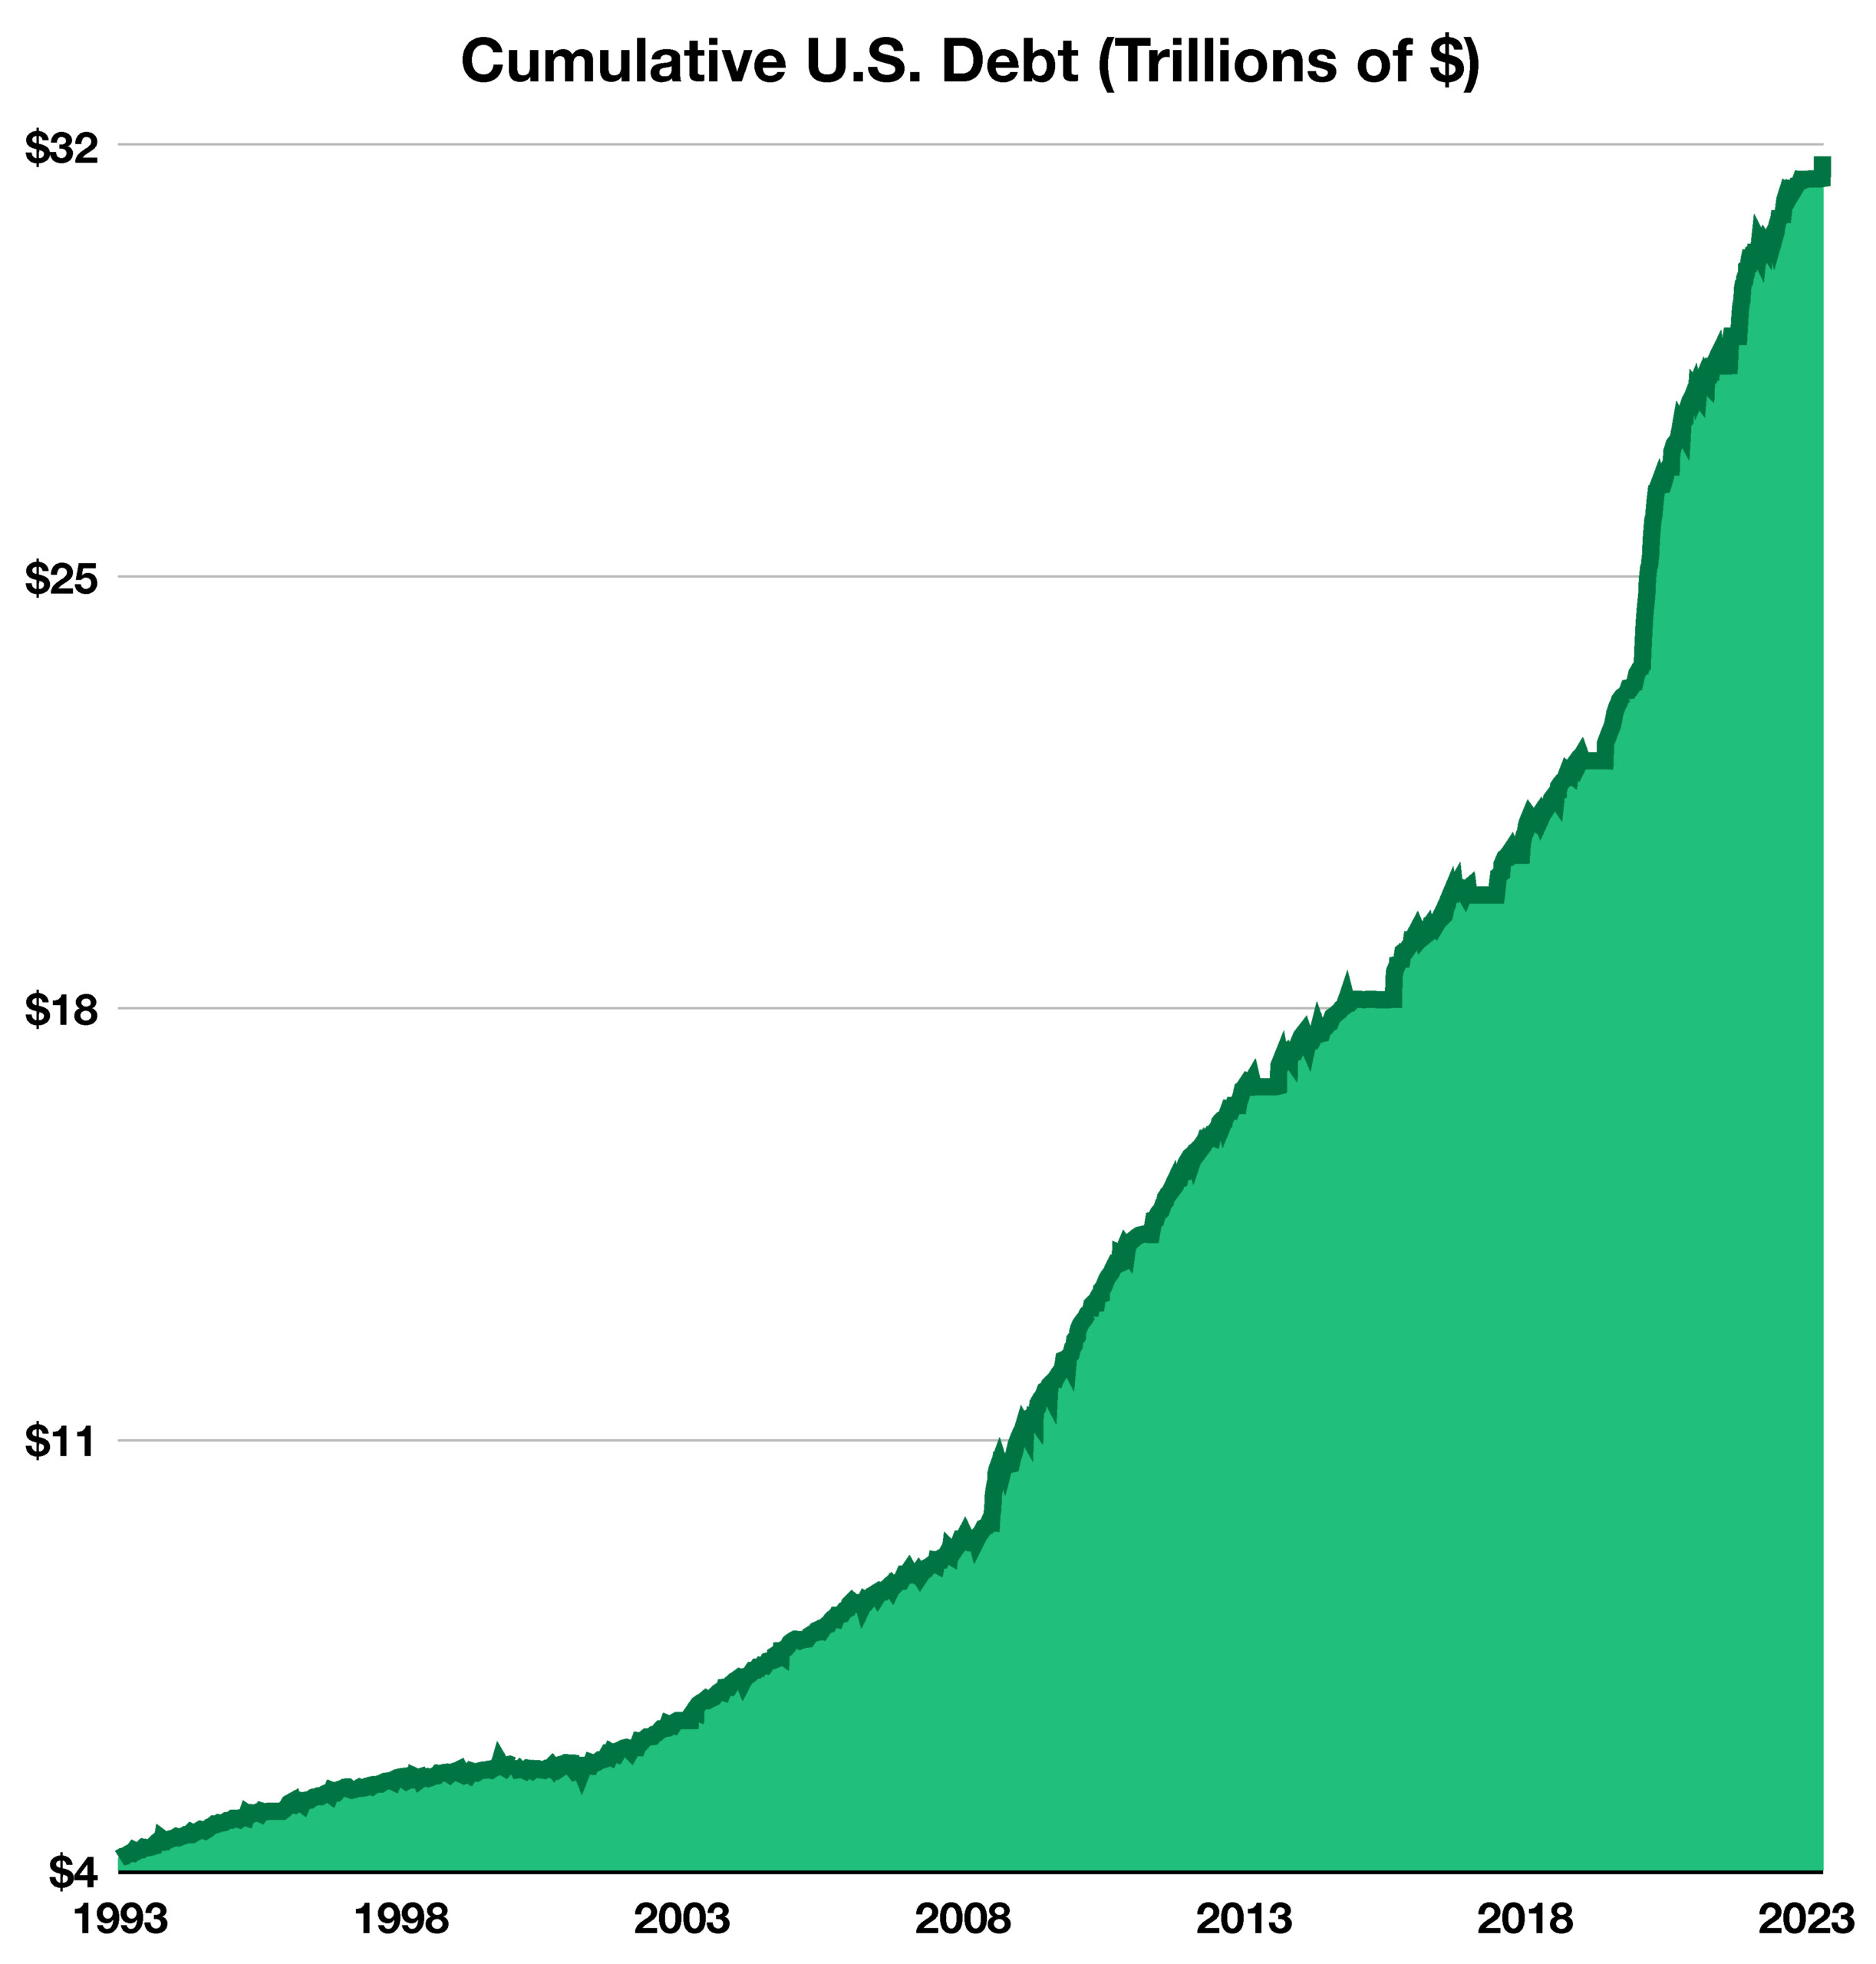
993.  The level of debt is increasing so quickly, the chart may soon need to be illustrated in logarithmic scale.

The impasse on the debt ceiling added strain to bond and equity markets in May. Once the impasse was resolved, US equities rallied while US Treasury bond yields rose (prices declined) as increasing debt level concerns triggered increased trading in government bonds. Debt ceiling concerns in addition to the uncertainty surrounding regional banks’ exposure to commercial real estate contributed to a volatile environment throughout the month.

The Treasury Department plans to issue additional short-term debt to fund immediate federal expenses, with $61 billion in 6-month bills and $68 billion in three-month bills already issued as of the first of June. Treasury issuances, also known as auctions, are part of the government’s ongoing cash management process.

Inflation

The rate of inflation has been trending lower. With lower energy prices, improvements in worker availability, and fading stimulus demand, most companies have reduced the rate of price increases. That said, inflation remains positive, and accumulated inflation continues to be a significant and underappreciated issue. A dollar received at the beginning of 2021 is now only worth $0.86 (ouch!) with accumulated inflation continuing to build. Adding to inflation’s complexity, asset inflation no longer appears contained, as a growing number of businesses cater to the wealthy and set prices accordingly.

While many investors and policy makers expect the inflation rate to continue to subside in the coming months, elevated inflation could persist as a result of any of these catalysts: a rebound in energy prices, the end of inventory destocking, shortages of skilled and productive workers, unchecked fiscal deficits, the premature end of quantitative tightening, the resumption of quantitative easing, yield curve control, asset inflation spillover, deglobalization, a decline in the dollar, and the continuation of businesses choosing profits over activity. In our opinion, the future path of inflation is very uncertain. (Source: Palm Valley Capital Management)