July 2024
Market Update
(all values as of 06.28.2024)

Stock Indices:

Dow Jones 39,118
S&P 500 5,460
Nasdaq 17,732

Bond Sector Yields:

2 Yr Treasury 4.71%
10 Yr Treasury 4.36%
10 Yr Municipal 2.86%
High Yield 7.58%

YTD Market Returns:

Dow Jones 3.79%
S&P 500 14.48%
Nasdaq 18.13%
MSCI-EAFE 3.51%
MSCI-Europe 3.72%
MSCI-Pacific 3.05%
MSCI-Emg Mkt 6.11%
 
US Agg Bond -0.71%
US Corp Bond -0.49%
US Gov’t Bond -0.68%

Commodity Prices:

Gold 2,336
Silver 29.43
Oil (WTI) 81.46

Currencies:

Dollar / Euro 1.06
Dollar / Pound 1.26
Yen / Dollar 160.56
Canadian /Dollar 0.73

Macro Overview

Markets were influenced by election dynamics and economic data in June as equities and bonds responded to uncertainty surrounding the direction of future fiscal policy and when the Fed might commence its rate reduction initiative.

Equity indices ended the second quarter mixed as the S&P 500 Index and the Nasdaq Composite Index outperformed the Dow Jones Industrial Index. Technology related companies advanced during the quarter while energy and industrial companies lagged.

Big banks underwent a stress test, which is imposed by the Federal Reserve to determine financial viability as well as the ability for banks to withstand severe economic and financial shocks. All 31 banks tested remained above their minimum capital requirements during the hypothetical severe recession scenario, and are considered well-positioned to weather a severe recession and continue lending.

The most recent employment report showed that the unemployment rate rose to 4.1%, incentivizing the Federal Reserve to consider lowering rates sooner rather than later. Companies have been slowing their rate of hiring as well as increasing layoffs across various industries. Economists view these dynamics as indicative of decelerating economic activity. Some analysts expect the Fed to initiate rate reductions as early as September should economic data continue to substantiate slowing growth trends.

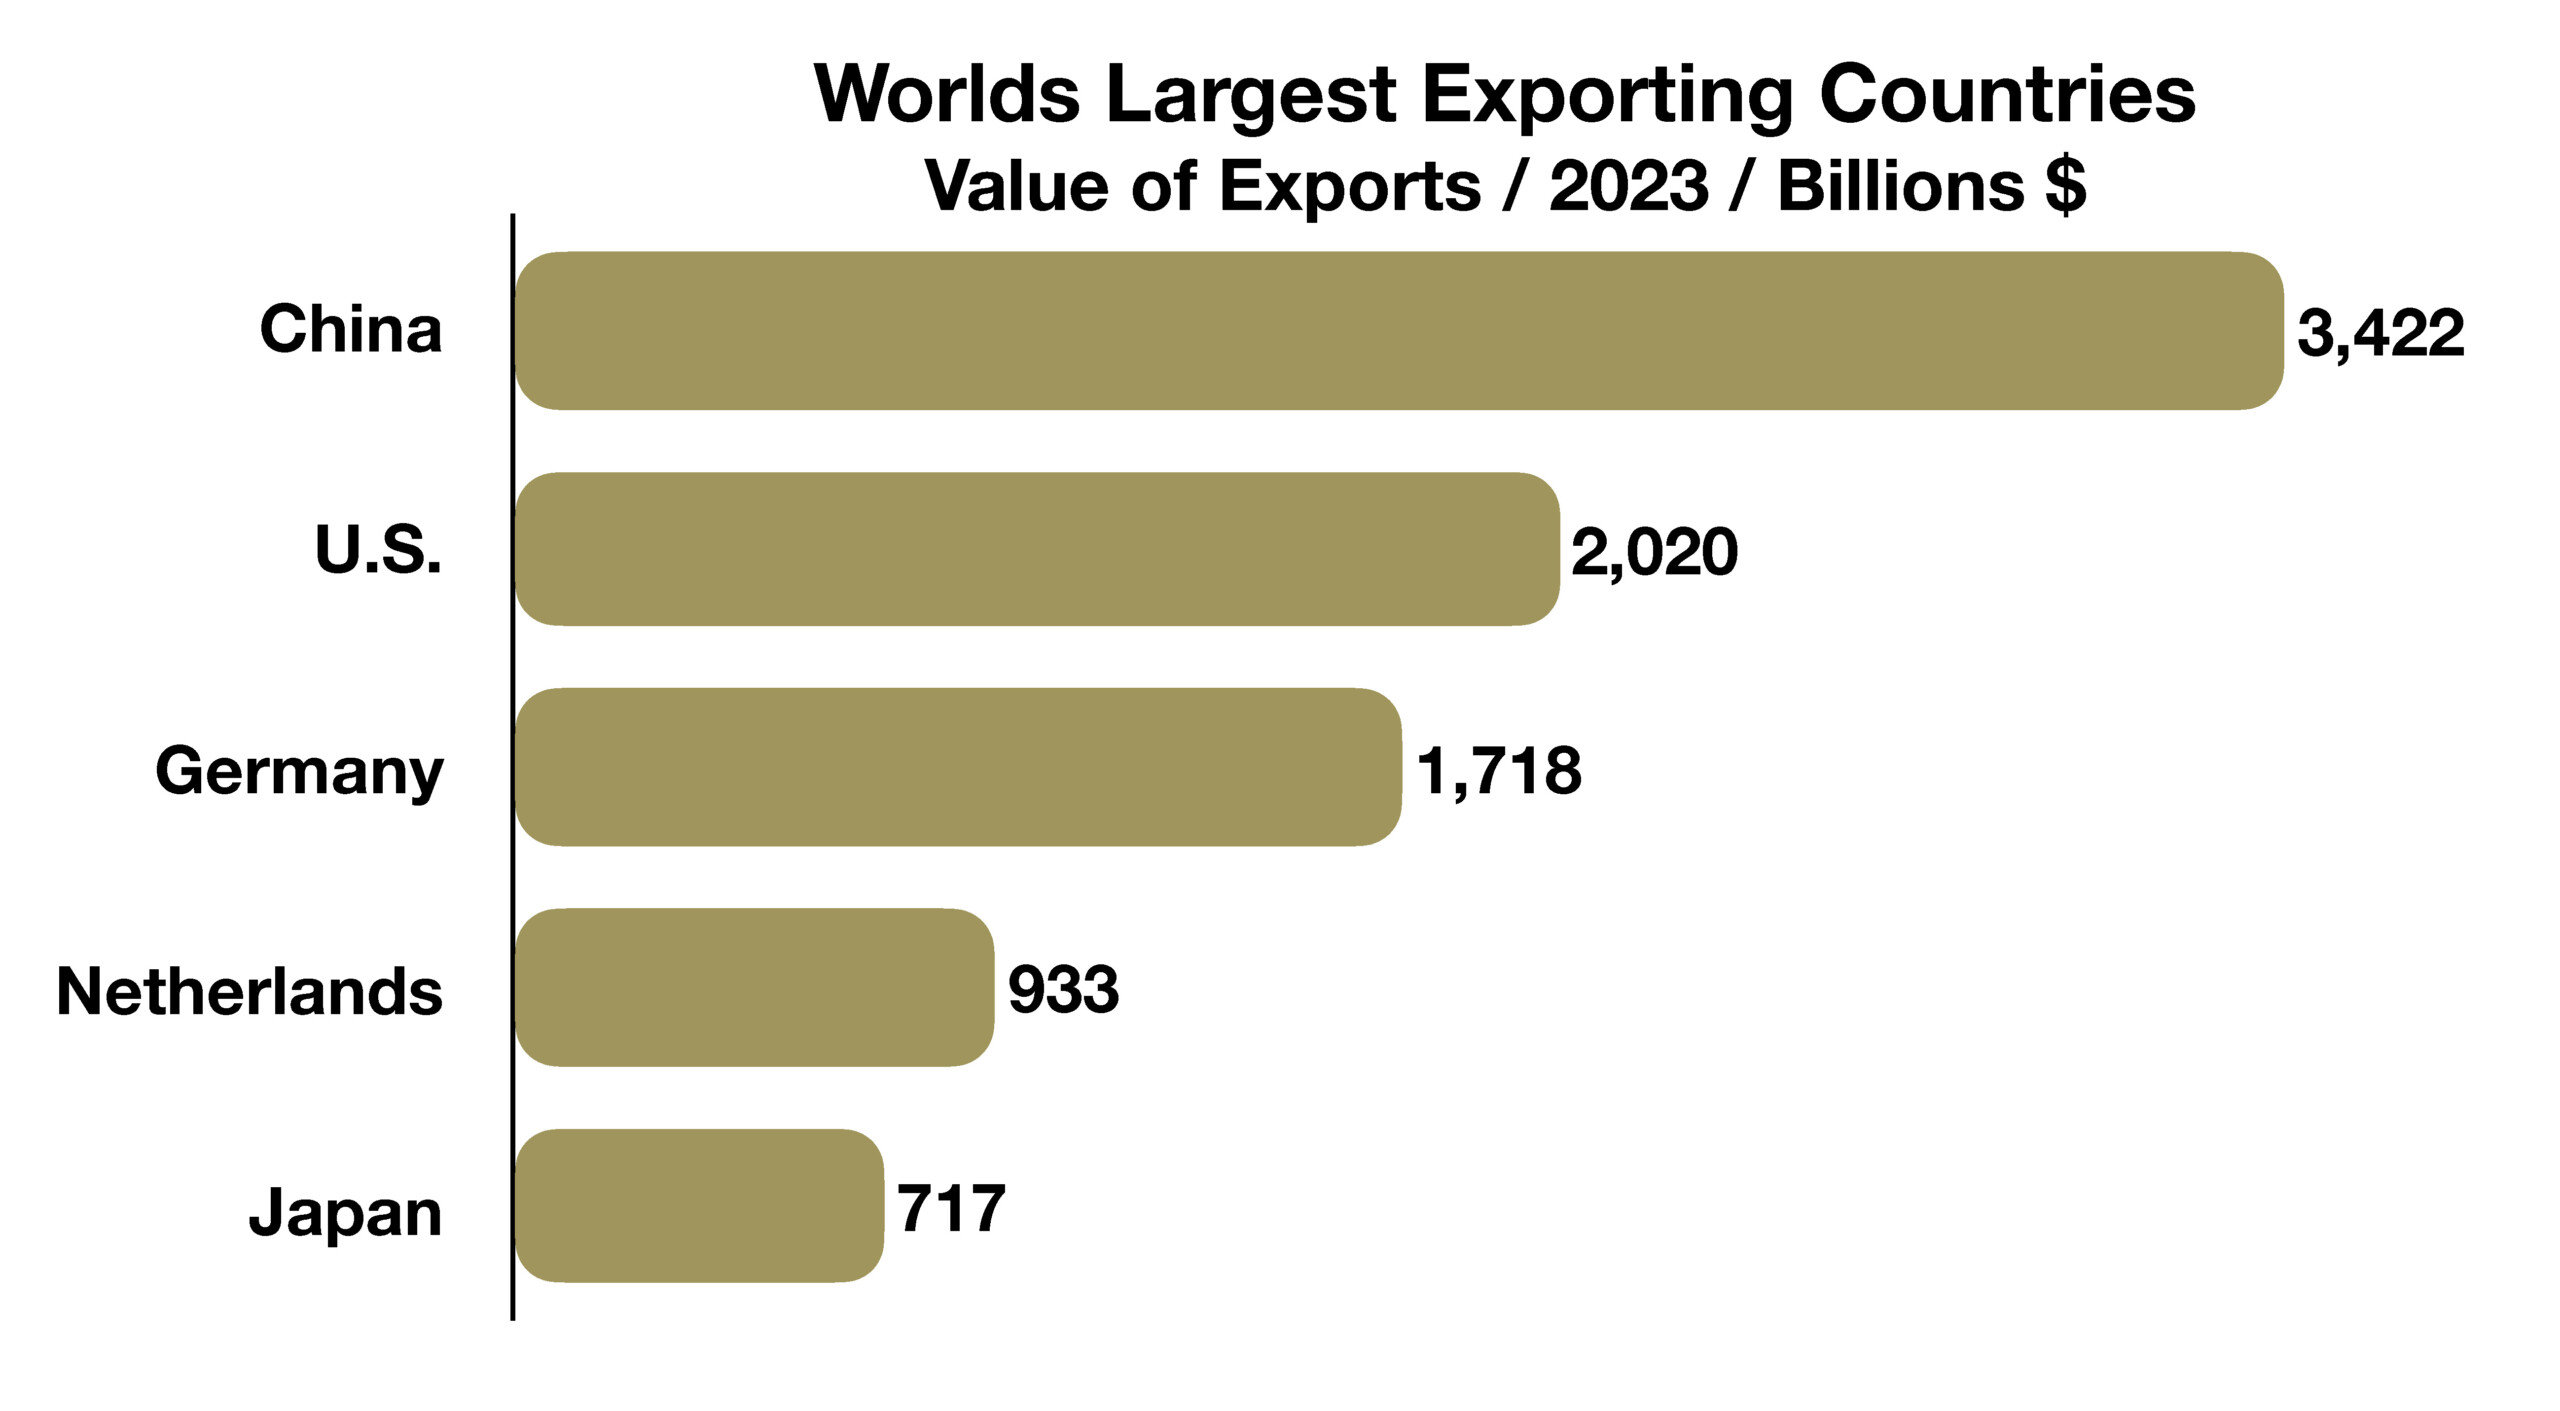
European central bankers, academics, financial market representatives, and journalists met in Sintra, Portugal in early July to exchange views on current policy issues and discuss long-term economic perspectives affecting European countries and the EU. Primary topics included continued inflationary pressures throughout Europe, the ongoing conflict with the Russian invasion of Ukraine, and employment challenges for the region. Subdued economic activity and slowing industrial production were part of the discussions, as Industrial production in the EU dropped by 5.4% between February 2023 and February 2024. The significant year-over-year decrease indicates a slowdown in industrial activity throughout Europe.

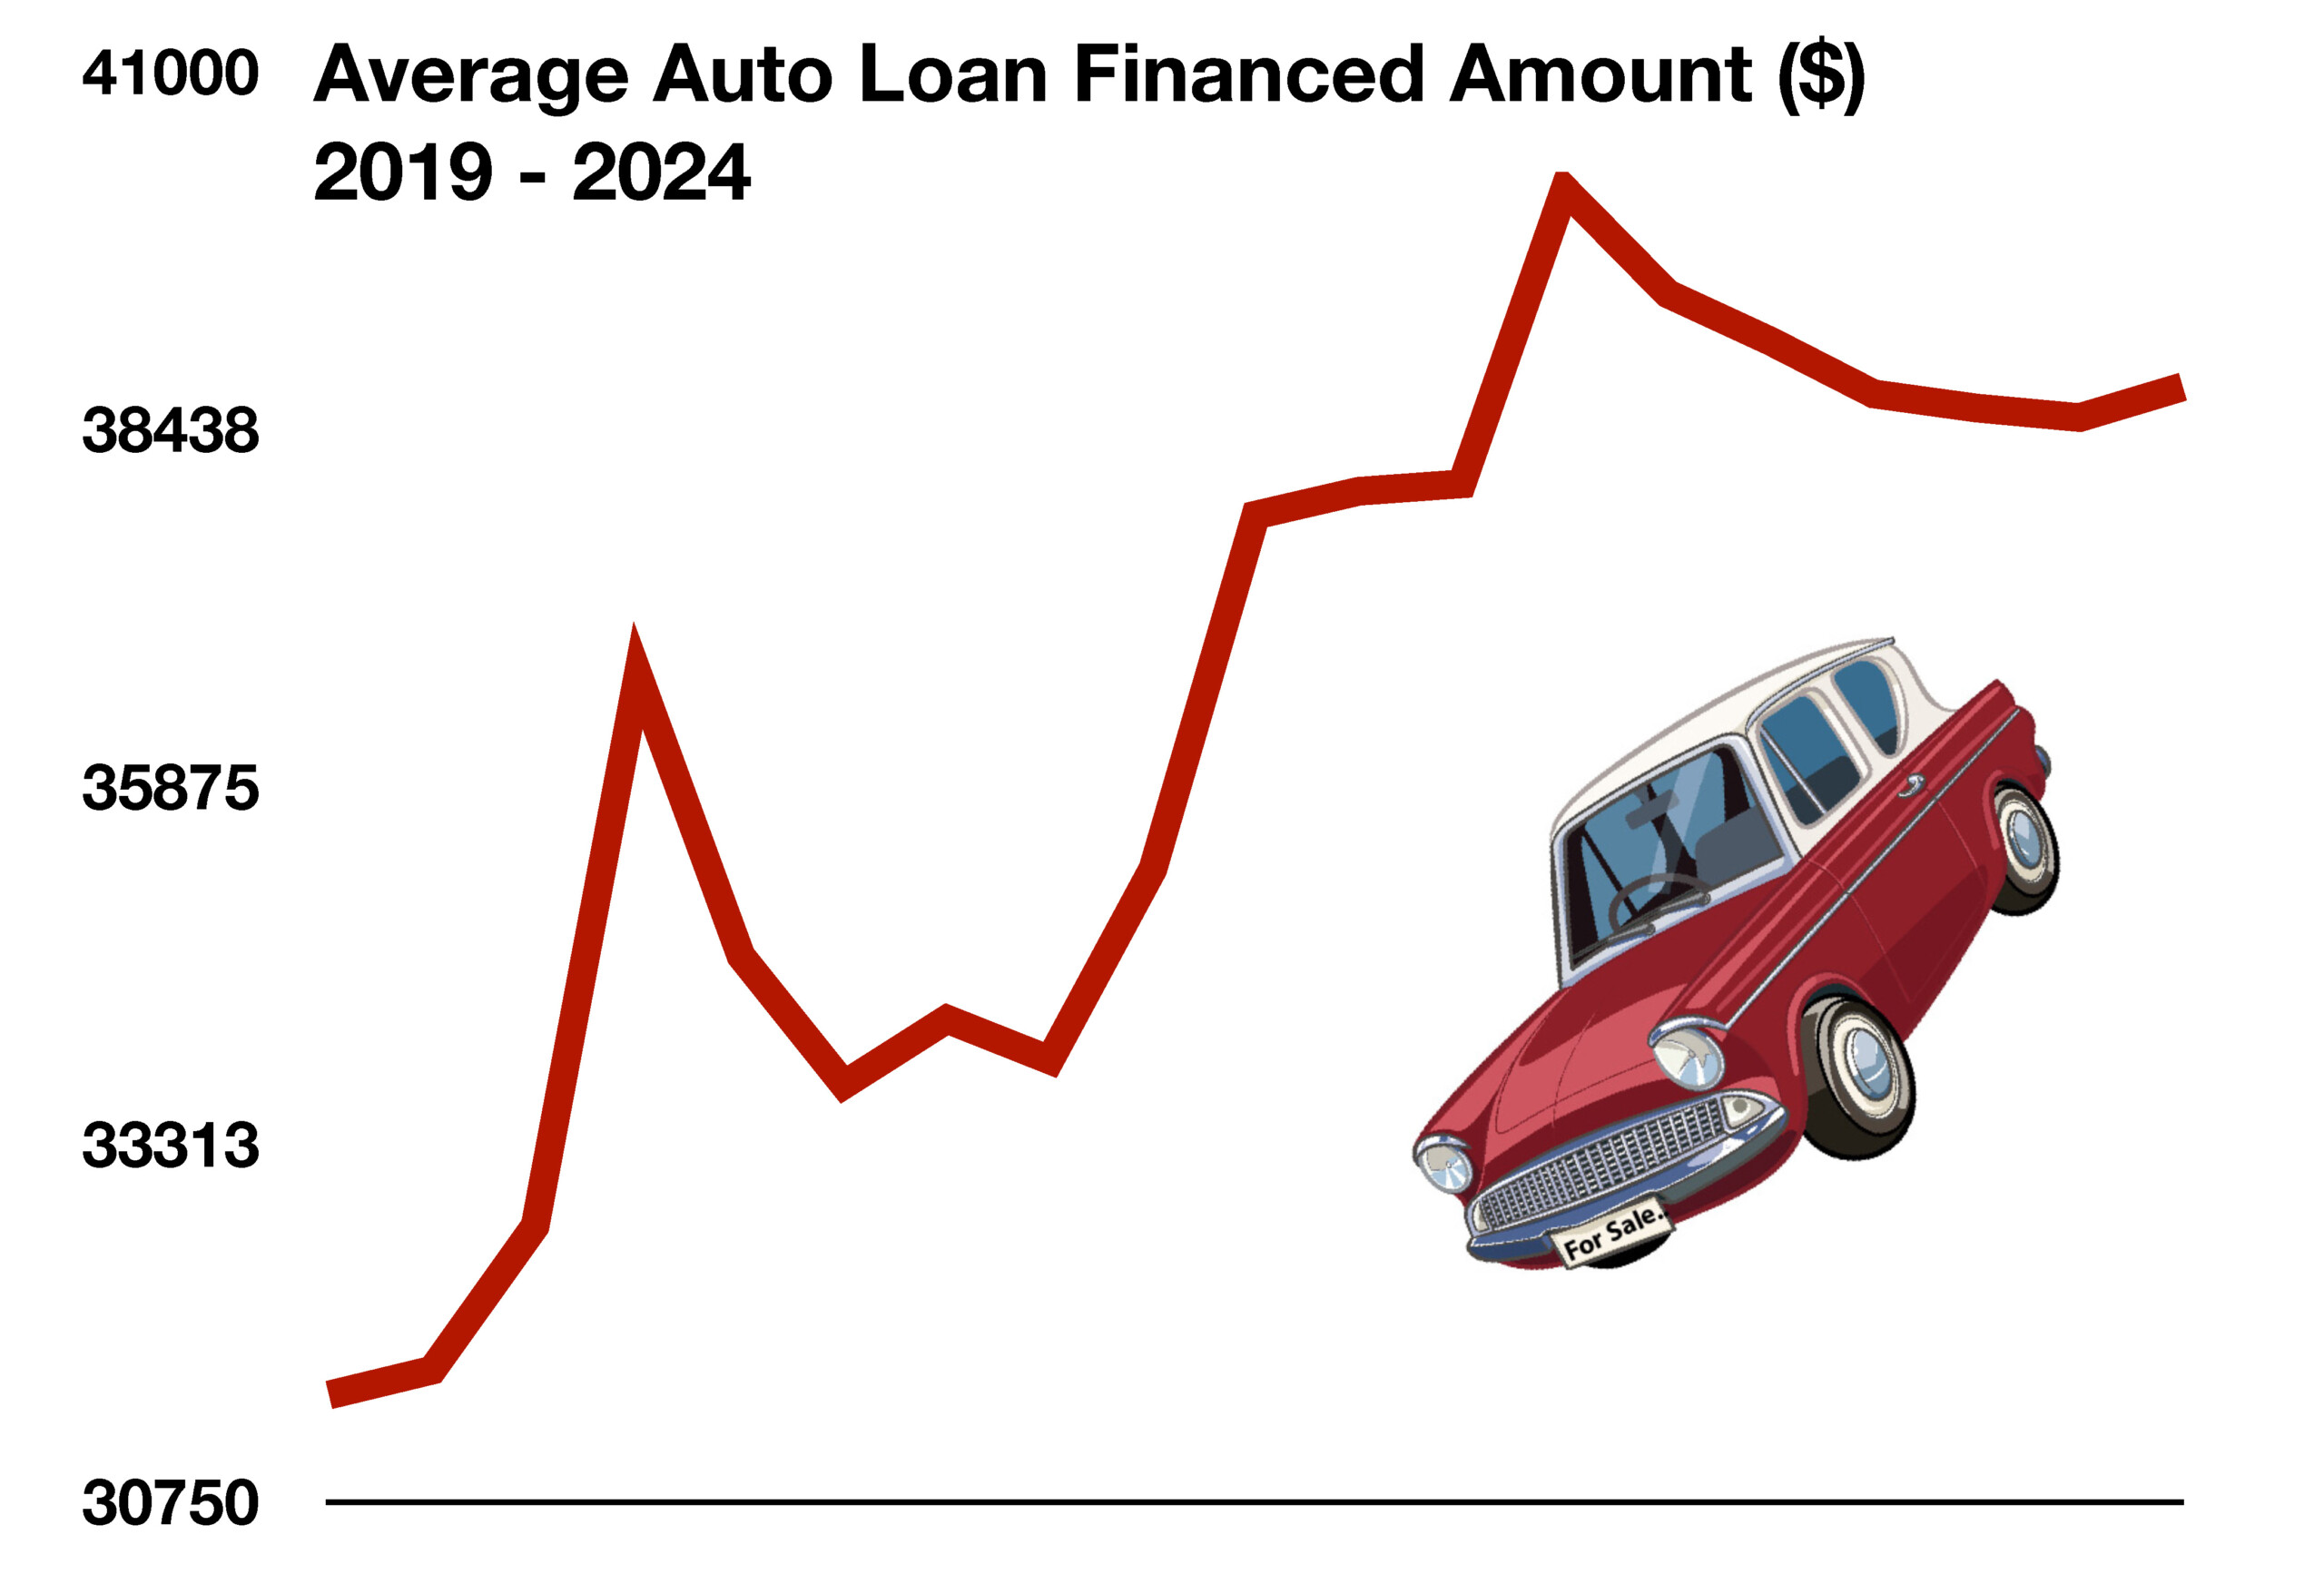
Financing costs for new autos remained relatively high in June, even though auto prices have been dropping. The typical monthly payment for a new auto loan set a record high of $740 this quarter, thus reducing consumer demand even as the average price on autos continue to drop due to easing supply chains and ample inventory.

Technology is advancing as companies are reconfiguring their computing infrastructure from information retrieval to an A.I. approach. The changes and advancement are anticipated to take years and are expected to affect nearly every sector and industry.

A model used by the Federal Reserve in valuing residential home values found that homes are now 25% overvalued, just below the 28% peak in 2007. Using the Labor Department’s measure of rent, home prices are 19% overvalued using private measures of market rents. The Fed also follows the S&P CoreLogic Case-Shiller U.S. national home price index, which is up 51% since the end of 2019. (Sources: U.S. Treasury, Federal Reserve, S&P, Eurostat, Labor Dept., ECB, Dow Jones, Nasdaq, Case-Schiller)

 
average amount for a new car loan has fallen to $38,739

Stock Indices Not In Sync – Domestic Equity Overview

The second quarter saw varying performance across the S&P 500 Index, as certain sectors outperformed while others underperformed. Technologies, utilities and communication services saw the largest gains for the quarter, while materials, industrials and energy experienced pullbacks. The S&P 500 Index was up 4.28% for the second quarter, while the Dow Jones Industrial Average posted a -1.73% decrease, and the Nasdaq Composite Index was up 8.5% for the quarter.

Various analysts are identifying a growing disparity among the major equity indices, indicating a market with narrow performance in just a few sectors, rather than broadly covering multiple sectors.

Sources: S&P, Dow Jones, Nasdaq, Bloomberg

Rates Start To Stabilize – Fixed Income Update

As recent economic data revealed a slowing economic environment in the second quarter, rates have begun to stabilize pointing to a downward trend over the next few months. The yield on the benchmark 10 year Treasury bond rose to 4.36% at the end of the second quarter ending June 28th, up slightly from 4.33% at the beginning of the quarter on April 1st. Even though rates have begun to stabilize, consumer loan rates are still elevated and hindering consumers from buying homes to cars.

Source: U.S. Treasury

Average Auto Loan Amounts Head Lower – Consumer Finance

As auto sales have decreased over the past few months, so have the prices paid for automobiles and light trucks. Recent data compiled by the Federal Reserve Bank of St. Louis show that the average amount financed for a new car loan has fallen to $38,739, down from $40,155 in September 2022.

Automobile dealerships nationwide have been accumulating larger inventories of cars and trucks, which they haven’t been able to sell as quickly as before. The disruption of supply chains and availability of auto components during the pandemic elevated prices for new and used cars very quickly amongst an environment of dismal supply.

Now with supply chains restored and product supply back on track, demand has weakened, leaving large inventories and falling prices. Even though prices have fallen, consumers are still seeing larger than average auto payments due to high interest rates. Unless rates drop, consumers may continue to hesitate buying automobiles while dealers continue to amass inventories of unsold cars.

Source: Federal Reserve Bank of St. Louis

 
S&P CoreLogic Case-Shiller U.S. home price index is up 51% since the end of 2019

Some Question Traditional Stock Market Indicator – Equity Analysis

The Dow Theory has been an indicator of the stock market for over 100 years, with a specific attention to transportation. It originated with a simple notion, that the Dow Transportation Index follows the Dow Jones Industrial Index. This is so because whatever the underlying 30 companies in the Dow Jones Index manufacture and produce, is ultimately shipped and transported to consumers and stores nationwide.

Market analysts have closely followed any disparities between the two indices for decades, trying to identify any lag or disconnect. Such a disparity has appeared recently, which may be an indicator of things to come. The divergence between the DJTA and the DJIA can be significant for market analysts and investors. According to the Dow Theory, the performance of the transportation sector (DJTA) should confirm the trends seen in the industrial sector (DJIA). If the two indices diverge, it may signal potential economic issues. For instance, if the DJIA is rising while the DJTA is falling, it could indicate that goods are being produced but not transported at the same rate, suggesting a potential slowdown in economic activity.

As of May 29, 2024, the DJTA was at 14,781.56, down by 213.56 points or 1.42% from the previous close. This reflects a year-to-date change of -7.03% and a 1-year change of 6.32%.
The DJIA, in contrast, had a year-to-date change of -2% and a 1-year change of 16.16%. Historically, this disparity in returns is greater than it has been.

Various factors may create or alter the performance of the Transportation Index, such as elevated fuel costs, weather, or logistical issues. Another factor has evolved more recently, whereas the believe that the U.S. economy has transformed into a more service oriented economy with non tangible products such as software platforms, not needing physical transportation or delivery. Incidentally, the objective results of any disparities have become much more subjective as analysts deduce varying reasons for disparities. (Sources: Dow Jones, Bloomberg)

Federal Reserve Says Homes Are 25% Overvalued – Housing Market Review

In addition to tracking inflationary pressures and wage growth, the Federal Reserve also tracks asset valuations to try to identify excessive increases. The Fed’s Financial Stability Report assesses the stability of the US financial system by also analyzing asset valuations, borrowings by businesses and households, leverage and funding risks.

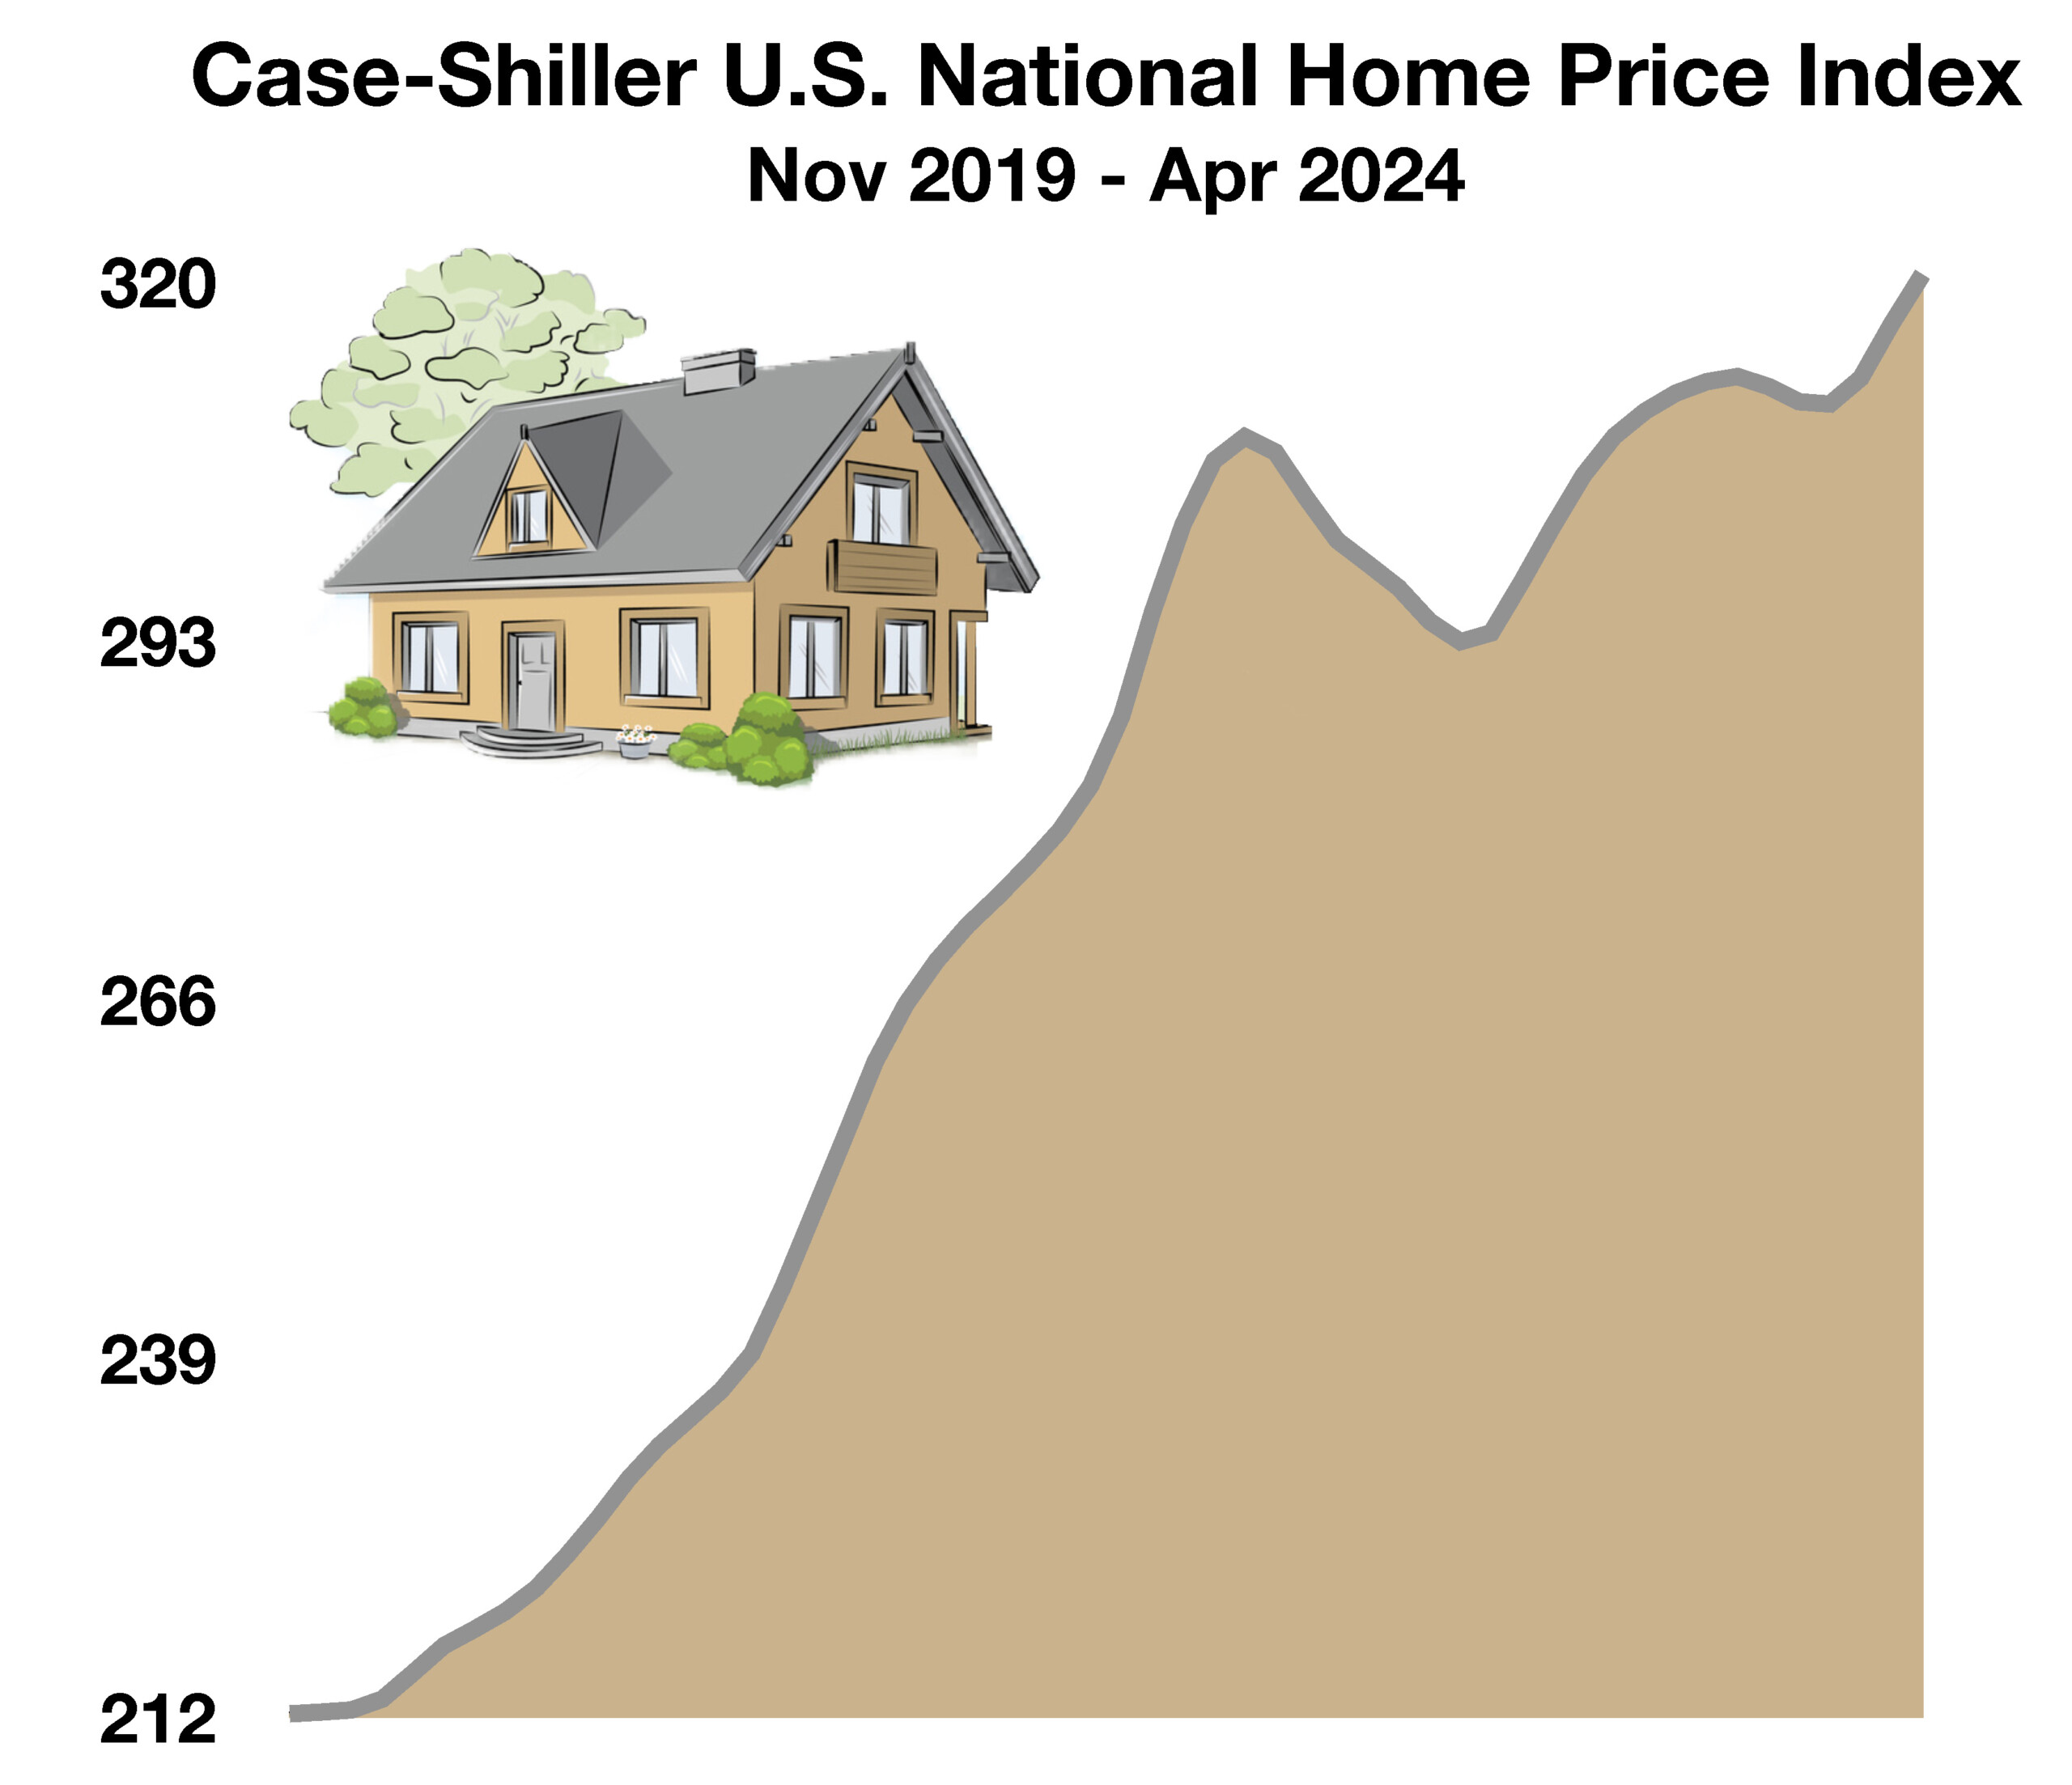
A model used in valuing residential home values found that homes are now 25% overvalued, just below the 28% peak in 2007. Using the Labor Department’s measure of rent, home prices are 19% overvalued using private measures of market rents.The Fed also follows the S&P CoreLogic Case-Shiller U.S. national home price index, which tracks U.S. home prices nationwide. The index is up 51% since the end of 2019, an extraordinary rise relative to historical data. Another factor that is closely followed is the cost to rent versus owning. According to the Labor Department, the owner-equivalent rent is up 24% since 2019, meaning that the cost to purchase a home has risen more than the cost to rent since 2019. (Source: Federal Reserve Board of Governors)

 
The banks tested under the Federal Reserve program included 31 banks

China Is Exporting More & Making Cheap Products Cheaper – Global Trade Update

China is flooding global markets, including the U.S., with cheap exports across various industries including steel, electric vehicles, solar panels, computer chips, and other manufactured goods.

China’s factories are producing far more goods than its domestic market can absorb, leading to a glut of excess supply being exported at low prices to foreign markets such the U.S. and Europe. This overcapacity issue spans multiple sectors including steel, cars, solar panels, computer chips, and other manufactured products where China has rapidly expanded production capabilities.

China’s global trade surplus in goods has soared to around $900 billion in 2022, more than double the pre-pandemic level, indicating the scale of oversupply. Factors including China’s slowing economy, protracted property slump, and shift in consumer spending patterns have exacerbated the overcapacity problem.

The U.S., European Union and other trading partners accuse China of unfair trade practices such as subsidies, intellectual property theft, and forced technology transfers that have enabled the overcapacity trend. China’s government has been subsidizing Chinese companies in order to export more competitively and aggressively.

The current U.S. administration announced major tariff hikes on $18 billion worth of Chinese imports including electric vehicles, solar cells, semiconductors, and some medical supplies to counter the inflow of subsidized Chinese products.The prior administration imposed tariffs of 25% on $300 billion worth of Chinese goods in order to stem the import of such products from China. (Sources: IMF, whitehouse.gov)

Banks Get A Stress Test & Pass – Banking Sector Review

The Federal Reserve reported in June that results of its annual bank stress test showed the largest U.S. banks and lenders have sufficient capital to withstand an economic catastrophe, while noting that pockets of risks are growing on some bank balance sheets.

The Fed identified increases with bank credit card balances as well as higher delinquency rates prompting higher projected credit card losses. The report also found that bank corporate credit card portfolios are growing riskier, and a combination of higher expenses and lower fee income are factors behind those losses. The banks tested under the Federal Reserve program included 31 banks, among them the largest U.S. banks to midsize regional banks and lenders. Commercial real estate exposure, which has become a growing concern, is a primary issue among smaller and midsize regional banks throughout the country. This year’s hypothetical scenario was broadly comparable to the scenario in 2023, yet also included a severe global recession, a 40% decline in commercial real estate prices, a 36% drop in home values, and the unemployment rate rising to 10%. (Source: Federal Reserve Board of Governors)