Ocean Park Capital Management

2503 Main Street

Santa Monica, CA 90405

Main: 310.392.7300

Daily Performance Line:  310.281.8577

June 2024
Market Update
(all values as of 06.28.2024)

Stock Indices:

Dow Jones 39,118
S&P 500 5,460
Nasdaq 17,732

Bond Sector Yields:

2 Yr Treasury 4.71%
10 Yr Treasury 4.36%
10 Yr Municipal 2.86%
High Yield 7.58%

YTD Market Returns:

Dow Jones 3.79%
S&P 500 14.48%
Nasdaq 18.13%
MSCI-EAFE 3.51%
MSCI-Europe 3.72%
MSCI-Pacific 3.05%
MSCI-Emg Mkt 6.11%
 
US Agg Bond -0.71%
US Corp Bond -0.49%
US Gov’t Bond -0.68%

Commodity Prices:

Gold 2,336
Silver 29.43
Oil (WTI) 81.46

Currencies:

Dollar / Euro 1.06
Dollar / Pound 1.26
Yen / Dollar 160.56
Canadian /Dollar 0.73

Portfolio Overview

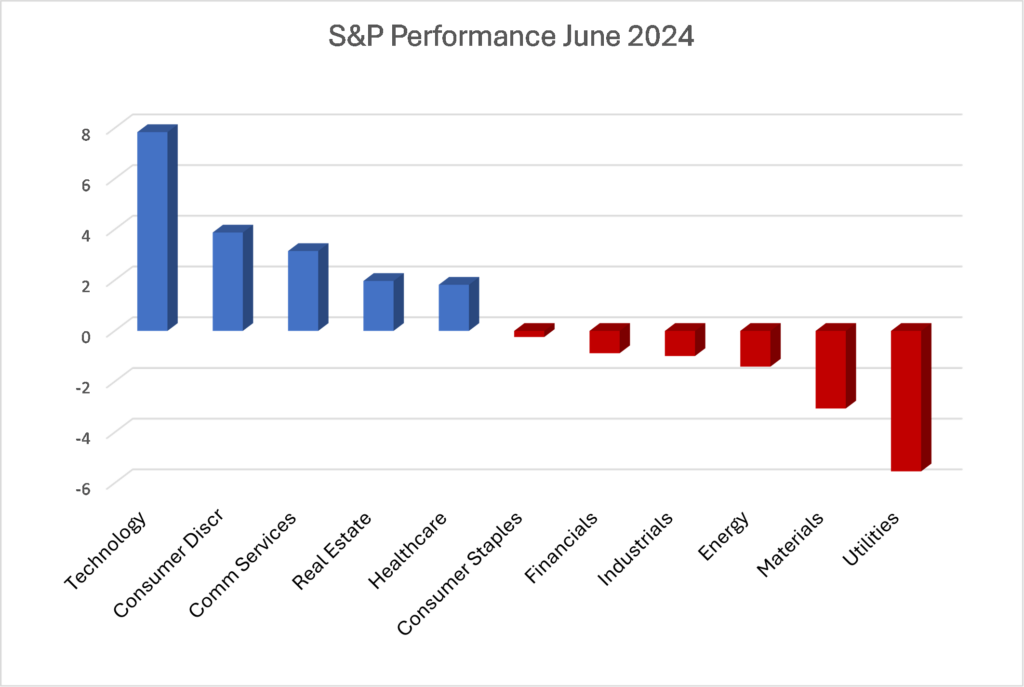
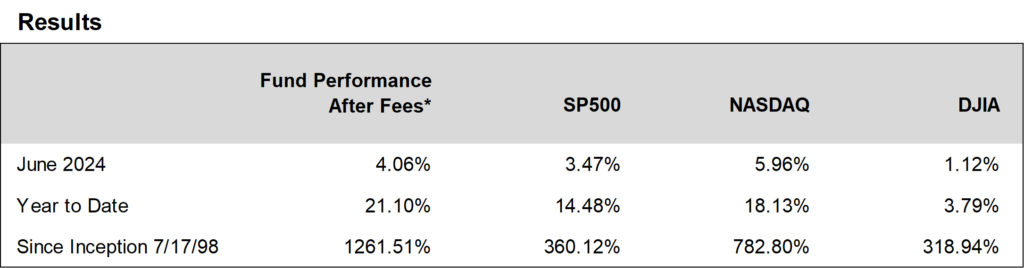
Ocean Park Investors Fund rose 4.06%* in June, while the S&P 500 rose 3.47% and the NASDAQ Composite rose 5.96%. The fund’s technology holdings led the way as Adobe and Broadcom each gained over 20% and numerous other tech positions posted double-digit gains.

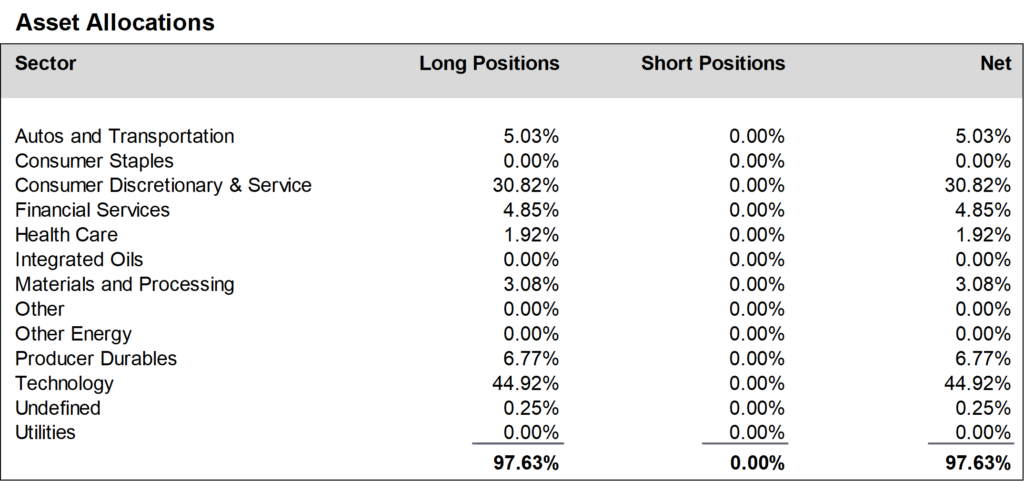
During June, we increased positions in the technology sector and the producer durables sector and reduced positions in the SPY and QQQ ETFs. Portfolio changes included the sales of Celsius Holdings, Eaton, and PayPal and the purchases of Emerson Electric, Taiwan Semiconductor, Trade Desk, and Trane Technologies. We finished the month at about 98% net long, unchanged from May.


Daily updates on our activity are available on our Results Line, at 310-281-8577, and current information is also maintained on our website at www.oceanparkcapital.com. To gain access to the site enter password opcap.

*These results are pro forma. Actual results for most investors will vary. See additional disclosures on page 4. Past performance does not guarantee future results.


Equity Overview

Equity Overview

Five of eleven sectors in the S&P 500 rose in June with technology the strongest, while six sectors lost ground with utilities the weakest.  Growth outpaced value.  Volatility was benign, as the S&P 500 moved more than 1% on only 1 of 19 trading days.

The so-called Magnificent 7 (Alphabet, Amazon, Apple, Meta, Microsoft, Nvidia, and Tesla) accounted for 79% of the June gain in the S&P 500. And Nvidia became the largest publicly traded company in the world.


Macro Overview

Macro Overview

Economic headlines in June were generally uninspiring.  Housing, durable goods, and retail sales were weak.  Consumer confidence declined.  Job growth was strong but unemployment ticked up to 4%.

The Commerce Department’s final computation of GDP growth in the first quarter was 1.4%, slightly above the previous estimate of 1.3%.

The Fed met at mid-month and declined to cut interest rates.  However, at month’s end the PCE chain price index—which is the Fed’s preferred inflation measure—showed an annualized decline from 2.7% to 2.6%.  This was still above the Fed’s target of 2% but suggested a downward trend which encouraged market sentiment for an interest rate cut at the September meeting.


Additional Disclosures

Additional Disclosures

Performance data for OPI reflect the reinvestment of dividends and other earnings on the fund’s assets.  Performance data for the major indices reflect only changes in the value of those indices, and would be higher if dividends were included. However, the index data do not reflect fees that would be paid to index fund managers and transaction costs that would be incurred when their component stocks are bought or sold, while OPI’s data do reflect quarterly fees and expenses incurred by the fund.  The information provided is believed to be reliable, but its accuracy or completeness is not warranted. This material is not intended as an offer or solicitation for the purchase or sale of any stock, bond, mutual fund, or any other financial instrument. The views and strategies discussed herein may not be appropriate and/or suitable for all investors. This material is meant solely for informational purposes, and is not intended to suffice as any type of accounting, legal, tax, or estate planning advice. Any and all forecasts mentioned are for illustrative purposes only and should not be interpreted as investment recommendations.