Ocean Park Capital Management
2503 Main Street
Santa Monica, CA 90405
Main: 310.392.7300
Daily Performance Line: 310.281.8577
Dow Jones | 44,094 |
S&P 500 | 6,204 |
Nasdaq | 20,369 |
2 Yr Treasury | 3.72% |
10 Yr Treasury | 4.24% |
10 Yr Municipal | 3.21% |
High Yield | 6.80% |
Dow Jones | 3.64% |
S&P 500 | 5.50% |
Nasdaq | 5.48% |
MSCI-EAFE | 17.37% |
MSCI-Europe | 20.67% |
MSCI-Pacific | 11.15% |
MSCI-Emg Mkt | 13.70% |
US Agg Bond | 4.02% |
US Corp Bond | 4.17% |
US Gov’t Bond | 3.95% |
Gold | 3,319 |
Silver | 36.32 |
Oil (WTI) | 64.98 |
Dollar / Euro | 1.17 |
Dollar / Pound | 1.37 |
Yen / Dollar | 144.61 |
Canadian /Dollar | 0.73 |
Ocean Park Investors Fund generated robust returns in June, gaining 6.34%* while the S&P 500 gained 4.96% and the NASDAQ Composite gained 6.57%. The fund’s results reflected continued strength in our technology holdings, particularly semiconductor stocks, as Nvidia and Taiwan Semiconductor each rose 17% and Broadcom rose 14%.
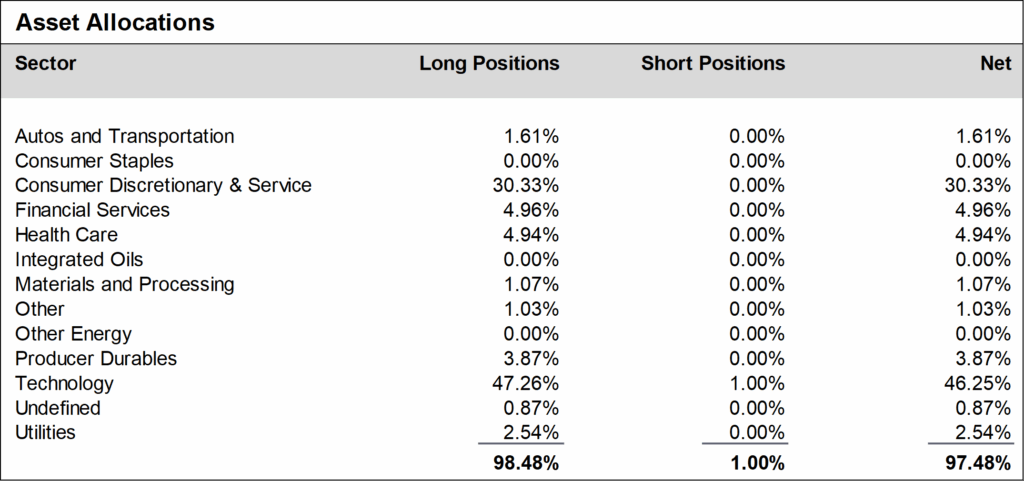
During June, we increased exposure to the producer durables sector and reduced allocation to health care stocks. Notable portfolio adjustments included the addition of Honeywell, Uber and MasTec and the sale of Moody’s, State Street and Ralph Lauren. We ended the month approximately 97% net long, unchanged from May.
Daily updates on our activity are available on our Results Line, at 310-281-8577, and current information is also maintained on our website at www.oceanparkcapital.com. To gain access to the site enter password opcap.
*These results are pro forma. Actual results for most investors will vary. See additional disclosures on page 4. Past performance does not guarantee future results.
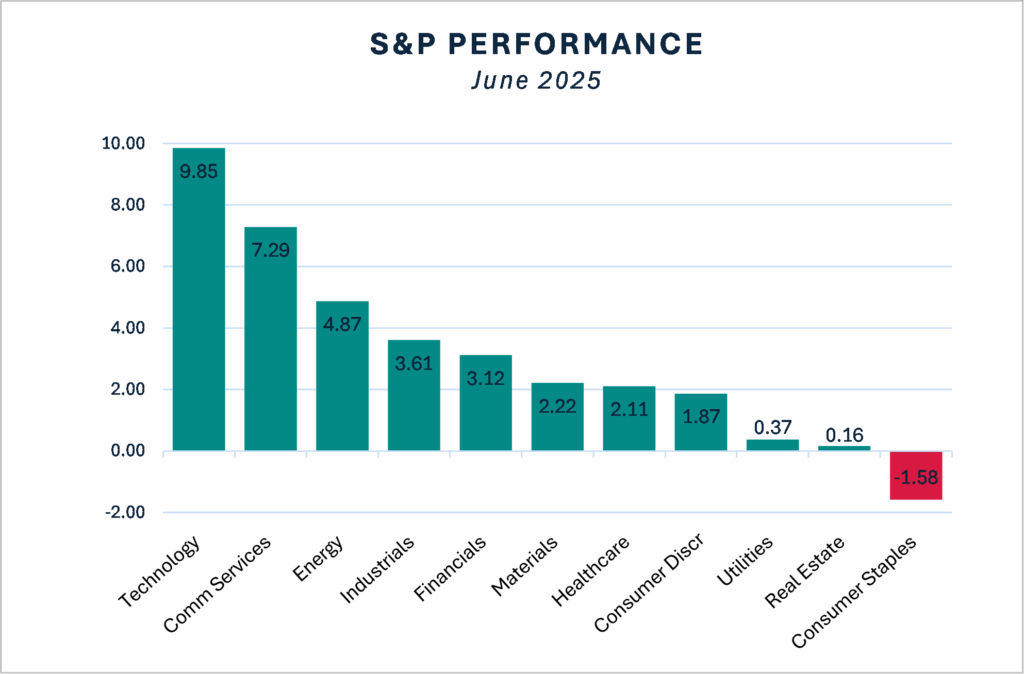
Both the S&P 500 and the NASDAQ Composite reached new highs as U.S. equities extended their rally in June. Ten of the eleven S&P sectors posted gains, with technology leading the way and consumer staples the only loser. Growth stocks outperformed value, a continuation of the trend from April and May. Volatility was modest as the S&P moved more than 1% on just 3 of 21 trading days.
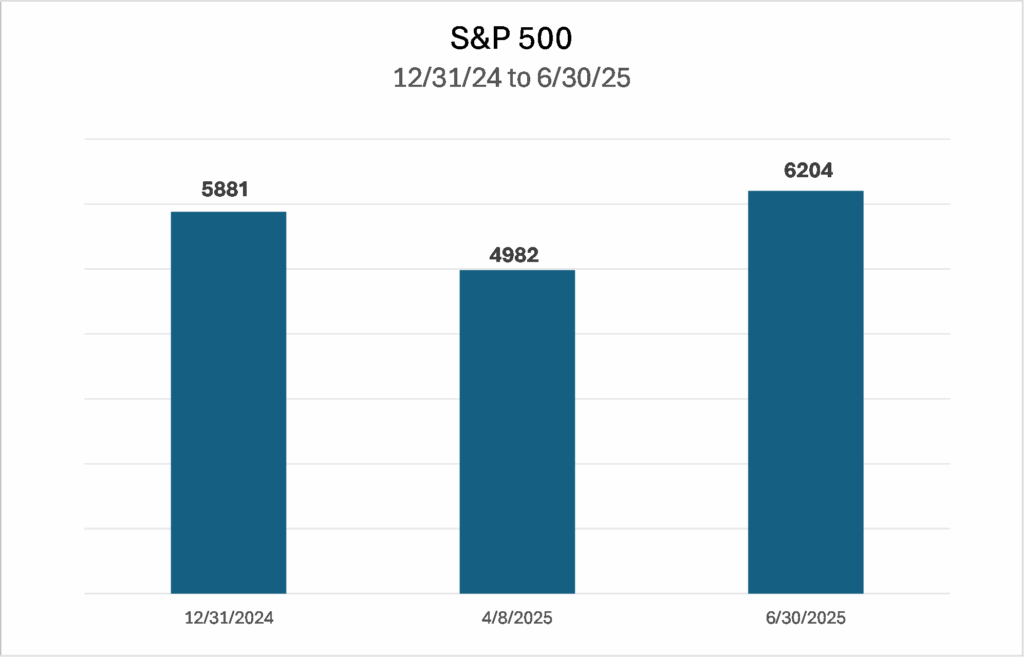
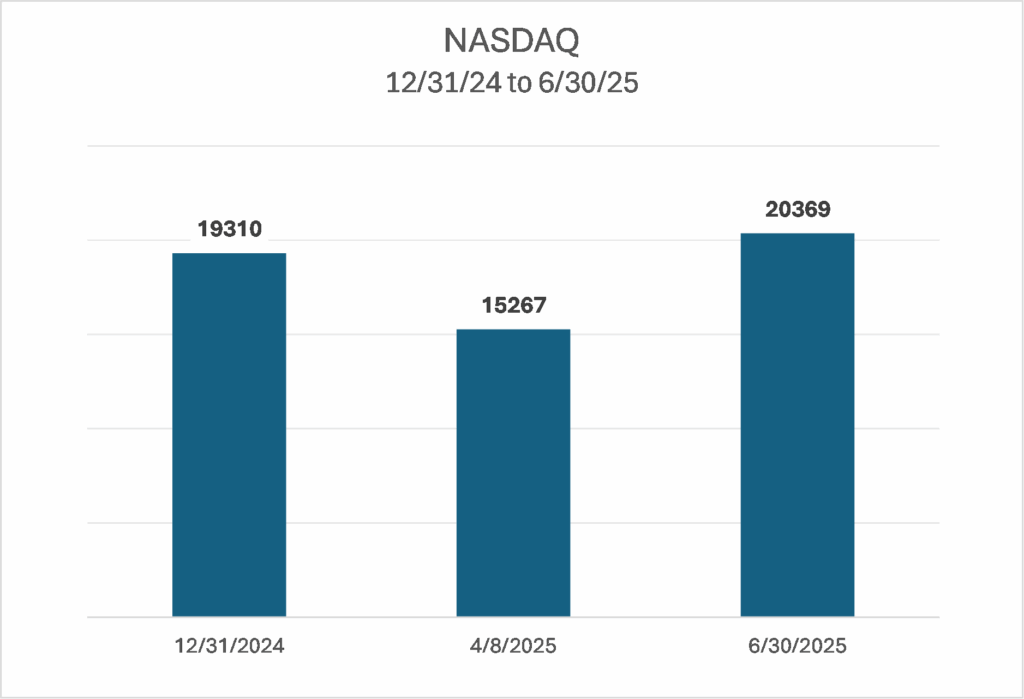
Market action in the second quarter was extraordinary. At its low on April 8, the S&P 500 was down 15% for the year. At its high on June 30, it had rebounded by 24% . The NASDAQ Composite performance was even more dramatic: down 21% at the low, with a subsequent rebound of 34%. While tech stocks led the recovery, industrials and financials also hit new highs. This suggests some strength in the broader economy despite tariff flip-flops and other policy uncertainties in Washington.
June saw an increase in U.S. steel and aluminum tariffs from 25% to 50%, a deal with China for a 90-day pause, and the termination of trade talks with Canada. Many of the tariffs have been ruled illegal by the courts, and the government’s appeal will be heard on July 31. We may get some resolution at that time.
Other economic headlines in June were mixed. Positives included solid labor market data, unemployment near historic lows, mild inflation, and the best consumer sentiment in six months. But retail sales, manufacturing, and housing were sluggish, and first quarter GDP was revised lower to a -0.5% contraction rate, the weakest in three years. The Fed kept interest rates unchanged and analysts see no rate reductions until September at the earliest.
As the summer progresses, investors will be closely watching further developments in trade policy, inflation trends, and the upcoming earnings season—all of which could influence market direction in the months ahead.
Performance data for OPI reflect the reinvestment of dividends and other earnings on the fund’s assets. Performance data for the major indices reflect only changes in the value of those indices, and would be higher if dividends were included. However, the index data do not reflect fees that would be paid to index fund managers and transaction costs that would be incurred when their component stocks are bought or sold, while OPI’s data do reflect quarterly fees and expenses incurred by the fund. The information provided is believed to be reliable, but its accuracy or completeness is not warranted. This material is not intended as an offer or solicitation for the purchase or sale of any stock, bond, mutual fund, or any other financial instrument. The views and strategies discussed herein may not be appropriate and/or suitable for all investors. This material is meant solely for informational purposes, and is not intended to suffice as any type of accounting, legal, tax, or estate planning advice. Any and all forecasts mentioned are for illustrative purposes only and should not be interpreted as investment recommendations.