
Ocean Park Capital Management

2503 Main Street

Santa Monica, CA 90405

Main: 310.392.7300

Daily Performance Line:  310.281.8577

June 2026
Market Update
(all values as of 06.30.2026)

Stock Indices:

Dow Jones 52,319
S&P 500 7,499
Nasdaq 26,213

Bond Sector Yields:

2 Yr Treasury 4.14%
10 Yr Treasury 4.44%
10 Yr Municipal 2.89%
High Yield 6.99%

YTD Market Returns:

Dow Jones 8.85%
S&P 500 9.55%
Nasdaq 12.79%
MSCI-EAFE 7.74%
MSCI-Europe 5.92%
MSCI-Far East 12.84%
MSCI-Emg Mkt 22.68%
 
US Agg Bond 0.61%
US Corp Bond 0.85%
US Gov’t Bond 0.49%

Commodity Prices:

Gold 4,010
Silver 58.85
Oil (WTI) 70.08

Currencies:

Dollar / Euro 1.14
Dollar / Pound 1.32
Yen / Dollar 161.86
Canadian /Dollar 0.70
 

Portfolio Overview

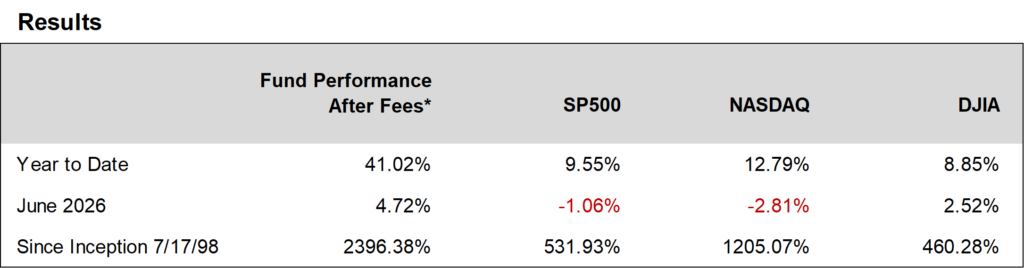
Ocean Park Investors Fund gained 4.72%* in June, while the S&P 500 fell 1.06% and the NASDAQ Composite declined 2.81%. Year to date, the fund has returned 41.02%*, compared to 9.55% for the S&P 500 and 12.79% for the NASDAQ.

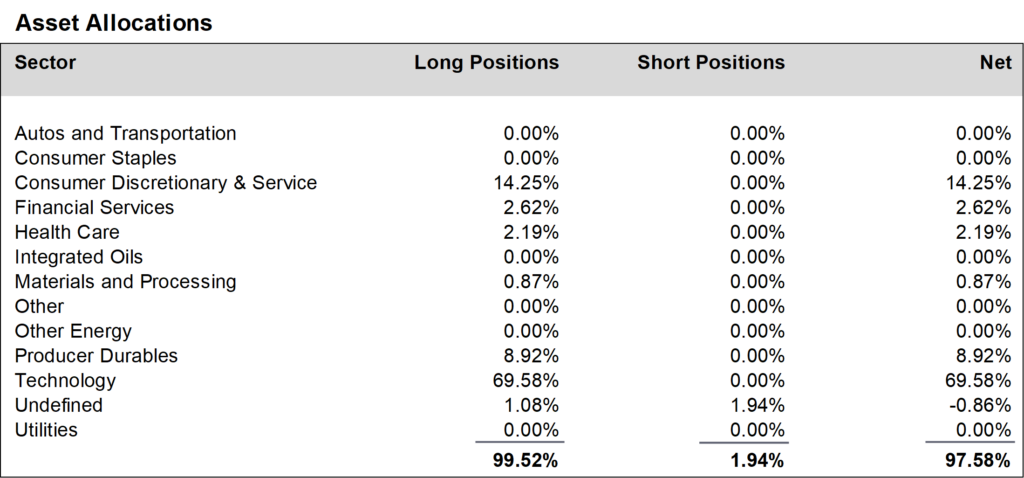
Continued momentum in memory and data storage stocks drove the fund’s outperformance, propelled by the quarterly earnings report from Micron Technology:  revenue of $41.5 billion, more than quadrupling from $9.3 billion a year earlier; and guidance for the coming quarter of approximately $50 billion, which exceeded analyst expectations by a wide margin. These stunning results triggered a broad rally across the memory complex, with portfolio stocks Western Digital, Seagate Technology, and Sandisk (among others) all advancing significantly on the news. This reinforced what we have believed since early in the year: that the demand for AI memory is not a short-cycle phenomenon but rather a multi-year structural shift.  While there is likely to be substantial volatility along the way, it appears that upside is supported by long-term supply agreements with the world’s largest hyperscalers.
 

Daily updates on our activity are available on our Results Line, at 310-281-8577, and on our website at www.oceanparkcapital.com. Enter password opcap.

*These results are pro forma. Actual results for most investors will vary. Additional disclosures on page 4. Past performance does not guarantee future results.


 
Equity Overview

Equity Overview

The broader market struggled in June, weighed down by rising inflation data, a hawkish shift from the Federal Reserve, and continued uncertainty around the Iran conflict.  Six of eleven sectors in the S&P 500 rose in June, with industrials the best sector and communication services the weakest.  Notwithstanding the dramatic performance of the memory subsector, growth stocks generally underperformed value.  Volatility was noteworthy, as the S&P 500 moved more than 1% on 8 of 21 trading days.

Despite the monthly setback for the broader market, the quarter was outstanding as the S&P 500 rose 14.9% and the Nasdaq Composite surged 21.4%–their best quarterly performances since 2020.  And those results were dwarfed by the Philadelphia Semiconductor Index which had its best quarter ever, up 87.8%.


Macro Overview

Macro Overview

June presented investors with a challenging combination of strong corporate earnings and increasingly difficult macroeconomic conditions. May CPI came in at 4.2% year-over-year, the hottest reading since early in the Iran conflict.  Core PCE inflation was revised upward to 3.3% for 2026 in the Fed’s latest projections, well above its 2% target and above levels seen at the start of the year.

The new Fed Chairman Kevin Warsh led his first Open Market Committee meeting on June 16–17, and it marked a sea change from the Powell years.  Warsh scrapped the Fed’s traditional forward guidance entirely and announced five working groups to review communications, balance sheet policy, data methodology, and the inflation framework — a substantial overhaul signaling a more data-dependent and less predictable approach to policy.  While the Fed held rates steady at 3.50–3.75%, it delivered a starkly more hawkish message than markets expected. Nine of 18 committee members projected a rate hike in 2026, up from zero at the prior meeting. Following the meeting, futures markets reflected a 49% probability of a rate hike by September.

Progress on U.S.-Iran peace talks in Doha, while fragile and incomplete, pushed oil prices lower with the benchmark WTI settling near $69.50 per barrel by month-end.  This represented a further decline from May’s close near $91 and approached pre-conflict levels. Gold fell to approximately $4,026 per ounce, its lowest level since September 2025, reflecting higher real yields and a somewhat reduced safe-haven bid as geopolitical risks eased.


Additional Disclosures

Additional Disclosures

Performance data for OPI reflect the reinvestment of dividends and other earnings on the fund’s assets.  Performance data for the major indices reflect only changes in the value of those indices, and would be higher if dividends were included. However, the index data do not reflect fees that would be paid to index fund managers and transaction costs that would be incurred when their component stocks are bought or sold, while OPI’s data do reflect quarterly fees and expenses incurred by the fund.  The information provided is believed to be reliable, but its accuracy or completeness is not warranted. This material is not intended as an offer or solicitation for the purchase or sale of any stock, bond, mutual fund, or any other financial instrument. The views and strategies discussed herein may not be appropriate and/or suitable for all investors. This material is meant solely for informational purposes, and is not intended to suffice as any type of accounting, legal, tax, or estate planning advice. Any and all forecasts mentioned are for illustrative purposes only and should not be interpreted as investment recommendations.