Stock Indices:
| Dow Jones | 44,094 |
| S&P 500 | 6,204 |
| Nasdaq | 20,369 |
Bond Sector Yields:
| 2 Yr Treasury | 3.72% |
| 10 Yr Treasury | 4.24% |
| 10 Yr Municipal | 3.21% |
| High Yield | 6.80% |
YTD Market Returns:
| Dow Jones | 3.64% |
| S&P 500 | 5.50% |
| Nasdaq | 5.48% |
| MSCI-EAFE | 17.37% |
| MSCI-Europe | 20.67% |
| MSCI-Pacific | 11.15% |
| MSCI-Emg Mkt | 13.70% |
| US Agg Bond | 4.02% |
| US Corp Bond | 4.17% |
| US Gov’t Bond | 3.95% |
Commodity Prices:
| Gold | 3,319 |
| Silver | 36.32 |
| Oil (WTI) | 64.98 |
Currencies:
| Dollar / Euro | 1.17 |
| Dollar / Pound | 1.37 |
| Yen / Dollar | 144.61 |
| Canadian /Dollar | 0.73 |
 Macro Overview
The ongoing trade dispute between the U.S. and China escalated in May as the U.S. signaled that it had not finalized a deal yet with China. The lack of a deal led to the U.S. announcing an increase in tariffs from 10 percent to 25 percent on $200 billion of Chinese imports.
The U.S. Department of Commerce began assessing Chinese imports arriving at U.S. ports with a 25% tariff at 12:01 AM on June 1st. The tariff increase affects a broad range of imported products, including modems, routers, furniture, and vacuum cleaners. Additional tariffs were also proposed by The Office of the United States Trade Representative on essentially all remaining imports from China, valued at about $300 billion.
The proposed tariff increases by the United States caused China to retaliate against the U.S. with its own tariff proposals on U.S. goods including alcohol, swimsuits, and liquefied natural gas (LNG). The Chinese government may apply additional tariffs to more meaningful products including food, energy and aircraft products from the U.S.
The recent market downturn has primarily been due to the uncertainty of the trade disputes and the effects of tariffs on the U.S. and international economies. Analysts believe that the equity market pullback along with the pending trade disputes have raised the possibility of an interest rate cut by the Federal Reserve later this year.
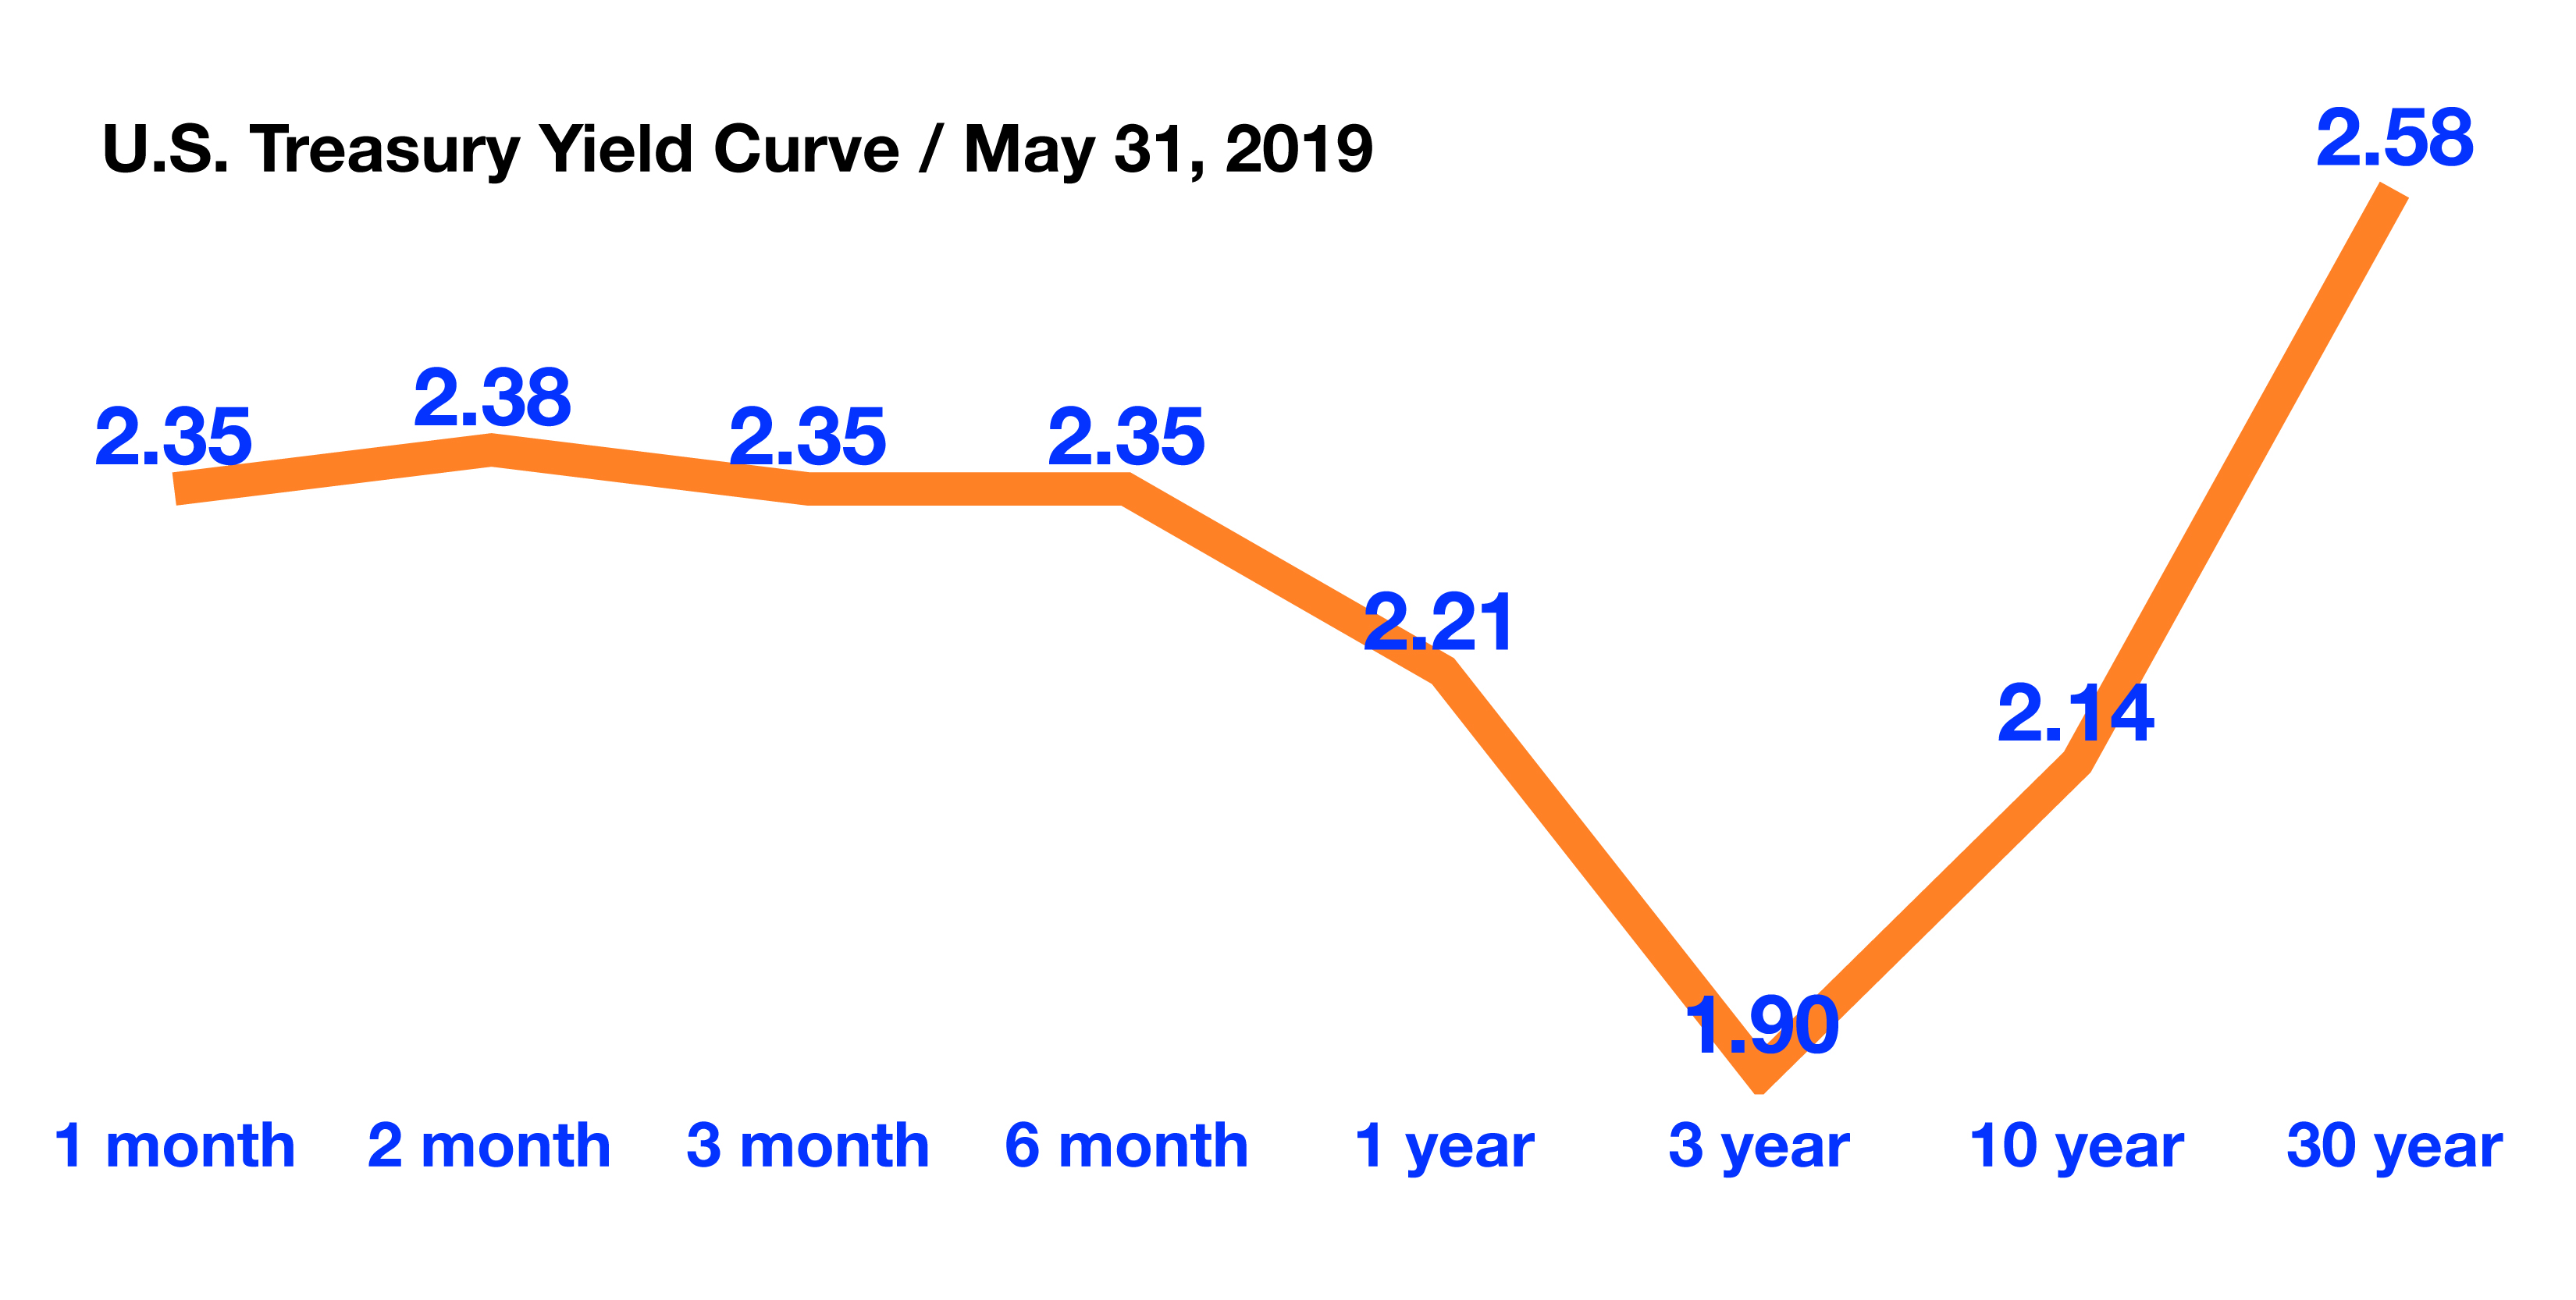
Longer term U.S. Treasury bond yields fell to their lowest levels since 2017. Combined pressures from the trade disputes to the pending Brexit turmoil in Europe has fostered increasing demand for U.S. Treasury bonds, which has resulted in higher bond prices. The fixed income market is looking at the probability that economic weakness will lead to the Federal Reserve to actually cut interest rates sometime this year in order to bolster the U.S. economy. Many believe that the Fed needs to move quickly in order to shore up growth at the first sign of any economic contraction.
Mortgage rates fell below 4% for the first time since early last year helping to stabilize housing market activity. The average mortgage rate on a 30-year fixed conforming loan was 3.99% at the end of May, as tracked by Freddie Mac, the lowest since January 2018. Falling mortgage rates tend to entice buyers to sell their homes and trade up to larger homes with bigger mortgage balances, a boom for the housing market.
The most recent unemployment data revealed that unemployment unexpectedly fell to a 50 year low this past month to 3.6 percent, the lowest since 1969. Historically, a low unemployment rate tends to drive consumer confidence higher and act as a buffer during economic uncertainty.
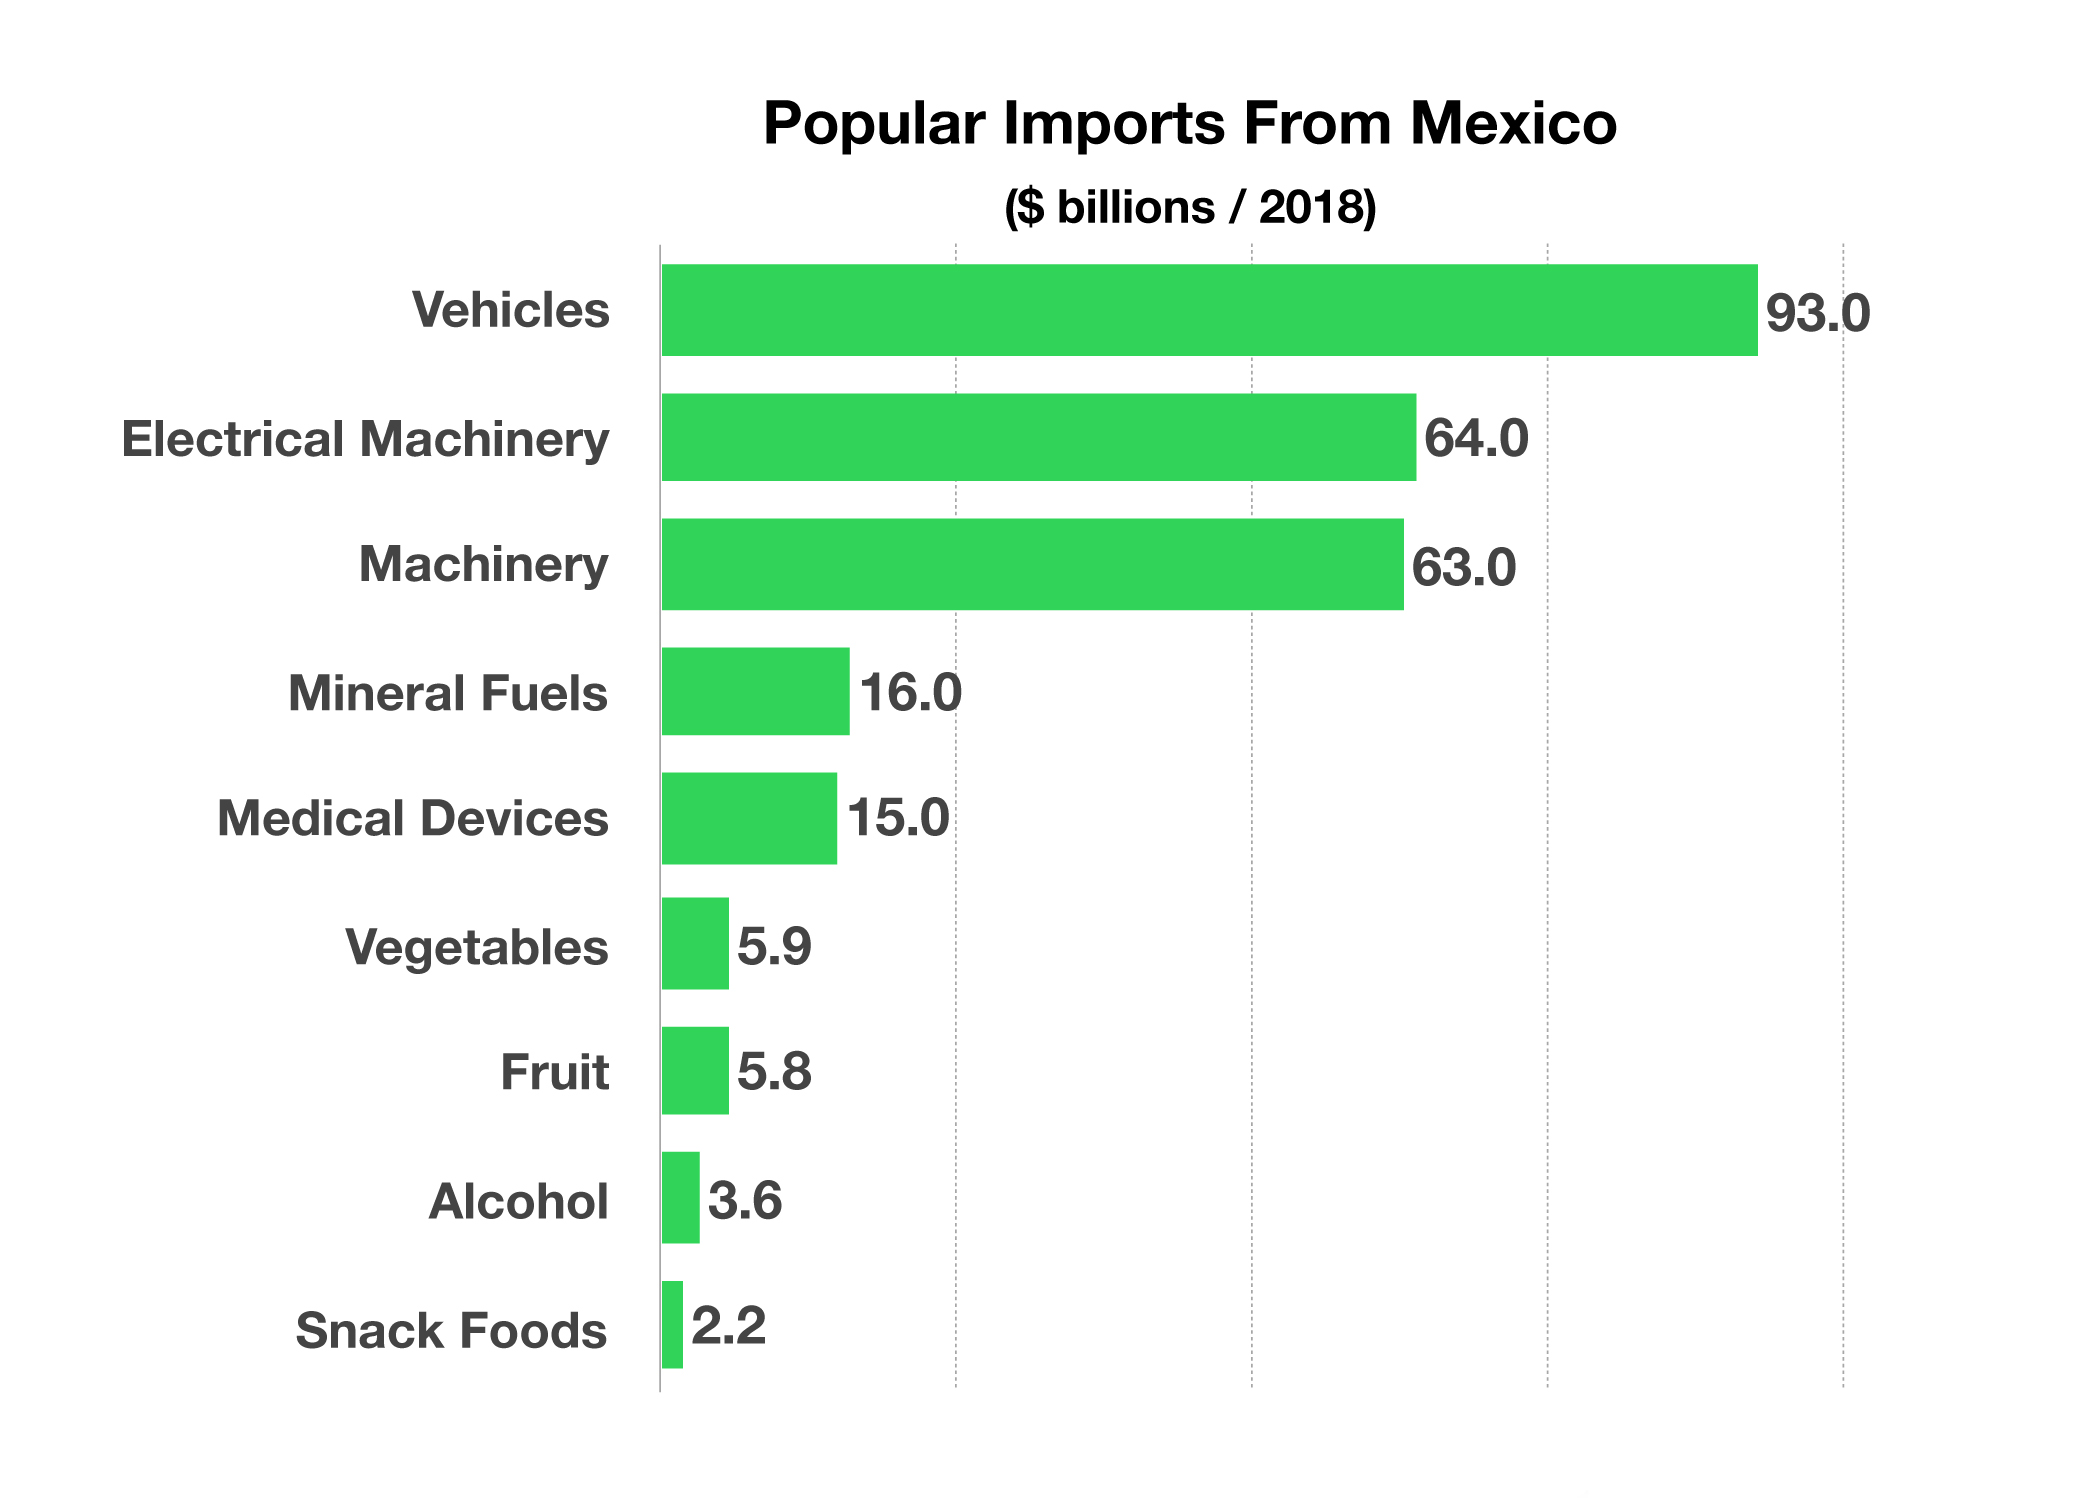
Canada, Mexico, and the United States introduced legislation that would replace the North American Free Trade Agreement (NAFTA) and establish a new trade treaty among the three countries to be referred as the U.S.-Mexico-Canada Agreement (USMCA). Existing tariffs on steel and aluminum imports from Canada would be eradicated. Canada is the second largest foreign supplier of steel and aluminum to the United States. (Sources: Dept. of Commerce, Treasury Dept., Freddie Mac, IMF)
 In stark contrast to the strong performance during the first four months of 2019, U.S. equities faltered in May as continued trade disputes hindered economic growth expectations. All sectors of the S&P 500 Index fell in May, with the exception of Real Estate. Technology and financial stocks experienced the brunt of the pullback in May.
 Down Trash – Environmental Fact
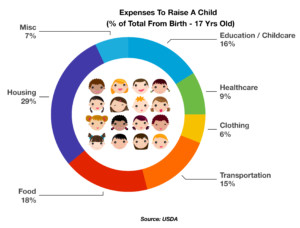 Since 1960, the U.S. Department of Agriculture (USDA) has provided estimates of expenditures related to raising a child from birth to age 17. Related expenses range from food and housing to education and medical care. The USDA closely follows and identifies the various incomes for families, as well as the number of children in families. What it has determined over the past 55 years of collecting data is that families with different incomes spend differently on their children. In addition, single parent families spend less than dual parent families who have the ability to afford greater expenses in raising children. Certain expenses rise as children grow older no matter what income group a family might be part of. These expenses include food, transportation, clothing, and health care expenses. As children grow, they tend to eat more as well as spend more on transportation once they start commuting to more activities at ages 15-17. Childcare and medical expenses were generally higher for children under the age of 6.
 Here’s What The U.S. Buys The Most Of From China – Trade Overview
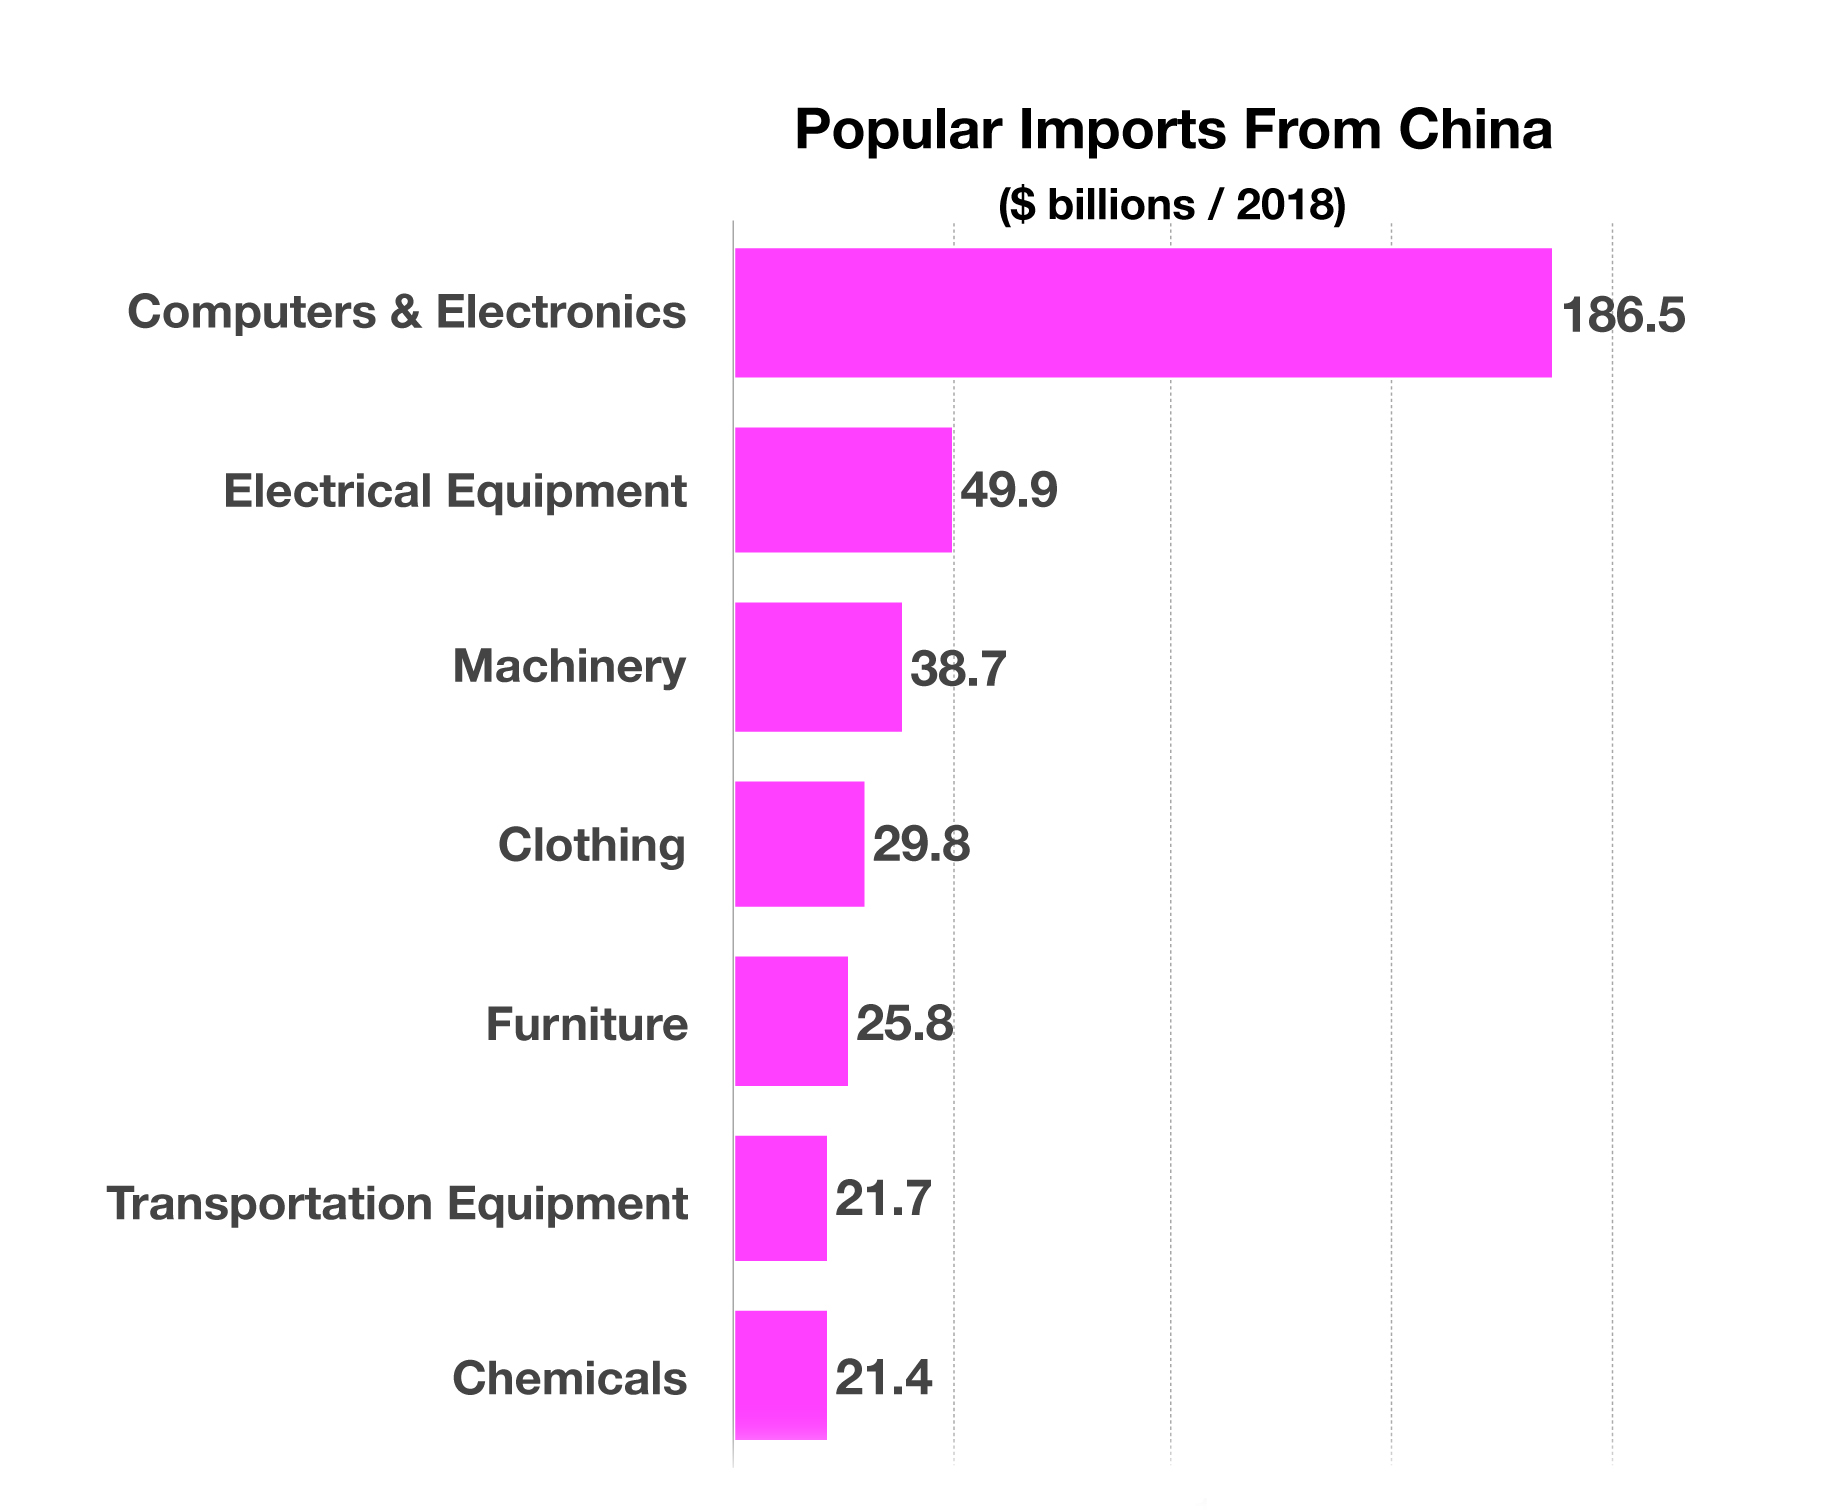 As the world’s appetite for electronic devices has grown, so has China’s ability to manufacture and export these devices. As a product exporter, China is able to manufacture and export finished products worldwide. In addition, China is also an exporter of components, which may be used in the manufacture and assembly of products in other countries, such as the United States. By exporting components in addition to finished products, China is able to hedge against tariff issues and labor costs should they become a factor. (Sources: WTO, IMF, U.S. Dept. of Commerce)