Ocean Park Capital Management

2503 Main Street

Santa Monica, CA 90405

Main: 310.392.7300

Daily Performance Line:  310.281.8577

May 2019
Market Update
(all values as of 06.28.2024)

Stock Indices:

Dow Jones 39,118
S&P 500 5,460
Nasdaq 17,732

Bond Sector Yields:

2 Yr Treasury 4.71%
10 Yr Treasury 4.36%
10 Yr Municipal 2.86%
High Yield 7.58%

YTD Market Returns:

Dow Jones 3.79%
S&P 500 14.48%
Nasdaq 18.13%
MSCI-EAFE 3.51%
MSCI-Europe 3.72%
MSCI-Pacific 3.05%
MSCI-Emg Mkt 6.11%
 
US Agg Bond -0.71%
US Corp Bond -0.49%
US Gov’t Bond -0.68%

Commodity Prices:

Gold 2,336
Silver 29.43
Oil (WTI) 81.46

Currencies:

Dollar / Euro 1.06
Dollar / Pound 1.26
Yen / Dollar 160.56
Canadian /Dollar 0.73

Fund Overview

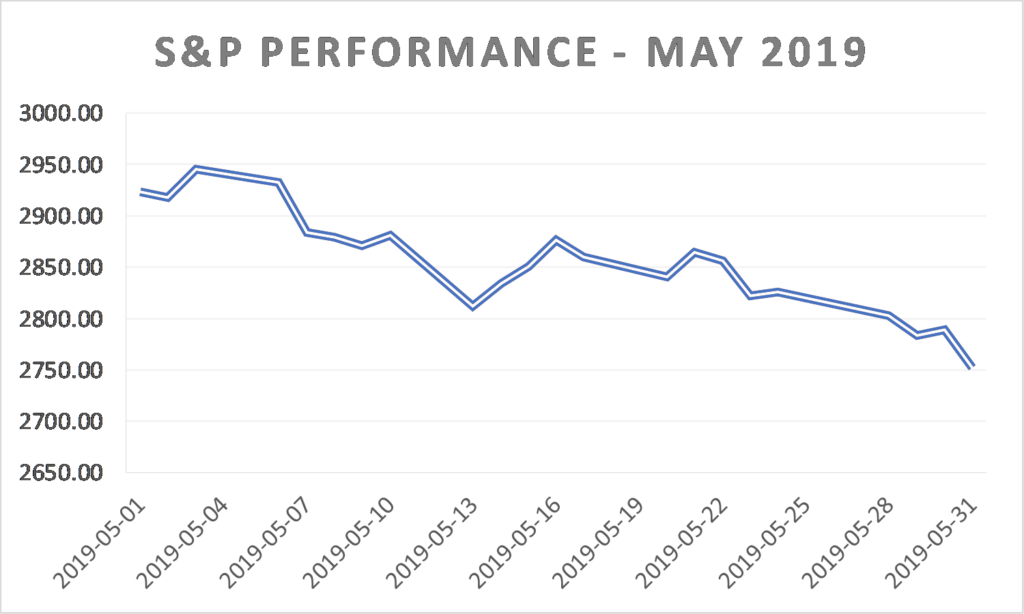
Equities declined broadly in May, and the Ocean Park funds followed suit.  Technology and consumer stocks were particularly hard-hit.  Nonetheless, we outperformed the major indices for the month and we continue to outperform the HFRI Equity Hedge Index, which is up 6.37% for the year to date.

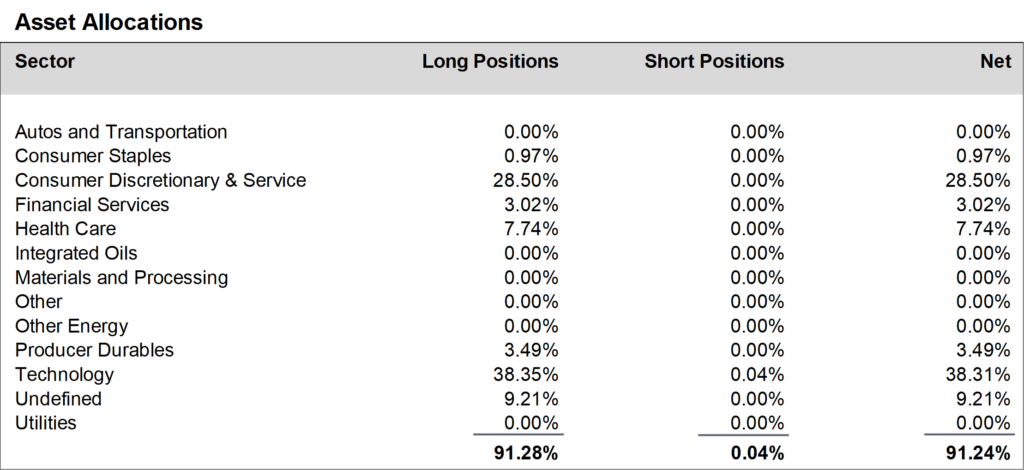
During May, we reduced positions in the health care, technology, and producer durables sectors and added to our positions in the SPY and QQQ ETFs. We ended the month at about 91% net long, up from about 90% in April.

A schedule showing the performance of the Investors Fund is included below, along with our Asset Allocation Chart. Daily updates on our activity are available on our Results Line, at
310-281-8577, and current information is also maintained on our website at www.oceanparkcapital.com. To gain access to the site enter password opcap.


*These results are pro forma. Actual results for most investors will vary. See additional disclosures on page 4. Past performance does not guarantee future results.

 
Equity Overview - May 2019

Equity Overview

The market downturn left no categories untouched, with growth and value stocks across the large, mid, and small cap spectrum all sustaining substantial losses.  The silver lining is that the forward 12-month price/earnings ratio for the S&P 500 now stands at a relatively favorable 16.1, below the 5-year average of 16.5.

First quarter corporate earnings reported in May were modest.  With 97% of S&P 500 companies reporting, the blended growth rate is now -0.4%, an improvement from the -2.3% rate in April but still disappointing in light of the strong gains in 2018.  While 76% of companies have beaten consensus earnings estimates (level with the one-year average), only 59% have beaten consensus revenue estimates, below the one-year average of 67%.


Macro Overview - May 2019

Macro Overview

Continuing the recent trend, economic data reported in May was mixed—and in some cases, contradictory.  Manufacturing was weak, but new factory orders were higher. Employment was strong but retail sales declined.  Housing starts rose but home sales fell.  On the bright side, the Commerce Department’s revised estimate of 1st quarter GDP growth was 3.1%, only modestly below its initial estimate of 3.2% and still significantly higher than projections.

Monetary policy has executed a 180-degree turn in 2019.  In January, markets had assumed there would be one more interest rate hike this year.  That shifted in April to an expectation of steady rates for the balance of the year.  Then in May, Chairman  Powell implied that the Fed would step in to support the economy if necessary, and the futures markets are now pricing in a rate cut in July.

The trade dispute with China worsened in May, as the U.S. raised tariffs on $200-billion in Chinese goods.  China responded by raising tariffs on $60-billion in U.S. goods.  There appears to be no clear path to a resolution.

In Great Britain, Teresa May finally resigned as prime minister.  Her goal of a Brexit deal acceptable to all factions of her electorate, as well as to the European Union, proved to be impossible.  It now appears that a “no-deal” or “hard” Brexit in October is likely, an eventuality which many observers believe will be highly problematic.


Additional Disclosures - May 2019

Additional Disclosures

Performance data for OPI reflect the reinvestment of dividends and other earnings on the fund’s assets.  Performance data for the major indices reflect only changes in the value of those indices, and would be higher if dividends were included. However, the index data do not reflect fees that would be paid to index fund managers and transaction costs that would be incurred when their component stocks are bought or sold, while OPI’s data do reflect quarterly fees and expenses incurred by the fund.  The information provided is believed to be reliable, but its accuracy or completeness is not warranted. This material is not intended as an offer or solicitation for the purchase or sale of any stock, bond, mutual fund, or any other financial instrument. The views and strategies discussed herein may not be appropriate and/or suitable for all investors. This material is meant solely for informational purposes, and is not intended to suffice as any type of accounting, legal, tax, or estate planning advice. Any and all forecasts mentioned are for illustrative purposes only and should not be interpreted as investment recommendations.