Ocean Park Capital Management

2503 Main Street

Santa Monica, CA 90405

Main: 310.392.7300

Daily Performance Line:  310.281.8577

May 2023
Market Update
(all values as of 06.28.2024)

Stock Indices:

Dow Jones 39,118
S&P 500 5,460
Nasdaq 17,732

Bond Sector Yields:

2 Yr Treasury 4.71%
10 Yr Treasury 4.36%
10 Yr Municipal 2.86%
High Yield 7.58%

YTD Market Returns:

Dow Jones 3.79%
S&P 500 14.48%
Nasdaq 18.13%
MSCI-EAFE 3.51%
MSCI-Europe 3.72%
MSCI-Pacific 3.05%
MSCI-Emg Mkt 6.11%
 
US Agg Bond -0.71%
US Corp Bond -0.49%
US Gov’t Bond -0.68%

Commodity Prices:

Gold 2,336
Silver 29.43
Oil (WTI) 81.46

Currencies:

Dollar / Euro 1.06
Dollar / Pound 1.26
Yen / Dollar 160.56
Canadian /Dollar 0.73

Portfolio Overview

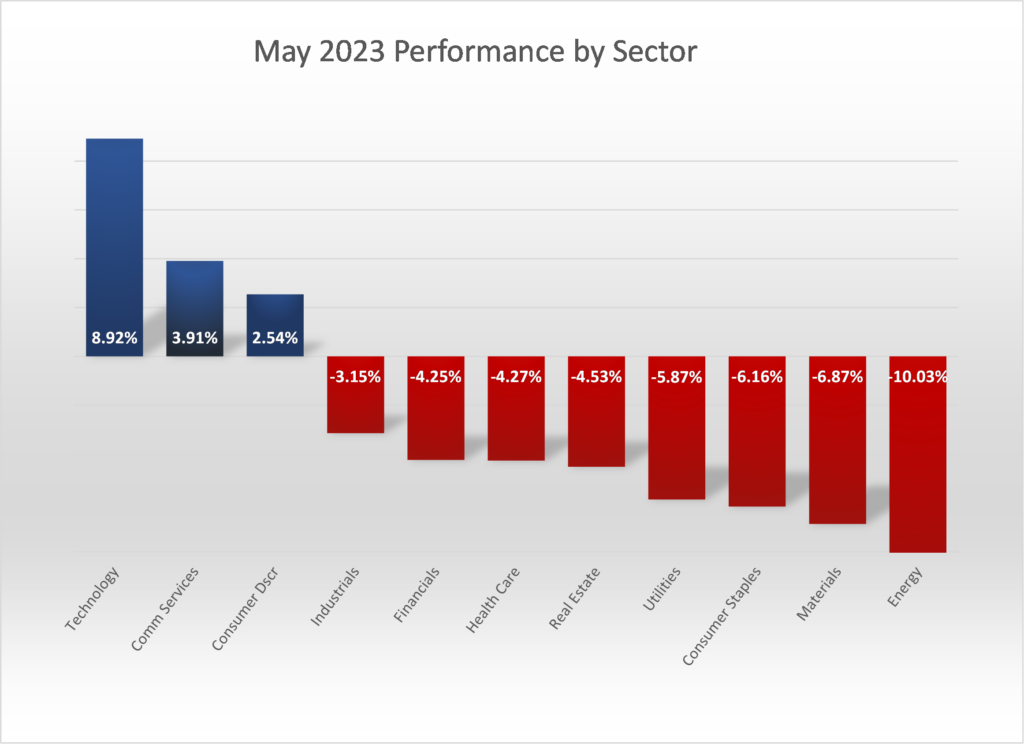
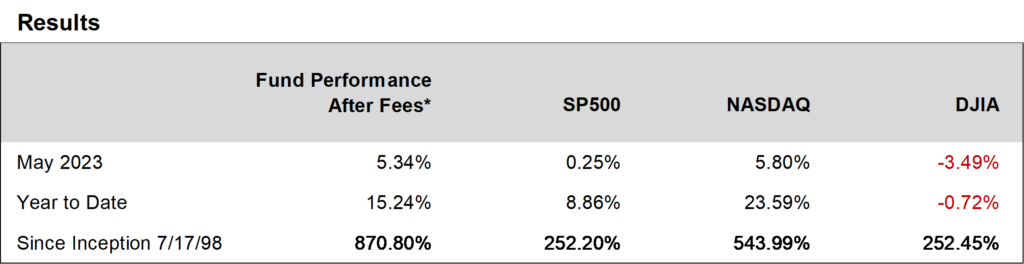
Ocean Park Investors Fund gained 5.34%* in May.  The S&P 500 gained 0.25% and the NASDAQ Composite gained 5.80%.  Technology stocks, our largest portfolio allocation, sparked market performance as Nvidia, Advanced Micro Devices, and Crowdstrike Holdings all gained more than 30%.

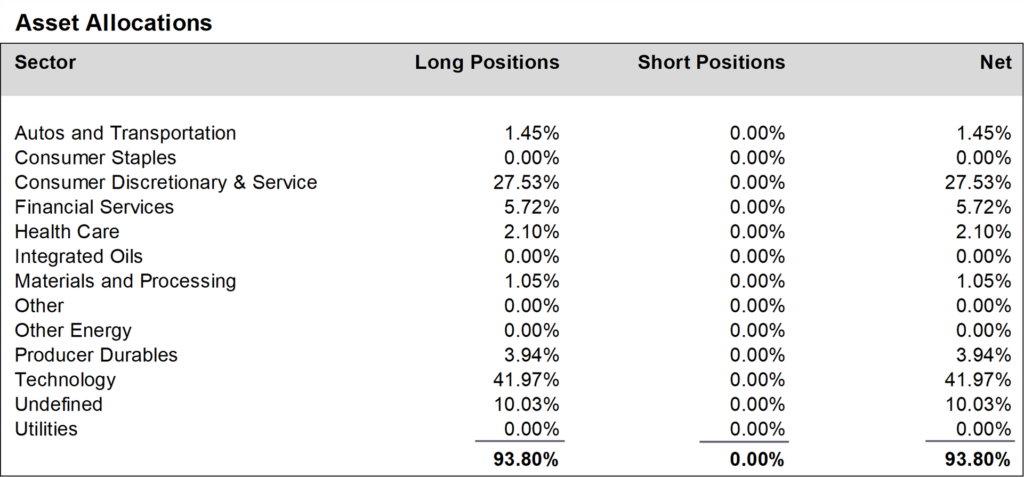
During May, we decreased positions in the consumer discretionary and service sector and increased our positions in the SPY and QQQ ETFs.  We finished the month at about 94% net long, down from about 96% in April.


Daily updates on our activity are available on our Results Line, at 310-281-8577, and current information is also maintained on our website at www.oceanparkcapital.com. To gain access to the site enter password opcap.

*These results are pro forma. Actual results for most investors will vary. See additional disclosures on page 4. Past performance does not guarantee future results.


Equity Overview

Equity Overview

Eight of eleven sectors in the S&P 500 lost ground in May.  But Information Technology was a big winner as the AI theme drove gains.  Energy was the big loser.  Growth stocks significantly outperformed value.  Volatility was subdued, as the S&P 500 moved more than 1% on only 5 of 22 trading days. The forward price/earnings ratio for the S&P 500 near month end was 18.3, still below the 5-year average of 18.5.

First quarter earnings reported in May followed the April trend.  With 95% of S&P 500 companies reporting, 78% beat consensus earnings expectations and 76% beat consensus revenue expectations, once again better than the one-year and five-year average beat rates.  S&P 500 companies had their best performance relative to analyst expectations since fourth quarter of 2021.


Macro Overview

Macro Overview

Economic headlines in May were generally positive.  Job growth was strong and unemployment declined.  Factory orders were higher, as were retail sales.  Housing was mixed.

The U.S. debt ceiling impasse was resolved by suspending the ceiling for two years.

The Commerce Department increased its estimate of 1Q2023 GDP growth to 1.3% annually, from its initial estimate of 1.1%.

The Fed raised rates by 0.25%, as expected.

Inflation continued to moderate as the Consumer Price Index rose 4.9% annually, down from 5.0% in April.


Additional Disclosures

Additional Disclosures

Performance data for OPI reflect the reinvestment of dividends and other earnings on the fund’s assets.  Performance data for the major indices reflect only changes in the value of those indices, and would be higher if dividends were included. However, the index data do not reflect fees that would be paid to index fund managers and transaction costs that would be incurred when their component stocks are bought or sold, while OPI’s data do reflect quarterly fees and expenses incurred by the fund.  The information provided is believed to be reliable, but its accuracy or completeness is not warranted. This material is not intended as an offer or solicitation for the purchase or sale of any stock, bond, mutual fund, or any other financial instrument. The views and strategies discussed herein may not be appropriate and/or suitable for all investors. This material is meant solely for informational purposes, and is not intended to suffice as any type of accounting, legal, tax, or estate planning advice. Any and all forecasts mentioned are for illustrative purposes only and should not be interpreted as investment recommendations.