Ocean Park Capital Management
2503 Main Street
Santa Monica, CA 90405
Main: 310.392.7300
Daily Performance Line: 310.281.8577
Dow Jones | 42,270 |
S&P 500 | 5,911 |
Nasdaq | 19,113 |
2 Yr Treasury | 3.89% |
10 Yr Treasury | 4.41% |
10 Yr Municipal | 3.31% |
High Yield | 7.26% |
Dow Jones | -0.64% |
S&P 500 | 0.51% |
Nasdaq | -1.02% |
MSCI-EAFE | 17.30% |
MSCI-Europe | 21.20% |
MSCI-Pacific | 10.50% |
MSCI-Emg Mkt | 8.90% |
US Agg Bond | 2.45% |
US Corp Bond | 2.26% |
US Gov’t Bond | 2.44% |
Gold | 3,313 |
Silver | 33.07 |
Oil (WTI) | 60.79 |
Dollar / Euro | 1.13 |
Dollar / Pound | 1.34 |
Yen / Dollar | 144.85 |
Canadian /Dollar | 0.72 |
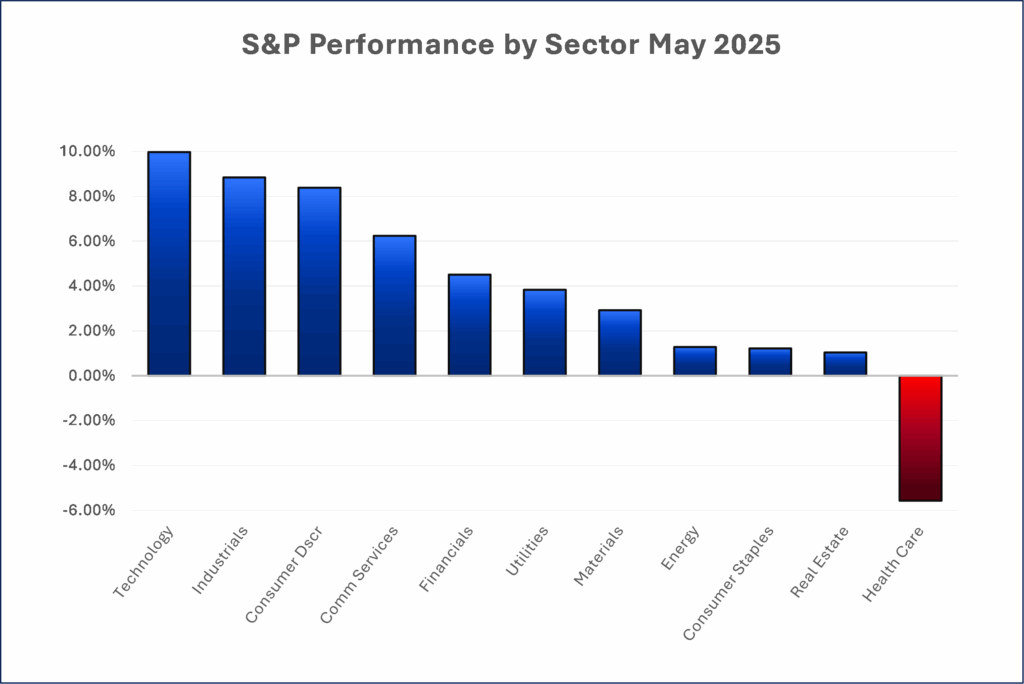
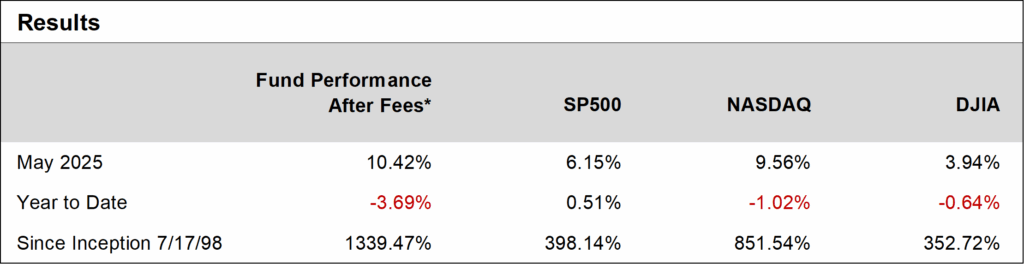
Ocean Park Investors Fund delivered strong performance in May, gaining 10.42%*, and outpacing the S&P 500 and NASDAQ Composite, which rose 6.15% and 9.56%, respectively. The fund’s results were driven primarily by continued strength in technology holdings, led by notable gains in Nvidia (+24%), Broadcom (+26%), and Astera Labs (+39%).
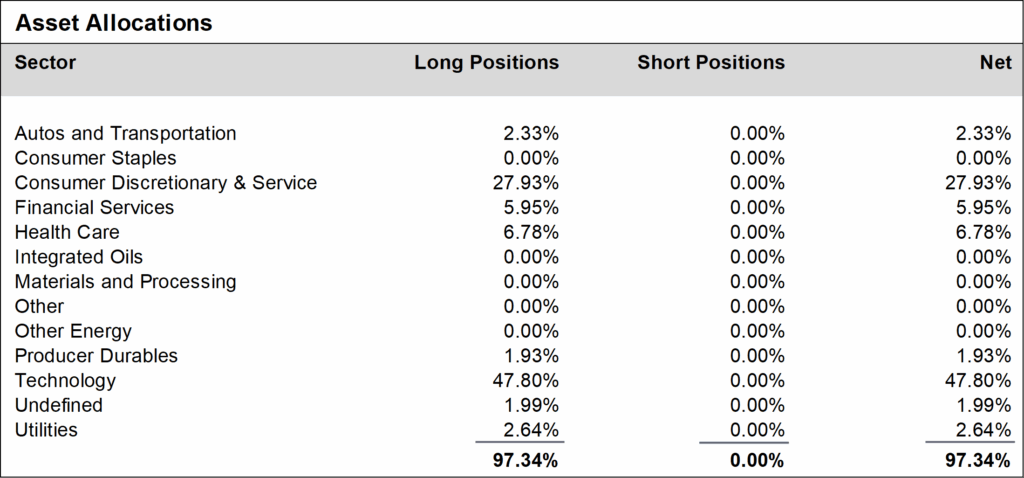
During May, we increased our exposure to the technology sector and reduced allocations to consumer discretionary and service-oriented holdings. Notable portfolio adjustments included the sale of Apple, Gap, and McDonald’s, and the addition of Disney, Intuit, and Palo Alto Networks. We ended the month approximately 97% net long, a slight increase from 96% in April.
Daily updates on our activity are available on our Results Line, at 310-281-8577, and current information is also maintained on our website at www.oceanparkcapital.com. To gain access to the site enter password opcap.
*These results are pro forma. Actual results for most investors will vary. See additional disclosures on page 4. Past performance does not guarantee future results.
Ten of the eleven S&P 500 sectors posted gains in May, with technology leading the way and health care the only sector to decline. Growth stocks continued to outperform value, extending the trend observed in April. Market volatility eased, as the S&P 500 moved more than 1% on just 4 of 21 trading days.
First-quarter earnings reports released in May were consistent with those seen in April. With 98% of S&P 500 companies having reported, 77% exceeded consensus earnings expectations, while 62% surpassed revenue estimates. Both figures were modestly below their respective five-year averages.
The May rally was fueled by easing tensions between the U.S. and China, as both countries agreed to lower tariffs and suspend further trade actions, which boosted investor confidence. Despite some volatility around trade headlines and court rulings, the market benefited from positive corporate earnings surprises and renewed strength in the consumer and tech sectors.
The broader U.S. economy, however, is showing signs of strain. Growth forecasts have been revised downward, with the OECD now projecting just 1.6% GDP growth for 2025, largely due to the impact of higher tariffs. Labor market data has softened, as job creation slowed and jobless claims edged higher, though the unemployment rate remains steady. Inflation risks are rising, with consumer prices expected to climb as tariff effects work through the economy. While consumer confidence is mixed and manufacturing is showing signs of contraction, the Federal Reserve remains cautious, with only one rate cut expected this year amid ongoing uncertainty over trade and fiscal policy.
Performance data for OPI reflect the reinvestment of dividends and other earnings on the fund’s assets. Performance data for the major indices reflect only changes in the value of those indices, and would be higher if dividends were included. However, the index data do not reflect fees that would be paid to index fund managers and transaction costs that would be incurred when their component stocks are bought or sold, while OPI’s data do reflect quarterly fees and expenses incurred by the fund. The information provided is believed to be reliable, but its accuracy or completeness is not warranted. This material is not intended as an offer or solicitation for the purchase or sale of any stock, bond, mutual fund, or any other financial instrument. The views and strategies discussed herein may not be appropriate and/or suitable for all investors. This material is meant solely for informational purposes, and is not intended to suffice as any type of accounting, legal, tax, or estate planning advice. Any and all forecasts mentioned are for illustrative purposes only and should not be interpreted as investment recommendations.