
Ocean Park Capital Management
2503 Main Street
Santa Monica, CA 90405
Main: 310.392.7300
Daily Performance Line: 310.281.8577
| Dow Jones | 51,032 |
| S&P 500 | 7,580 |
| Nasdaq | 26,972 |
| 2 Yr Treasury | 3.98% |
| 10 Yr Treasury | 4.45% |
| 10 Yr Municipal | 2.98% |
| High Yield | 6.88% |
| Dow Jones | 6.18% |
| S&P 500 | 10.73% |
| Nasdaq | 16.05% |
| MSCI-EAFE | 7.77% |
| MSCI-Europe | 5.04% |
| MSCI-Far East | 13.76% |
| MSCI-Emg Mkt | 24.76% |
| US Agg Bond | -0.17% |
| US Corp Bond | 0.08% |
| US Gov’t Bond | -0.26% |
| Gold | 4,593 |
| Silver | 75.87 |
| Oil (WTI) | 87.36 |
| Dollar / Euro | 1.16 |
| Dollar / Pound | 1.34 |
| Yen / Dollar | 159.26 |
| Canadian /Dollar | 0.72 |
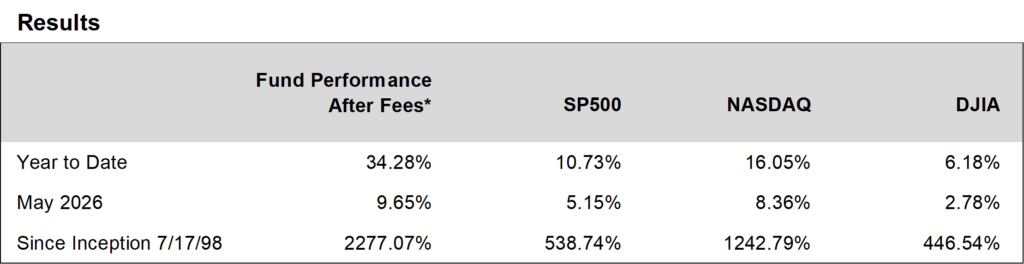
Ocean Park Investors Fund gained 9.65%* in May, while the S&P 500 rose 5.15% and the NASDAQ Composite advanced 8.36%. Year to date, the fund has returned 34.28%*, compared to 10.73% for the S&P 500 and 16.05% for the NASDAQ.
The fund’s outperformance reflects the continuing strength of AI microchip and memory stocks with Micron up 87%, Astera Labs up 76%, and Sandisk up 55% for the month. These companies continued to benefit from accelerating demand for AI infrastructure, as quarterly earnings reports confirmed that their customers are not only maintaining but expanding their capital expenditure commitments.
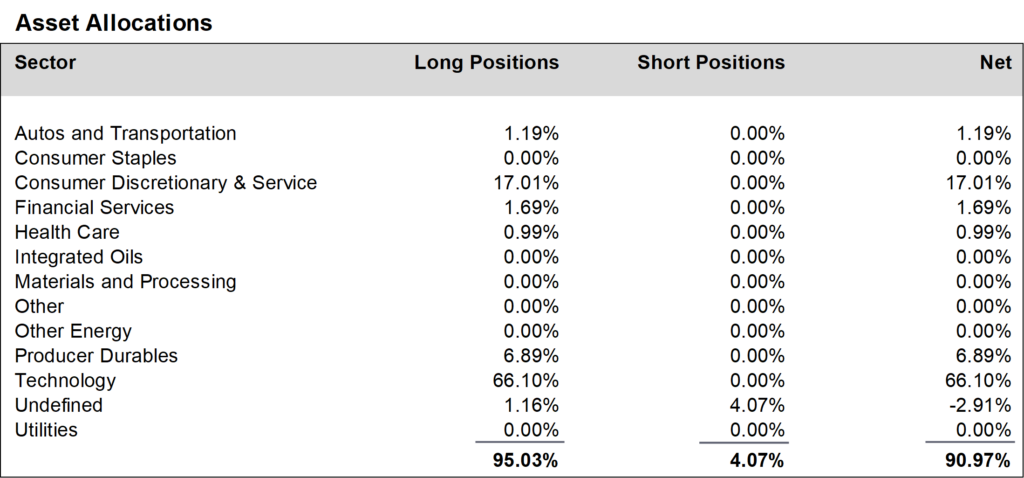
Since these positions have appreciated dramatically, we have lightened our exposure slightly by selling into strength. Despite this, we continue to maintain significant weights in these companies, because their projected earnings trajectory supports their valuations.
Daily updates on our activity are available on our Results Line, at 310-281-8577, and on our website at www.oceanparkcapital.com. Enter password opcap.
*These results are pro forma. Actual results for most investors will vary. Additional disclosures on page 4. Past performance does not guarantee future results.

U.S. equities extended their ascent in May, with all three major indices closing the month at record highs. Gains were narrowly focused as only three of eleven sectors in the S&P 500 rose, with Technology the big winner and Energy the worst loser. Growth stocks outperformed value. Volatility was modest as the S&P 500 moved more than 1% on 3 of 20 trading days.
Equity strength in May flowed from reports of first quarter earnings, which proved to be among the strongest in two decades. With 94% of S&P 500 companies reporting, 84% beat consensus earnings expectations and 81% beat consensus revenue expectations, in both cases higher than their one-year and five-year averages. Moreover, the blended earnings growth rate stood at 28.4%, more than double the 13.2 % predicted by analysts at the start of the quarter and the highest in four years.

Economic data reported in May was mixed. Positive data included strong gains in nonfarm payrolls, benign unemployment, steady wage growth, and improved manufacturing activity. GDP expansion was also encouraging as the Commerce Department projected 1Q2026 growth at 1.6%, well above the anemic 0.5% growth in 4Q2025.
On the other hand, the inflation picture was troubling. The Consumer Price Index rose 3.8% year-over-year which was the highest rate in almost three years. The Producer Price Index was even more alarming, up nearly 6% year-over-year. These numbers were reflected in the University of Michigan Consumer Sentiment Index which fell to a record low of 44.8.
The contrast of economic growth and worrisome inflation will present a challenge to the new Fed Chairman Kevin Warsh at his first meeting on June 17. The president has pressured him to lower interest rates but inflation numbers will make that virtually impossible. Equally significant, the Chairman is only one vote of twelve on the committee that determines interest rate policy. Public comments from numerous other members suggest that they are opposed to further cuts and may even want an increase in rates to head off further inflation.

Performance data for OPI reflect the reinvestment of dividends and other earnings on the fund’s assets. Performance data for the major indices reflect only changes in the value of those indices, and would be higher if dividends were included. However, the index data do not reflect fees that would be paid to index fund managers and transaction costs that would be incurred when their component stocks are bought or sold, while OPI’s data do reflect quarterly fees and expenses incurred by the fund. The information provided is believed to be reliable, but its accuracy or completeness is not warranted. This material is not intended as an offer or solicitation for the purchase or sale of any stock, bond, mutual fund, or any other financial instrument. The views and strategies discussed herein may not be appropriate and/or suitable for all investors. This material is meant solely for informational purposes, and is not intended to suffice as any type of accounting, legal, tax, or estate planning advice. Any and all forecasts mentioned are for illustrative purposes only and should not be interpreted as investment recommendations.