Fortis Wealth Management

(888) 336-7847 (3FORTIS)

www.investfortis.com

June 2026
Market Update
(all values as of 05.31.2026)

Stock Indices:

Dow Jones 51,032
S&P 500 7,580
Nasdaq 26,972

Bond Sector Yields:

2 Yr Treasury 3.98%
10 Yr Treasury 4.45%
10 Yr Municipal 2.98%
High Yield 6.88%

YTD Market Returns:

Dow Jones 6.18%
S&P 500 10.73%
Nasdaq 16.05%
MSCI-EAFE 7.77%
MSCI-Europe 5.04%
MSCI-Far East 13.76%
MSCI-Emg Mkt 24.76%
 
US Agg Bond -0.17%
US Corp Bond 0.08%
US Gov’t Bond -0.26%

Commodity Prices:

Gold 4,593
Silver 75.87
Oil (WTI) 87.36

Currencies:

Dollar / Euro 1.16
Dollar / Pound 1.34
Yen / Dollar 159.26
Canadian /Dollar 0.72
 

Macro Overview

The conflict with Iran, and the uncertain duration of hostilities, has emerged as a central concern for financial markets. Analysts and economists are less focused on the immediate fallout and more on the potential longer-term consequences for growth and consumer behavior. A prolonged conflict risks slowing economic activity, driven in part by sustained increases in diesel and gasoline prices.

Higher fuel costs contributed to a rise in inflation in May, with the Consumer Price Index increasing 3.8% over the prior 12 months. More concerning was the latest wage data, which, after adjusting for inflation, declined for the first time in three years. As purchasing power erodes, consumers are increasingly constrained in discretionary spending.

Market gains, according to analysts, are being driven largely by earnings performance rather than revenue growth. Companies delivering consistent earnings expansion continue to fuel investor optimism, while those without such gains are seeing comparatively subdued results.

The labor market showed unexpected strength in May, with hiring exceeding forecasts. This has led some Federal Reserve officials to weigh the possibility of additional rate increases later this year. The Fed monitors job creation closely as a signal of economic momentum and potential inflationary pressure stemming from wage growth, which can translate into stronger consumer demand.

Investors are also preparing for a wave of major initial public offerings, including SpaceX, Anthropic, and OpenAI, all expected to go public in 2026. Combined valuations are projected to exceed $3.5 trillion, with SpaceX anticipated to debut on June 12th. Together, these offerings could represent as much as 5% of total U.S. equity market value, raising concerns among some analysts about elevated valuations.

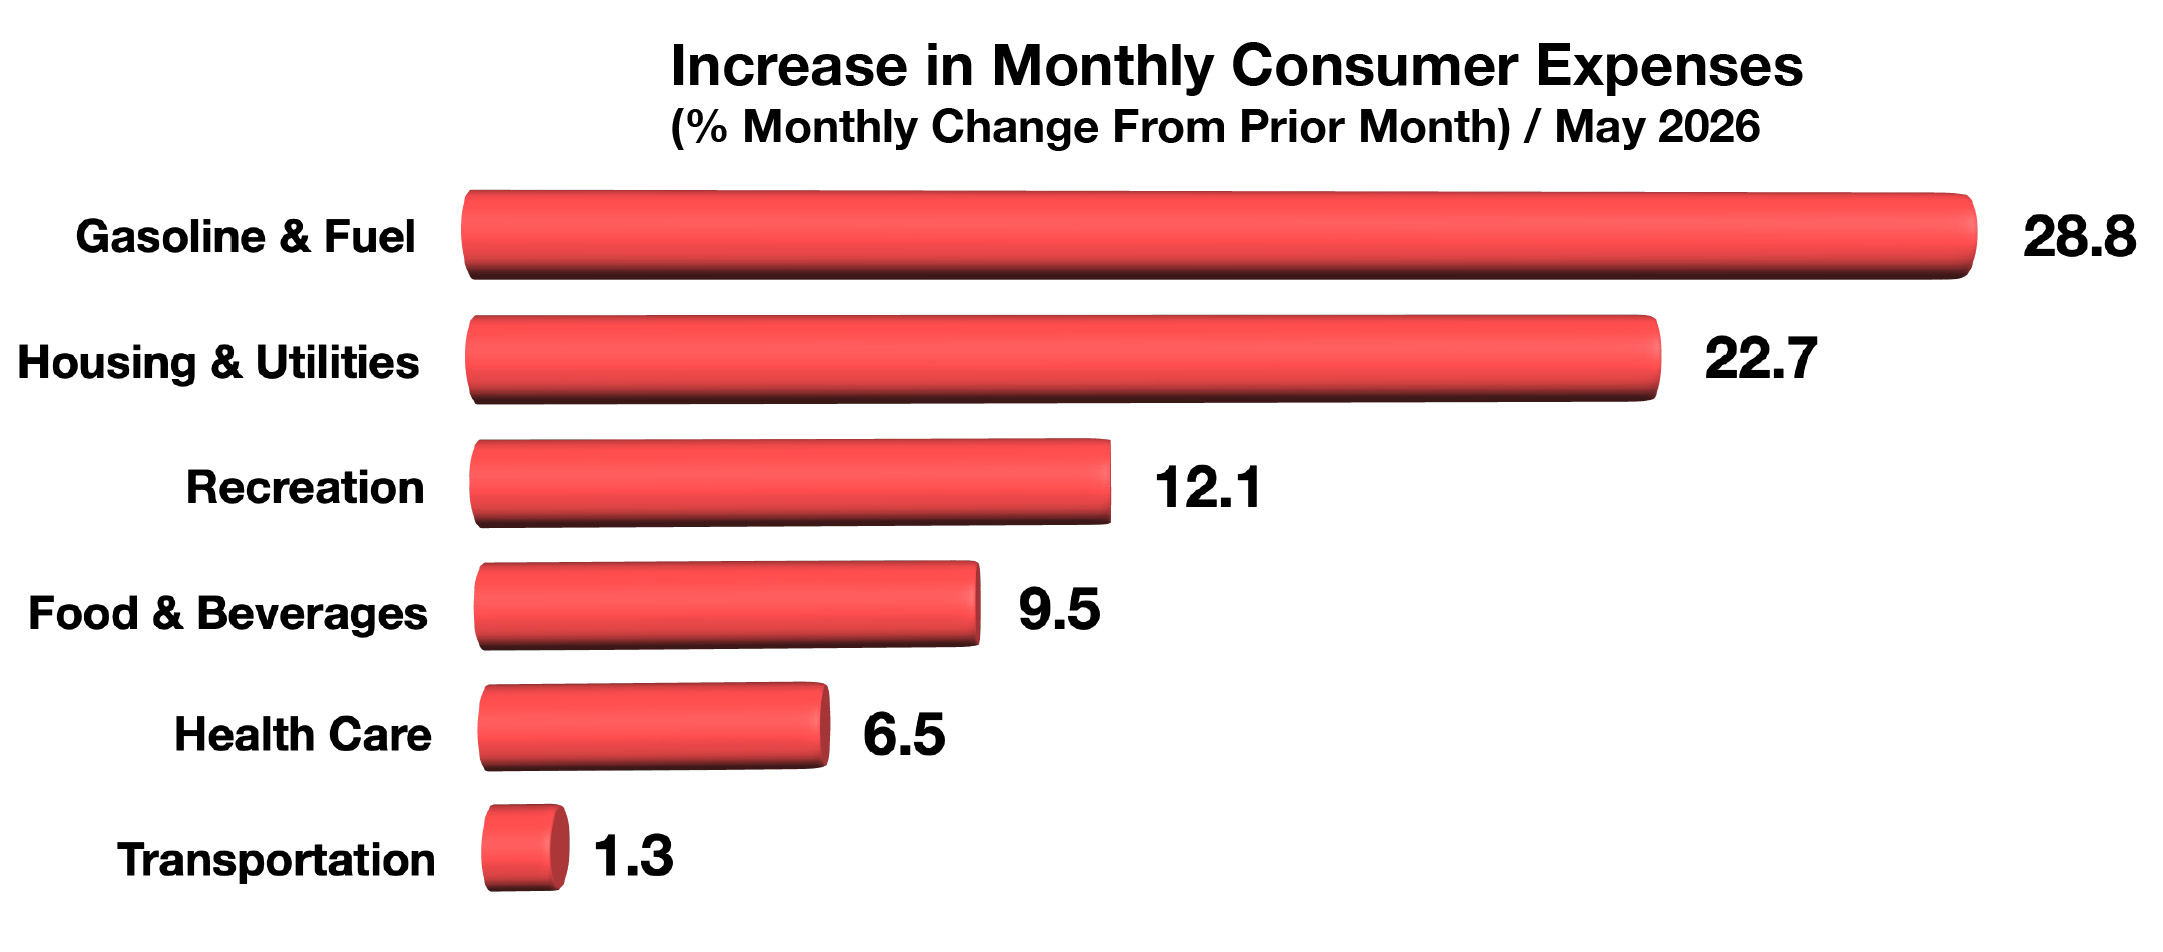
Recent data shows consumers facing some of the sharpest month-over-month increases in gasoline and utility costs. Fuel prices climbed 28.8% from April to May 2026, while housing and utility costs rose 22.7% over the same period. Such rapid increases are forcing households to allocate more income toward essentials, reducing savings rates.

Electricity costs on the nation’s largest power grid surged 76% in the first quarter, driven by heavy demand from data centers. The grid, which serves approximately 67 million people from New Jersey to Illinois, is under mounting strain as energy consumption rises alongside the expansion of digital infrastructure.

U.S. oil exports reached 5.8 million barrels per day in May, up sharply from 3.9 million in February before the conflict began. With domestic production near 14 million barrels per day, supply remains strong. However, elevated global prices and refiners operating at full capacity are contributing to persistently high gasoline prices for U.S. consumers.

Sources: Dept. of Energy, Federal Energy Regulatory Commission, BLS, Dept. of Labor
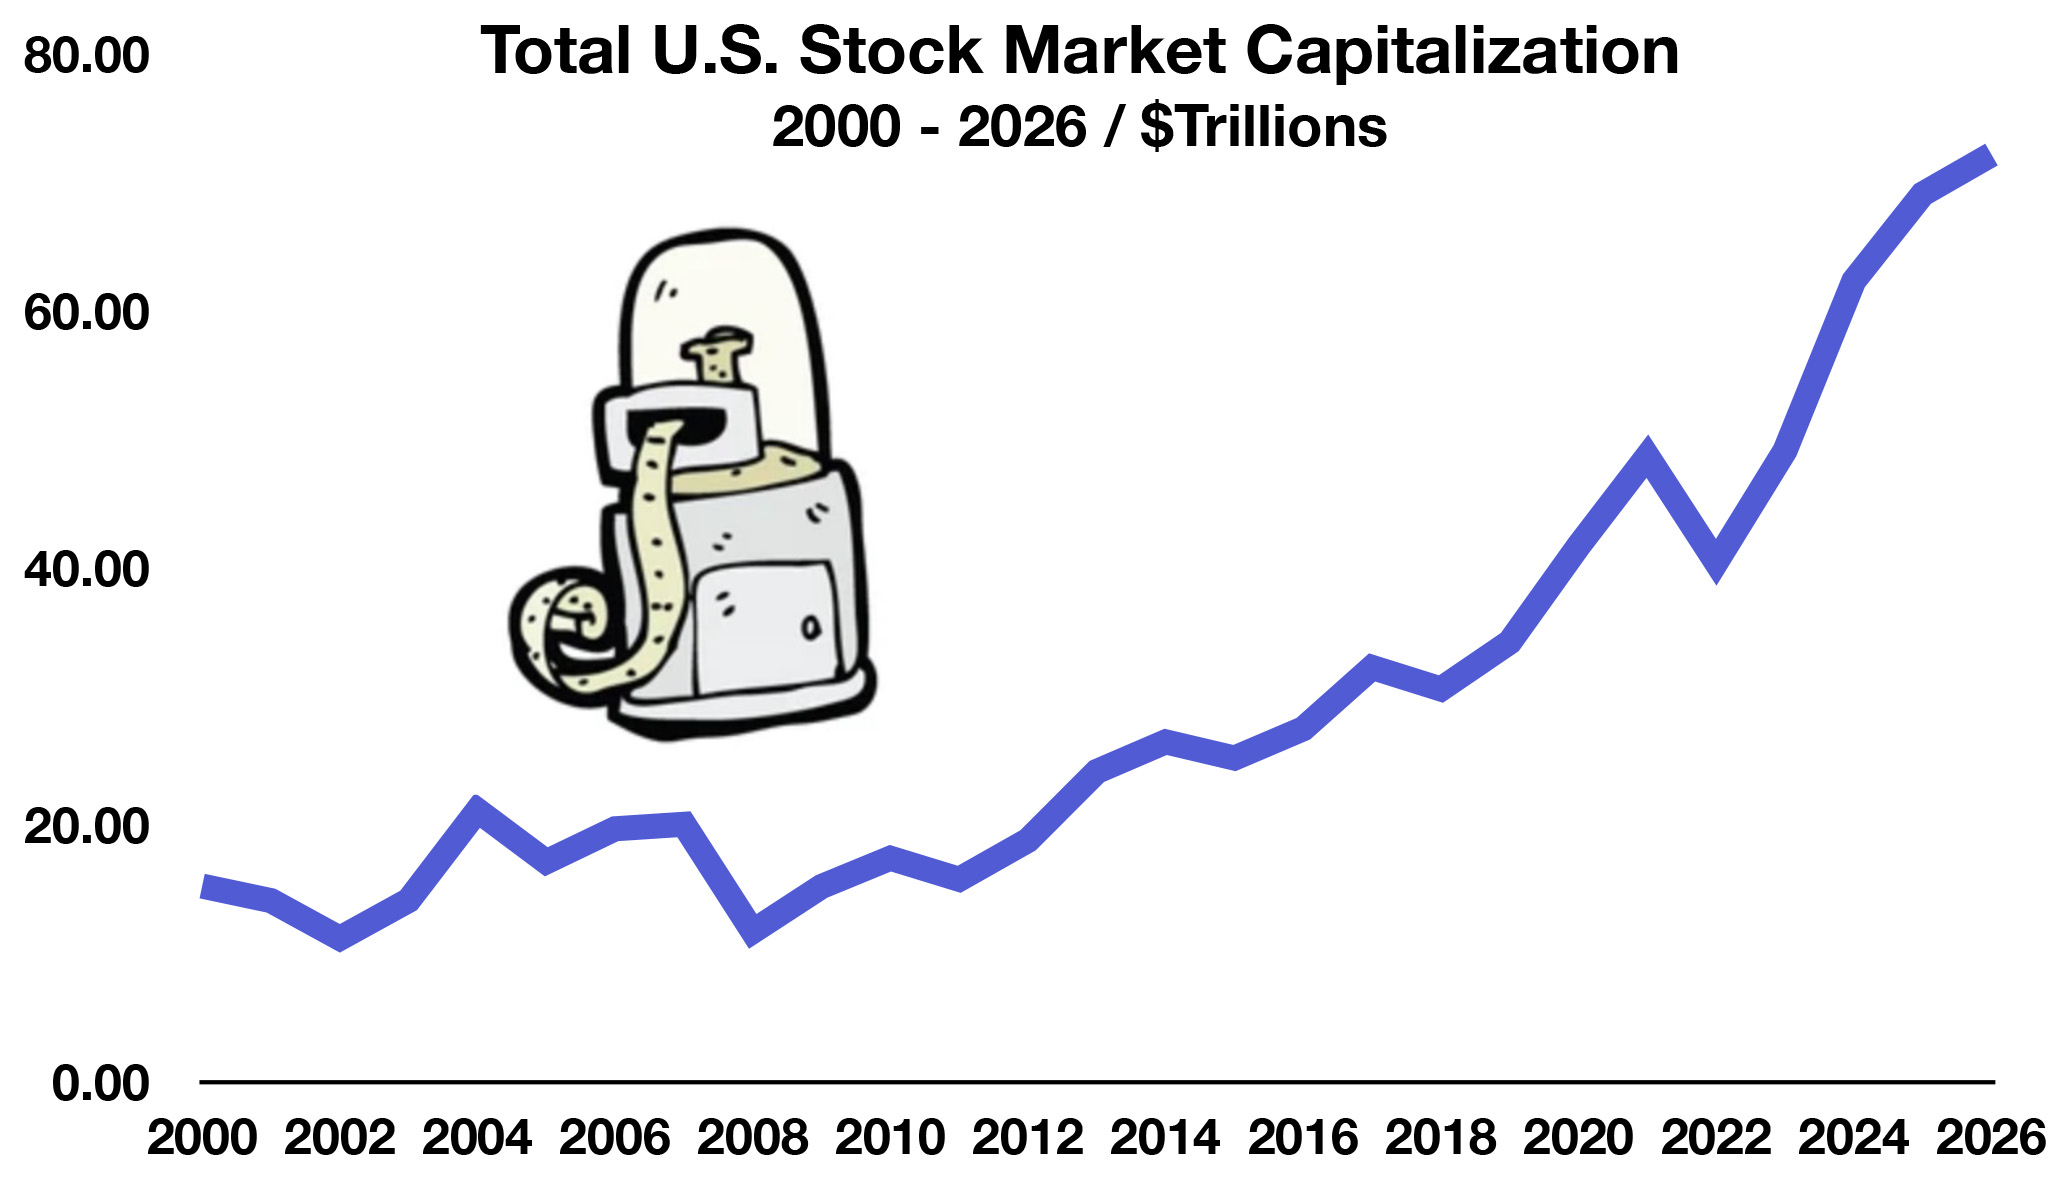
 
total market capitalization of the U.S. stock market is roughly $72 trillion

Fed Stuck In A Quandary – Fixed Income Overview

The yield on the 30-year Treasury bond surpassed 5% in mid-May, reaching its highest level since 2007. Yields at this level have increased the appeal of long-duration Treasuries for pension funds, endowments, and income-focused investors. Historically, elevated bond yields can weigh on equities, as investors reassess the trade-off between stock market risk and the relative stability of fixed-income returns.

A stronger-than-expected employment report, combined with persistently high fuel prices, has complicated the Federal Reserve’s policy outlook. Markets had anticipated rate cuts before year-end, but sentiment has shifted as policymakers confront ongoing inflation alongside a resilient labor market. Some Fed officials have signaled openness to additional rate increases to contain inflationary pressures.

Sources: Treasury Dept, Federal Reserve

Total Stock Market Valuation Surpasses $70 Trillion – Domestic Equity Overview 

Domestic equities rebounded in May after a volatile start to the year. The S&P 500 advanced, led by gains in the technology, consumer discretionary, and healthcare sectors. Market momentum is currently being supported by strong earnings and continued optimism around investment in AI infrastructure. At the same time, elevated interest rates are beginning to pressure smaller-cap stocks, many of which carry higher debt burdens and face rising borrowing costs.

Markets are preparing for an unprecedented wave of initial public offerings this year, led by one of the largest anticipated listings, SpaceX, expected on June 12th. The combined estimated valuation of SpaceX, Anthropic, and OpenAI is projected to exceed $3.55 trillion, representing nearly 5% of total U.S. equity market capitalization.

The total market value of U.S. equities currently stands near $72 trillion, reflecting the aggregate valuation of all publicly traded companies listed on major exchanges, including the NYSE and Nasdaq. The U.S. accounts for roughly half of global equity market capitalization. By comparison, the U.S. remains the largest concentration of corporate value worldwide, representing about half of the approximately $154 trillion global stock market. It significantly exceeds other major markets, with China at roughly $11.8 trillion and the European Union near $11.1 trillion in total market value.

Sources: Dow Jones, S&P, IMF

 
Gasoline and fuel costs soared over 28% from April to May

How 529s Can Be Converted To Roth IRAs – Financial Planning

When 529 college savings plans were introduced roughly 30 years ago, their use was largely restricted to qualified education expenses. Subsequent legislative changes have gradually expanded that flexibility, including provisions that allow unused funds to be redirected toward retirement savings.

To qualify for a rollover into a Roth IRA, a 529 plan must have been established for at least 15 years. Changing the beneficiary may reset that holding period, potentially affecting eligibility. In addition, only funds that have been in the account for at least five years are eligible for transfer; contributions and earnings from the most recent five years are excluded. Rollovers are subject to the annual Roth IRA contribution limit—$7,500 for individuals under age 50 in 2026—and cannot exceed the beneficiary’s eligible contribution for that year. A lifetime rollover cap of $35,000 per beneficiary also applies. The Roth IRA must be owned by the same beneficiary as the 529 plan, and the beneficiary must have earned income at least equal to the rollover amount. Income limits that typically apply to Roth IRA contributions do not apply to these rollovers.

Executing the transfer as a direct trustee-to-trustee rollover helps avoid taxes and penalties. By contrast, withdrawing funds from the 529 plan before transferring them could trigger a taxable event or additional penalties.

Source: IRS, Section 529 IRS Publication

Consumers Saving Less & Spending More On Fuel & Utilities – Consumer Expenditures

Consumers are facing a sharp rise in fuel and housing costs, constraining their ability to spend in other areas. Gasoline and fuel prices climbed more than 28% from April to May, while housing and utility costs increased by over 22% during the same period.

Consumers are saving less as they contend with rising costs, with the personal saving rate falling to 2.6% in April, down sharply from 6.4% at the start of 2024. As expenses have increased, households have drawn more heavily on savings to cover monthly spending. Some consumers are beginning to show signs of financial strain, turning to credit cards and other lines of credit to meet routine expenses.

Sources: BLS, Federal Reserve Bank of St. Louis

 
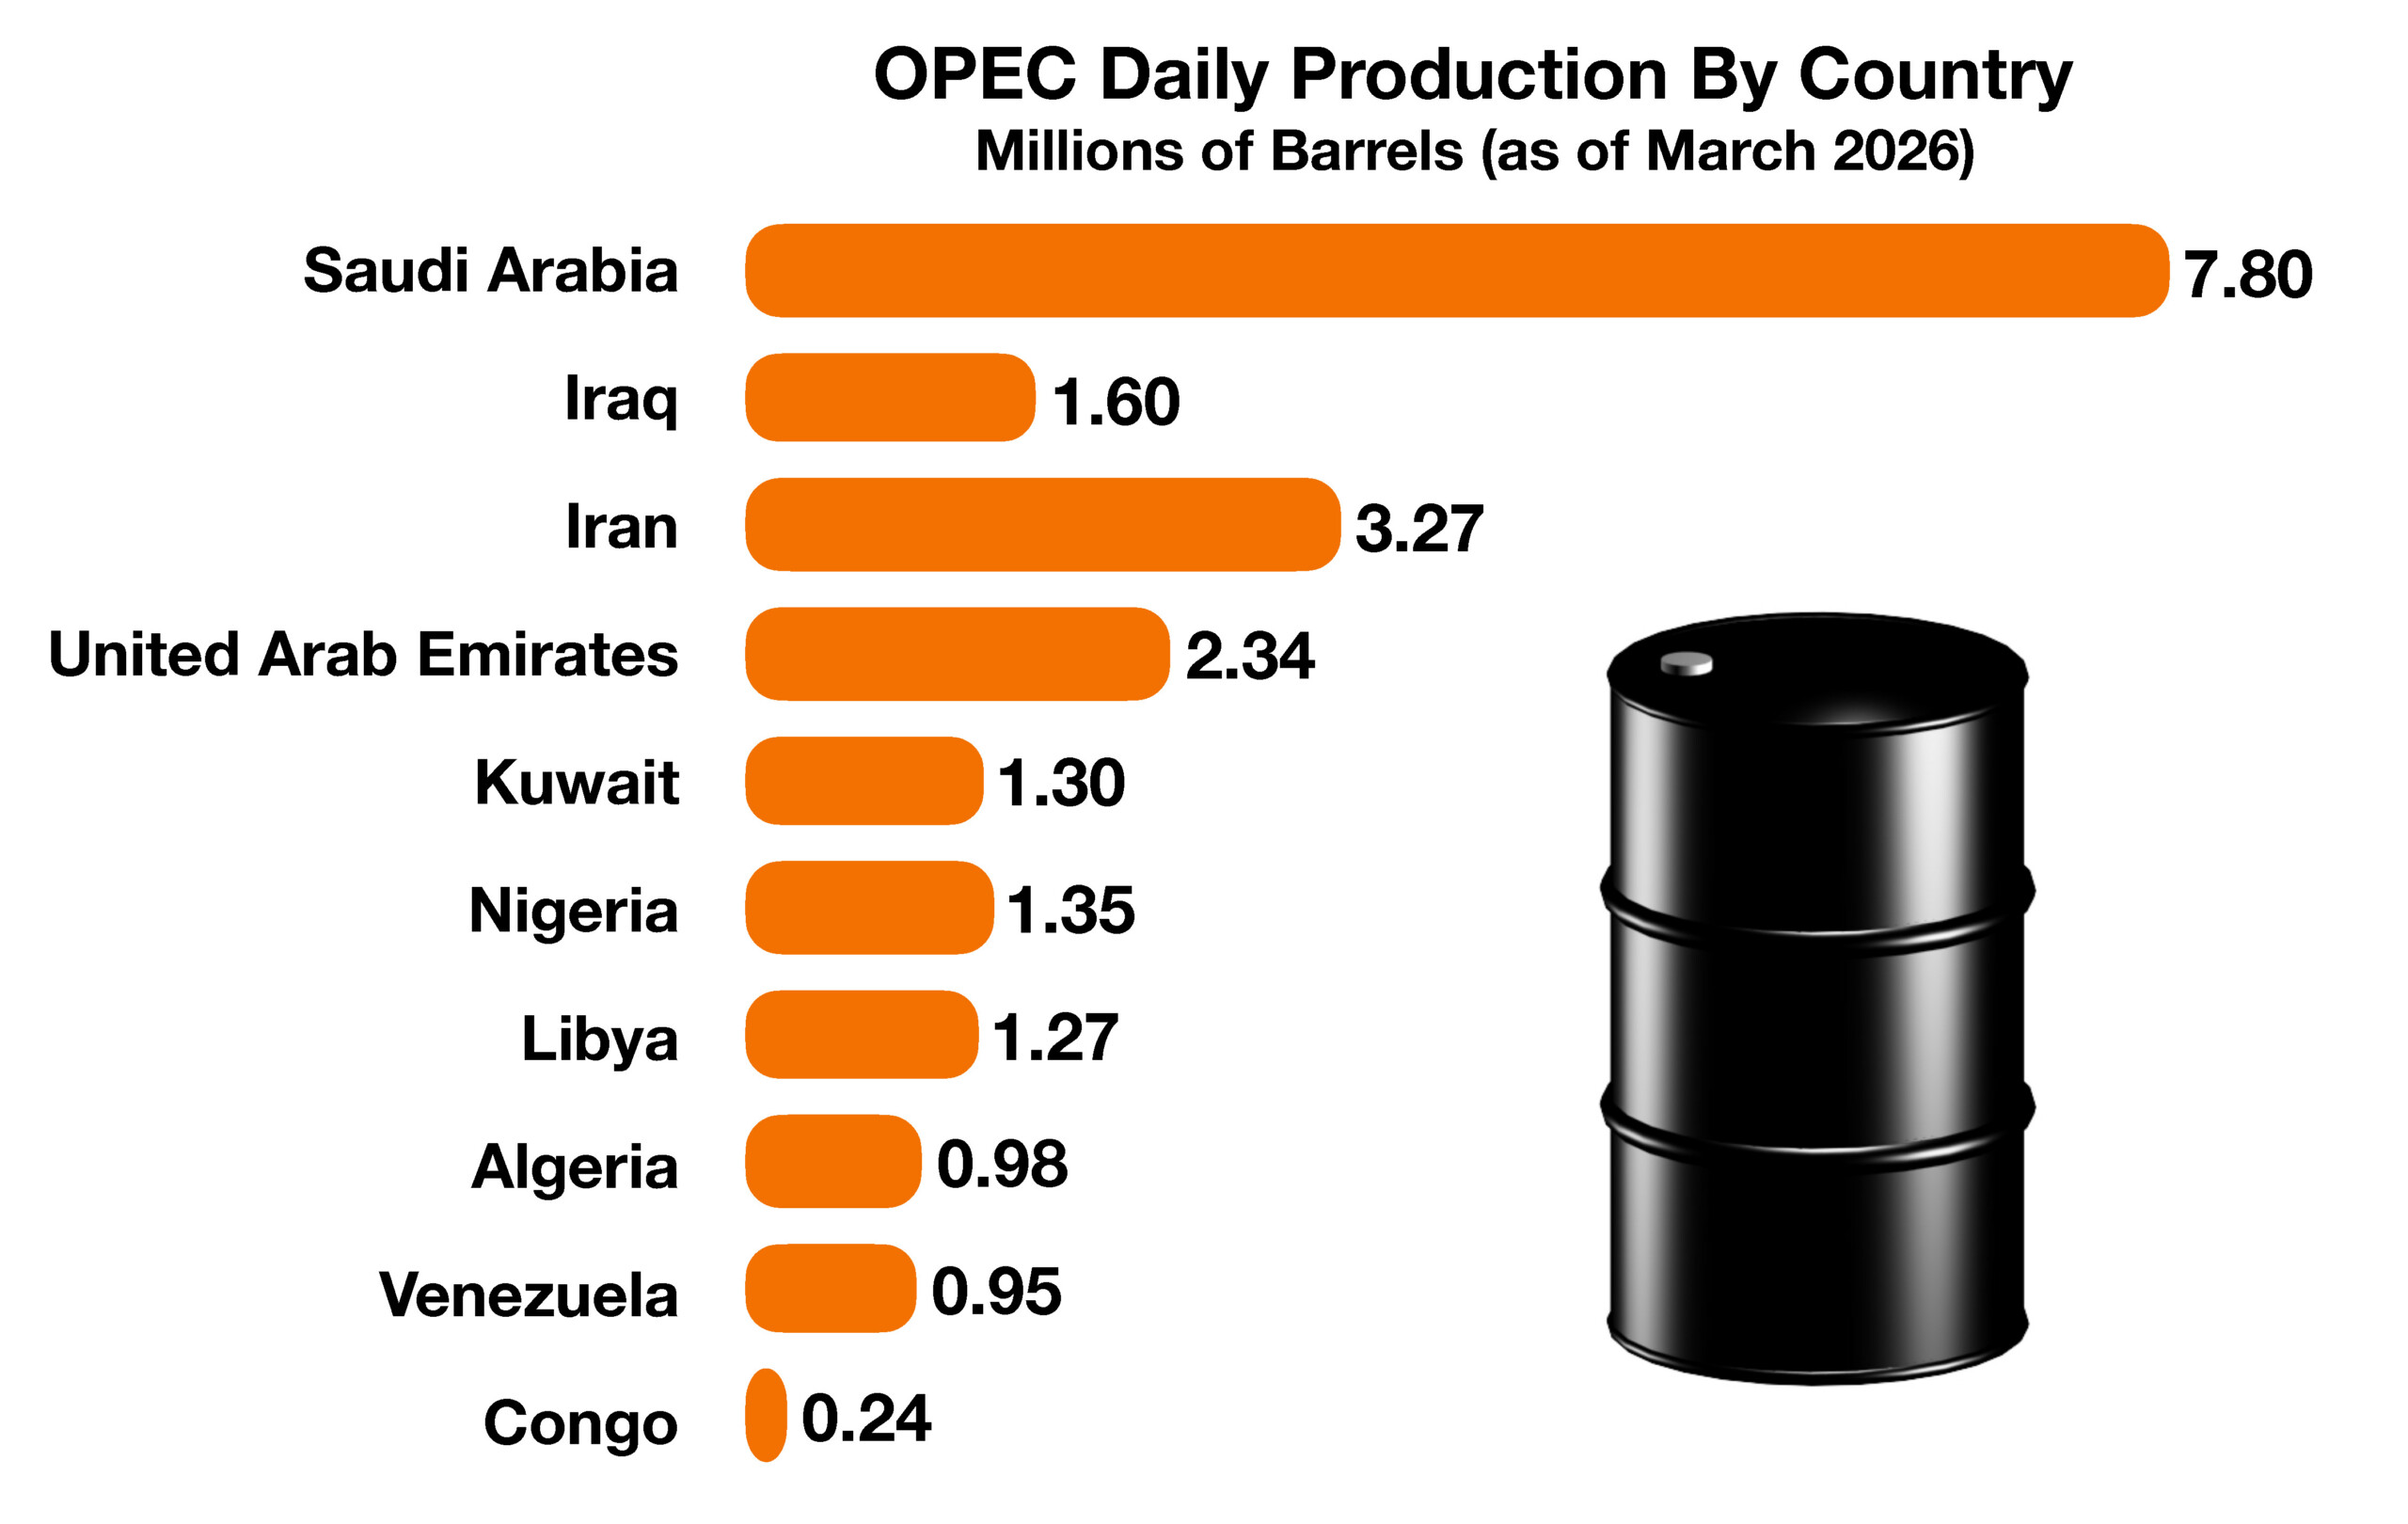
U.A.E. produced roughly 13% of OPEC output

United Arab Emirates Quits OPEC –  Global Oil Industry Overview

The departure of the United Arab Emirates from OPEC represents a notable challenge for the organization and raises questions about its long-term cohesion and influence.

Operating as a cartel, OPEC has historically relied on coordinated production targets and pricing strategies to shape global oil markets. However, its influence has diminished in recent years, particularly following the rise of U.S. shale production, which significantly expanded global supply. In response, OPEC partnered with Russia and other producers to bolster market share and strengthen pricing power.

More recently, internal tensions have resurfaced. Producers have reportedly expressed concern that disruptions in the Strait of Hormuz, including attacks attributed to Iran, have reduced their ability to guide price movements, undermining OPEC’s role as the primary force in the oil market.

By exiting OPEC’s quota system, the U.A.E. gains greater flexibility to expand oil production on its own terms. As one of the world’s lowest-cost producers, it has capacity of roughly 4.8 million barrels per day but had been limited to about 3.4 million under OPEC guidelines. Outside the group, the U.A.E. has both the incentive and the capability to increase output.

Accounting for roughly 13% of OPEC production, the U.A.E. was the group’s fourth-largest producer prior to the conflict and moved into the top tier after Iran’s exports declined.

Tensions between the U.A.E. and other OPEC members have persisted for years, particularly over production quotas. Member countries face differing production costs, with some confronting rising expenses and weaker profitability, further complicating efforts to maintain coordinated output levels.

Sources: OPEC, EIA, World Bank Group