Ocean Park Capital Management

2503 Main Street

Santa Monica, CA 90405

Main: 310.392.7300

Daily Performance Line:  310.281.8577

February 2024
Market Update
(all values as of 02.29.2024)

Stock Indices:

Dow Jones 38,996
S&P 500 5,096
Nasdaq 16,091

Bond Sector Yields:

2 Yr Treasury 4.64%
10 Yr Treasury 4.25%
10 Yr Municipal 2.53%
High Yield 7.63%

YTD Market Returns:

Dow Jones 3.47%
S&P 500 6.84%
Nasdaq 7.20%
MSCI-EAFE 2.23%
MSCI-Europe 1.23%
MSCI-Pacific 3.98%
MSCI-Emg Mkt -0.27%
 
US Agg Bond -1.68%
US Corp Bond -1.67%
US Gov’t Bond -1.59%

Commodity Prices:

Gold 2,051
Silver 22.87
Oil (WTI) 78.25

Currencies:

Dollar / Euro 1.08
Dollar / Pound 1.26
Yen / Dollar 150.63
Canadian /Dollar 0.73
 

Portfolio Overview

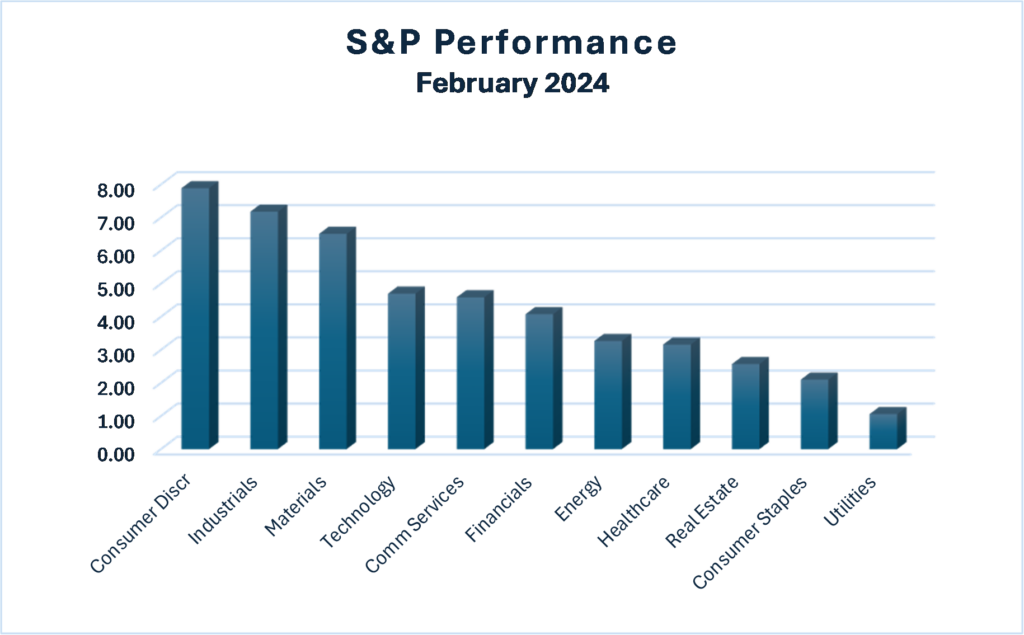
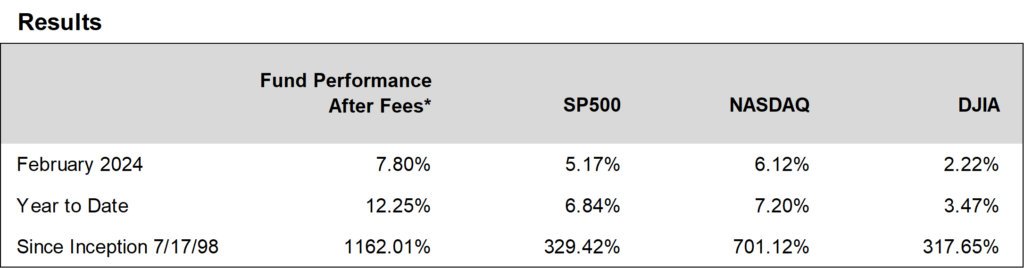
Ocean Park Investors Fund gained 7.80%* in February. The S&P 500 gained 5.17% and the NASDAQ Composite gained 6.12%. Consumer and technology positions led the portfolio, with Abercrombie and Fitch, e.l.f. Beauty, Meta (Facebook), and Nvidia all rising more than 25%.

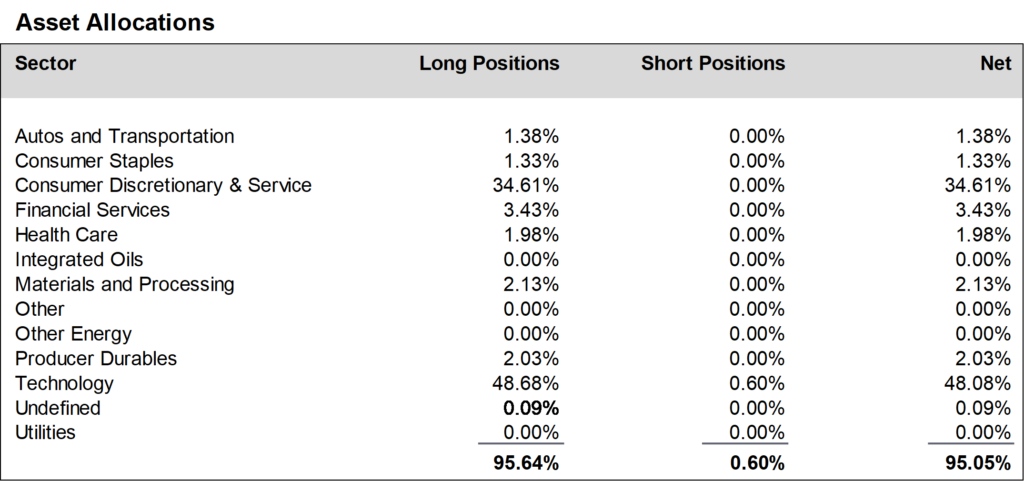
During February, we increased positions in the consumer discretionary and service sector and reduced exposure to the technology sector. Our trading activity in February was modest going into the busiest month of the 4th quarter earnings season. We sold several stocks whose earnings we felt were not good enough to sustain positive momentum including Western Digital and Twilio, replacing them with stocks we judged to have better earnings potential such as Gap Stores, PVH, and Micron Technology. We finished the month at about 95% net long, up from about 94% in January.


Daily updates on our activity are available on our Results Line, at 310-281-8577, and current information is also maintained on our website at www.oceanparkcapital.com. To gain access to the site enter password opcap.

*These results are pro forma. Actual results for most investors will vary. See additional disclosures on page 4. Past performance does not guarantee future results.

 
Equity Overview

Equity Overview

The S&P 500 hit an all-time high in February as all eleven sectors gained ground. Consumer discretionary was the leader and utilities were the laggard. Growth stocks outperformed value. Volatility was modest, as the S&P 500 moved more than 1% on 4 of 20 trading days. The forward price/earnings ratio for the S&P 500 at month end rose to 20.4 from 20.0 in January, continuing its rise above the 5-year average of 19.0.

Fourth quarter earnings reported in February echoed the results in January. With 97% of S&P 500 companies reporting, 73% beat consensus earnings expectations and 64% beat consensus revenue expectations, in both cases modestly below the five-year average beat rates. The magnitude of earnings beats was 4.1% above consensus, well below the five-year average of 8.5%.


Macro Overview

Macro Overview

Economic headlines in February were uninspiring. Unemployment remained steady at 3.7%. Retail sales and durable goods orders were weak. The Consumer Price Index disappointed with an annualized increase of 3.1%, higher than analyst projections. Consumer confidence as measured by The Conference Board declined, and January confidence was revised downward. Commentary from Chairman Powell made clear that there would be no interest rate decrease at the Fed’s March meeting. Expectations have now shifted to the June meeting.

In the continuing saga of the federal budget, Congress approved a stopgap measure at the last moment on February 29, once again narrowly avoiding a government shutdown.


Additional Disclosures

Additional Disclosures

Performance data for OPI reflect the reinvestment of dividends and other earnings on the fund’s assets. Performance data for the major indices reflect only changes in the value of those indices, and would be higher if dividends were included. However, the index data do not reflect fees that would be paid to index fund managers and transaction costs that would be incurred when their component stocks are bought or sold, while OPI’s data do reflect quarterly fees and expenses incurred by the fund. The information provided is believed to be reliable, but its accuracy or completeness is not warranted. This material is not intended as an offer or solicitation for the purchase or sale of any stock, bond, mutual fund, or any other financial instrument. The views and strategies discussed herein may not be appropriate and/or suitable for all investors. This material is meant solely for informational purposes, and is not intended to suffice as any type of accounting, legal, tax, or estate planning advice. Any and all forecasts mentioned are for illustrative purposes only and should not be interpreted as investment recommendations.