LifeMark Securities Corp.

400 West Metro Park

Rochester, NY 14623

800.291.7570

www.lifemark.com

Market Update
(all values as of 02.28.2025)

Stock Indices:

Dow Jones 43,840
S&P 500 5,954
Nasdaq 18,847

Bond Sector Yields:

2 Yr Treasury 3.99%
10 Yr Treasury 4.24%
10 Yr Municipal 2.88%
High Yield 6.92%

YTD Market Returns:

Dow Jones 2.75%
S&P 500 1.23%
Nasdaq -2.40%
MSCI-EAFE 7.30%
MSCI-Europe 10.30%
MSCI-Pacific 0.90%
MSCI-Emg Mkt 6.60%
 
US Agg Bond 2.74%
US Corp Bond 2.60%
US Gov’t Bond 2.65%

Commodity Prices:

Gold 2,864
Silver 31.69
Oil (WTI) 70.07

Currencies:

Dollar / Euro 1.04
Dollar / Pound 1.26
Yen / Dollar 149.59
Canadian /Dollar 0.69

Macro Overview

The administration confirmed that the U.S. would impose a 25% tariff on goods and services imported from Canada and Mexico effective early April, including an additional 10% tariff on Chinese imports. The effective date of the newly imposed tariffs was announced by the White House as a temporary reprieve following pleas from industry leaders. The implementation of the newly instituted tariffs has been extended to April 2nd. Inflation expectations have taken on renewed concerns as the prospect of the imposed tariffs weigh on the outlook for consumer expenditures.

Some economists believe that higher prices paid by consumers due to tariffs, might actually become deflationary since consumers may pullback spending on higher priced tariffed products. Even a slight pullback would be consequential on the U.S. economy since nearly 70% of Gross Domestic Production (GDP) is driven by how much consumers spend. Less spending could lead to an economic slowdown, eventually bringing down interest rates and inflationary pressures.

Treasury Secretary Scott Bessent said that the market selloff would be temporary and that Chinese manufacturers would absorb the newly imposed tariffs. The Treasury Secretary also said that a transition period regarding trade policy is underway with Canada and Mexico. There are mixed opinions regarding the consequences of the newly proposed tariffs, some differing within and outside the administration.

Applications for unemployment benefits rose to the highest level this year amid an increase in company firings across the country. Initial claims increased by 22,000 to 242,000 in late February, the highest level since October. The pickup in new applications coincides with a number of mass terminations and layoffs at numerous companies.

Data released by the National Association of Realtors revealed that pending sales of existing U.S. homes slumped to a record low in January as severe winter weather slowed transaction activity. Consumers also balked at high prices and elevated mortgage rates ahead of the vital spring selling season. Home prices continue to rise preventing home buyers from committing to purchase. National home prices rose 3.9% in December from a year earlier, up from the 3.7% annual gain seen a month earlier, according to data from S&P CoreLogic Case-Shiller. The median sale price of a previously owned home in the U.S. was $396,900 last month, according to NAR data, up 49% from five years earlier.

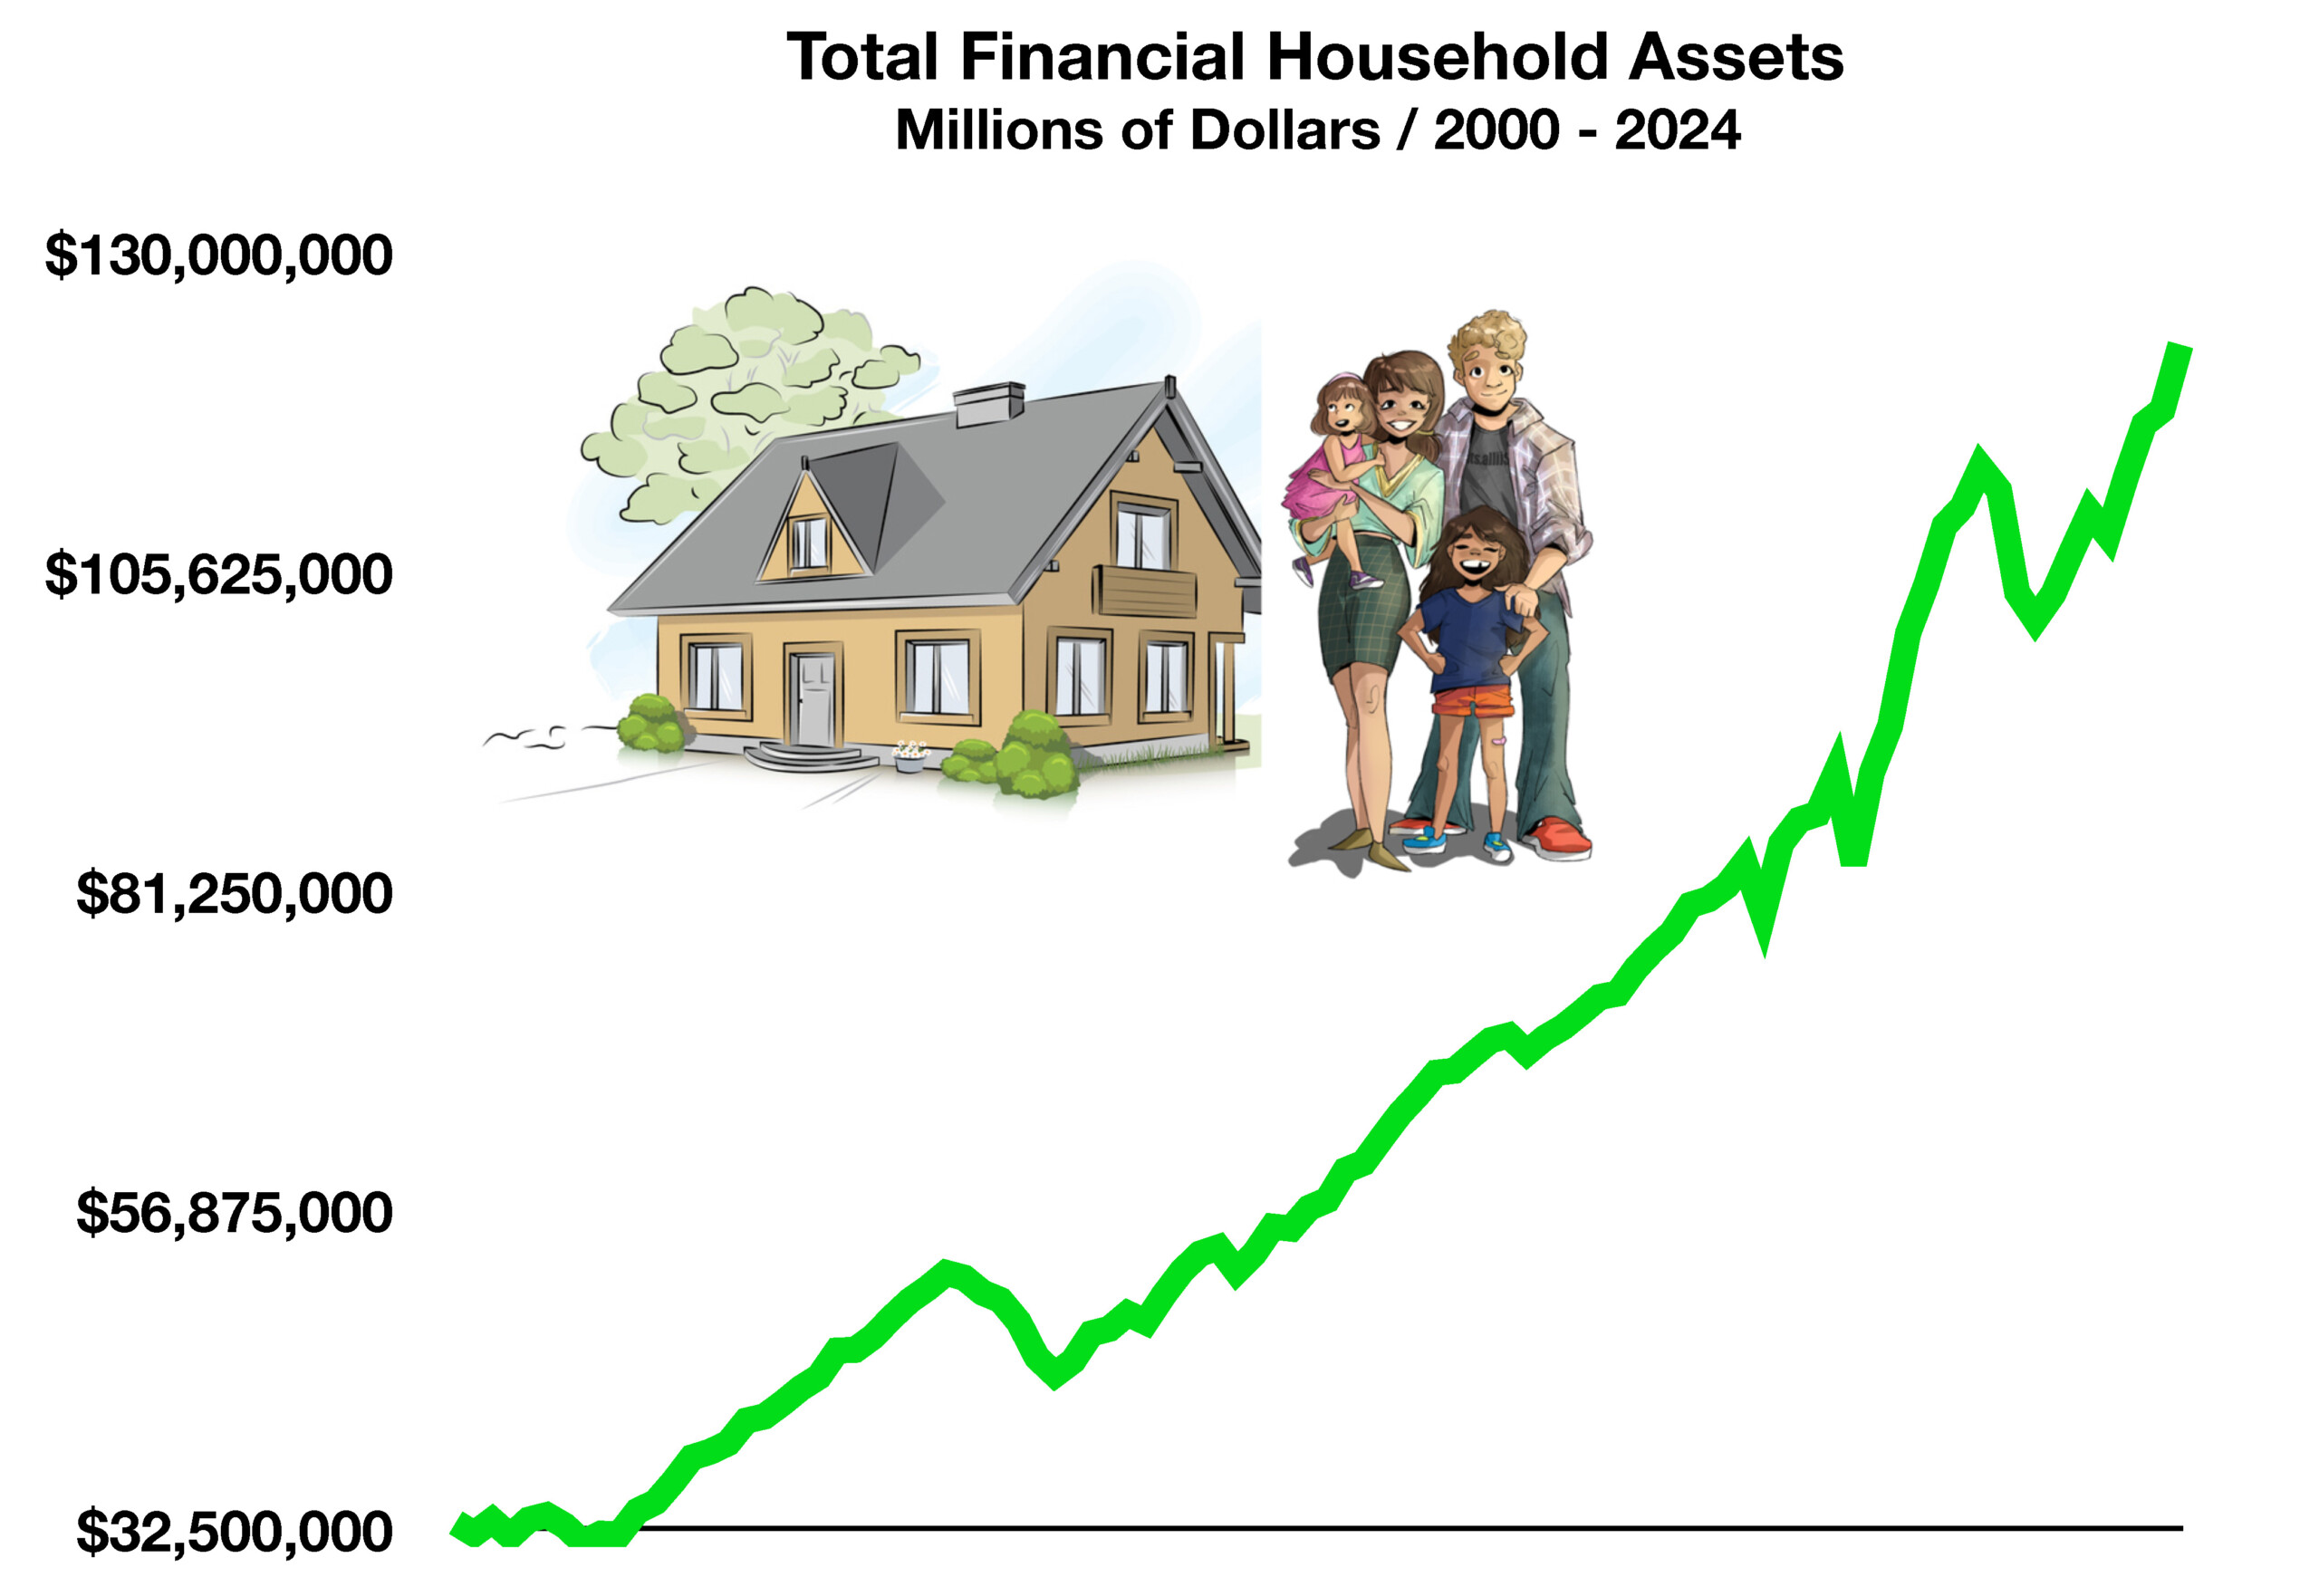
Those earning $250,000 and more now account for nearly half of all consumer spending. Rising home values and elevated stock portfolios over the past few years have helped propel spending among higher income earners. Economists attribute this to what is known as the wealth effect, essentially the confidence among consumers to spend more as asset values rise.

The President signed an executive order designating English as the official language of the United States. Establishing English as the official language may streamline communication in business and government, potentially reducing costs and improving efficiency.

Sources: U.S. Treasury, Dept.. of Commerce, NAR, S&P, Fed, BEA


Equities Response To Proposed Tariffs – Stock Market Overview

Equity indices broke from an upward trend as the threat of tariffs weighed on U.S. companies hesitant to pass along the higher costs. Margins contract as costs are absorbed by companies, diluting future earnings for corporations. Faltering consumer confidence was evident in February as the Consumer Discretionary sector of the S&P 500 Index saw a 7% decrease for the month. Technology saw a 2.26% drop in February, resulting from a lack of corporate capital investment and lessened consumer demand.

Foreign ownership of U.S. equities is currently $17.6 trillion, validating continued confidence in the transparency of the nation’s financial markets. Foreign entities, both governments and institutions, flock to the U.S. equity and bond markets for stability and liquidity. (Sources: Department of the Treasury, Federal Reserve Bank of New York)

Rates Steady As Inflation & Tariffs Alter Sentiment – Fixed Income Update

The U.S. Treasury is considering elongating federal debt, meaning that it would consider extending maturities of bonds rather than issuing short term maturities to fund current government expenditures. Treasury yields fell moderately across the yield curve with the 2 year Treasury yielding 3.99% at the end of February and the 10 year Treasury closing the month at 4.24%. Short term and long term Treasury yields have become flatter, meaning that yields across the maturity curve have become more similar across all maturities. Analysts believe that markets are dictating the direction of rates more so than the Federal Reserve, as Treasury initiatives and the threat of heightened inflation derail Fed plans to continue cutting rates. (Sources: Treasury Dept., Federal Reserve)

Household Asset Valuations Increase To Record Levels – Consumer Wealth

The value of household assets in the United States increased in 2024 to an all time high. The Federal Reserve tracks data that it gathers on assets held by households across the country. Economists believe that as household assets rise in value, so does the propensity for consumers to spend. The so called wealth effect encourages spending and instills confidence in consumers, as expenditures increase with underlying asset values rising.

Increasing real estate values and elevated stock prices have contributed substantial wealth to U.S. households over the past few years. According to data from the National Association of Realtors, home values across the nation are up 49% from five years earlier. The S&P 500 Index has risen over 33% over the past 3 years, adding considerable wealth to households. Largely appreciated assets are also being leveraged as homeowners borrow against the equity in their homes and stock portfolio accounts. (Sources: Fed, NAR)


Where Tariffs Could Hit Hardest – Trade Policy

Smaller companies are likely to see more of a negative impact of new tariffs rather than larger companies. The reliance on imported products by small companies throughout various industries has risen over the past few years. It is much more difficult for smaller companies to pass along tariff costs to consumers rather than larger companies because of distribution channels and capital constraints. Smaller companies also don’t have the scale and eventually end up absorbing these costs affecting their profitability. The United States continues to be one of the world’s largest importers, with a diverse range of products coming from countries including China, Mexico, Canada, Japan, and Germany.

Based on the newly imposed tariffs as of March 2025, several product categories are expected to be significantly affected:

Automobiles and auto parts: The 25% tariff on imports from Canada and Mexico is likely to impact the automotive industry substantially including the major auto manufacturers and smaller suppliers.

Fresh produce: Fruits and vegetables imported from Mexico and Canada will face increased costs.

Electronics: Devices such as phones, computers, and other electronic components from China will be subject to a 20% tariff.

Lumber: Canadian lumber imports will be affected by the 25% tariff, consequently affecting the housing market and home builders.

Energy products: While Canadian energy resources face a lower 10% tariff, they are still impacted.

Agricultural products: Consequently, U.S. exports of chicken, wheat, corn, cotton, soybeans, and pork to China will face retaliatory tariffs.

The amount of the actual tariffs may differ from what the White House has announced as of the beginning of March. Final implementation of targeted countries and products may also change as the administration negotiates with the country’s trade partners. (Sources: U.S. Bureau of Economic Analysis, Imports of goods and services [IEAMGSN], retrieved from FRED, Federal Reserve Bank of St. Louis; https://fred.stlouisfed.org)


Medical Expenses Increasing More Than Inflation – Healthcare Industry Update

Medical care expenses have been consistently increasing more than the overall expenses of all goods and services throughout the country. Many have seen healthcare costs rise faster than their wages over the past 20 years, making healthcare costs a larger component of household expenditures. From January 2000 to June 2024, medical related costs rose 121% while the costs of all other goods and services increased 86%.

Demographics have contributed and will continue to contribute to the costs of medical care, as a growing portion of the U.S. population ages, demanding more healthcare services. Elongated life expectancy has also increased the costs for more specialized medical care costing more.

Medicare benefits continue to provide for millions of Americans, yet Medicare is struggling to keep up with rising healthcare costs as the program’s expenses have increased substantially since its inception due to population growth, inflation, wasteful spending, and demand for new technologies. This has led to significant financial challenges for the Medicare program. The Medicare Part A Trust Fund is expected to be depleted by 2031, according to the 2023 Medicare Boards of Trustees report. Actions by Congress and an increase in tax revenue could alleviate the depletion. (Sources: BEA, Federal Reserve)

Top 10% of Earners Account for Half of All Spending – Demographics Overview

Consumers in the top 10%, earning an average of $250,000 or greater per year, account for roughly 50% of all consumer spending nationwide. These consumers are spending on everything from vacations to furniture to automobiles, as lower income consumers are spending less across the board. Rising home values and elevated stock portfolios have helped propel spending among higher income earners. Economists attribute this to what is known as the wealth effect, essentially the confidence among consumers to spend more as asset values rise. Such a disparity is also concern among economists, since any sudden retreat in spending by the top 10% of earners could lead to a retraction of consumer expenditures and economic expansion. (Sources: Federal Reserve, Dept. of Labor)