Ocean Park Capital Management

2503 Main Street

Santa Monica, CA 90405

Main: 310.392.7300

Daily Performance Line:  310.281.8577

February 2025
Market Update
(all values as of 02.28.2025)

Stock Indices:

Dow Jones 43,840
S&P 500 5,954
Nasdaq 18,847

Bond Sector Yields:

2 Yr Treasury 3.99%
10 Yr Treasury 4.24%
10 Yr Municipal 2.88%
High Yield 6.92%

YTD Market Returns:

Dow Jones 2.75%
S&P 500 1.23%
Nasdaq -2.40%
MSCI-EAFE 7.30%
MSCI-Europe 10.30%
MSCI-Pacific 0.90%
MSCI-Emg Mkt 6.60%
 
US Agg Bond 2.74%
US Corp Bond 2.60%
US Gov’t Bond 2.65%

Commodity Prices:

Gold 2,864
Silver 31.69
Oil (WTI) 70.07

Currencies:

Dollar / Euro 1.04
Dollar / Pound 1.26
Yen / Dollar 149.59
Canadian /Dollar 0.69

Portfolio Overview

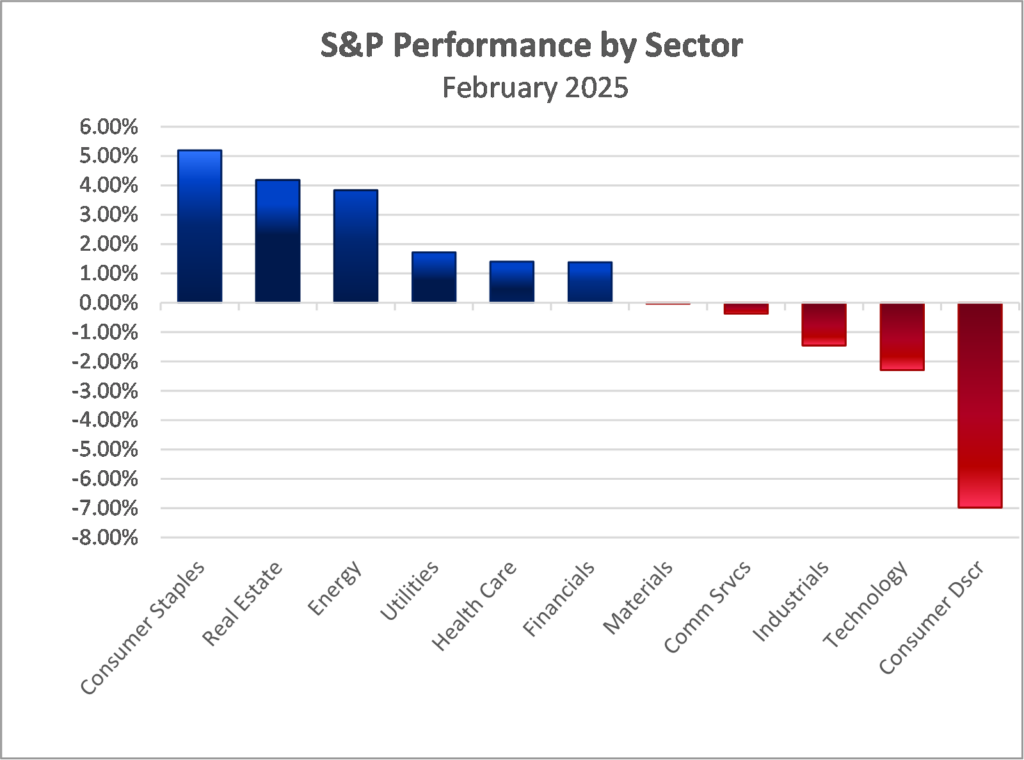
Equity markets declined in February amid rising economic uncertainty.  Ocean Park Investors Fund lost 5.57%*, while the S&P 500 lost 1.42% and the NASDAQ Composite lost 3.97%.  Consumer discretionary stocks, which comprise a significant portion of the fund, were particularly hard-hit with Amazon down 11%, Deckers Outdoor down 21%, and Elf Beauty down 29%.  Technology stocks also slumped, with Nvidia the lone bright spot (up 4%).

During February, we reduced positions in the consumer discretionary and service sector and increased our exposure to the broad-based IVV ETF.  We finished the month at about 97% net long, down from about 98% in January.


Daily updates on our activity are available on our Results Line, at 310-281-8577, and current information is also maintained on our website at www.oceanparkcapital.com. To gain access to the site enter password opcap.

*These results are pro forma. Actual results for most investors will vary. See additional disclosures on page 4. Past performance does not guarantee future results.

 
Equity Overview

Equity Overview

Five of eleven sectors in the S&P 500 declined in February, with consumer discretionary the worst loser.  Value stocks outperformed growth.  Volatility was moderate, as the S&P 500 moved more than 1% on 5 of 19 trading days. The forward price/earnings ratio was 21.2, still well above the 5-year and 10-year averages.

Fourth quarter earnings reported in February continued strong.  With 97% of S&P 500 companies reporting, 75% beat consensus earnings expectations which is slightly below the 1-year and 5-year averages.  Revenue beats came in at 63%, slightly above the 1-year average of 62% but below the 5-year average of 69%.


Macro Overview

Macro Overview

Economic headlines in February were cautionary.  Employment, retail sales, and housing were weak, and consumer confidence saw the largest decline in three years.  The Consumer Price Index rose more than expected, causing the Fed to maintain a cautious stance and defer further reductions in interest rates.

Investors focused on the potential impact of radical new policies on tariffs, taxes, and immigration initiated by the current administration in Washington.  Tariffs are particularly problematic because of their impact on growth.  They raise prices for consumers and can therefore inhibit consumer spending–which drives nearly 70% of GDP.  And their inflationary impact would almost certainly add to the Fed’s current reluctance to lower interest rates.  This combination would amount to “Stagflation,” the unusual phenomenon where recession combines with inflation.

However, some analysts believe the tariffs may be primarily a negotiation tactic and may not be fully implemented.  As always, we maintain a long-term perspective, acknowledging that market fluctuations are normal and temporary.


Additional Disclosures

Additional Disclosures

Performance data for OPI reflect the reinvestment of dividends and other earnings on the fund’s assets.  Performance data for the major indices reflect only changes in the value of those indices, and would be higher if dividends were included. However, the index data do not reflect fees that would be paid to index fund managers and transaction costs that would be incurred when their component stocks are bought or sold, while OPI’s data do reflect quarterly fees and expenses incurred by the fund.  The information provided is believed to be reliable, but its accuracy or completeness is not warranted. This material is not intended as an offer or solicitation for the purchase or sale of any stock, bond, mutual fund, or any other financial instrument. The views and strategies discussed herein may not be appropriate and/or suitable for all investors. This material is meant solely for informational purposes, and is not intended to suffice as any type of accounting, legal, tax, or estate planning advice. Any and all forecasts mentioned are for illustrative purposes only and should not be interpreted as investment recommendations.