
Fortis Wealth Management

(888) 336-7847 (3FORTIS)

www.investfortis.com

May 2026
Market Update
(all values as of 03.31.2026)

Stock Indices:

Dow Jones 46,341
S&P 500 6,528
Nasdaq 21,590

Bond Sector Yields:

2 Yr Treasury 3.79%
10 Yr Treasury 4.30%
10 Yr Municipal 3.08%
High Yield 7.25%

YTD Market Returns:

Dow Jones -3.58%
S&P 500 -4.63%
Nasdaq -7.11%
MSCI-EAFE -1.12%
MSCI-Europe -3.54%
MSCI-Far East 2.45%
MSCI-Emg Mkt -0.10%
 
US Agg Bond 0.29%
US Corp Bond 0.11%
US Gov’t Bond 0.11%

Commodity Prices:

Gold 4,692
Silver 75.43
Oil (WTI) 102.43

Currencies:

Dollar / Euro 1.14
Dollar / Pound 1.32
Yen / Dollar 159.66
Canadian /Dollar 0.71

Macro Overview

Economic growth accelerated in the first quarter, driven largely by continued heavy investment in artificial intelligence by major technology companies. At the same time, consumer sentiment weighed on spending as the Middle East conflict fueled unease and uncertainty among households.

Equity markets remained resilient in April as the Middle East conflict persisted. Earnings growth and investment in artificial intelligence underpinned optimism even as consumers contended with higher gasoline prices and elevated interest rates.

A newly appointed Fed chair, Kevin Warsh, is expected to assume leadership of the Federal Reserve on May 15, following the departure of current Chair Jerome Powell. The Fed will need to confront how to counter rising fuel costs and the inflationary pressures burdening consumers.

The nation’s debt surpassed 100% of GDP in April for the first time since the end of World War II. The U.S. government is currently spending $1.33 for every dollar it collects in tax and tariff revenue.

OPEC faced another setback in April after a key member, the United Arab Emirates, announced it would exit the cartel effective May 1. The collapse of Venezuela’s government and the war with Iran have severely disrupted the oil industries and output of both countries, each an OPEC member. Many oil-sector analysts now believe OPEC’s viability is dim and that the group is nearing eventual collapse.

Rising gasoline and diesel prices, which have driven transportation costs higher, have added to consumer anxiety. The University of Michigan’s consumer sentiment index fell to its lowest level in nearly 75 years. Credit card debt climbed to a record $1.3 trillion in the past month, and more consumers are falling behind on payments, signaling mounting stress in an increasingly bifurcated economy. Additional concerns are emerging as auto loan delinquencies and home foreclosures rise.

Government data show that consumers spent more in April, typically a positive economic signal, though the composition of that spending matters. A closer review indicates consumers spent $81.3 billion more on gasoline and energy in March 2026 than before the war with Iran began on February 28, with gasoline prices rising more than 40% since the conflict erupted. Higher fuel costs are expected to weigh on corporate earnings as they ripple through company operations and finances.

Airfares rose 15% in March from a year earlier, according to the U.S. Travel Association. Rising jet fuel prices are constraining airline profitability and cost management, with fuel accounting for 30% to 40% of total operating expenses.

China’s government ordered companies to disregard U.S. sanctions on several Chinese refiners tied to Iranian oil. The move is seen as an act of defiance, further straining an already tense relationship with the United States. (Sources: U.S. Treasury, EIA, Federal Reserve, U.S. Travel Association, University of Michigan)
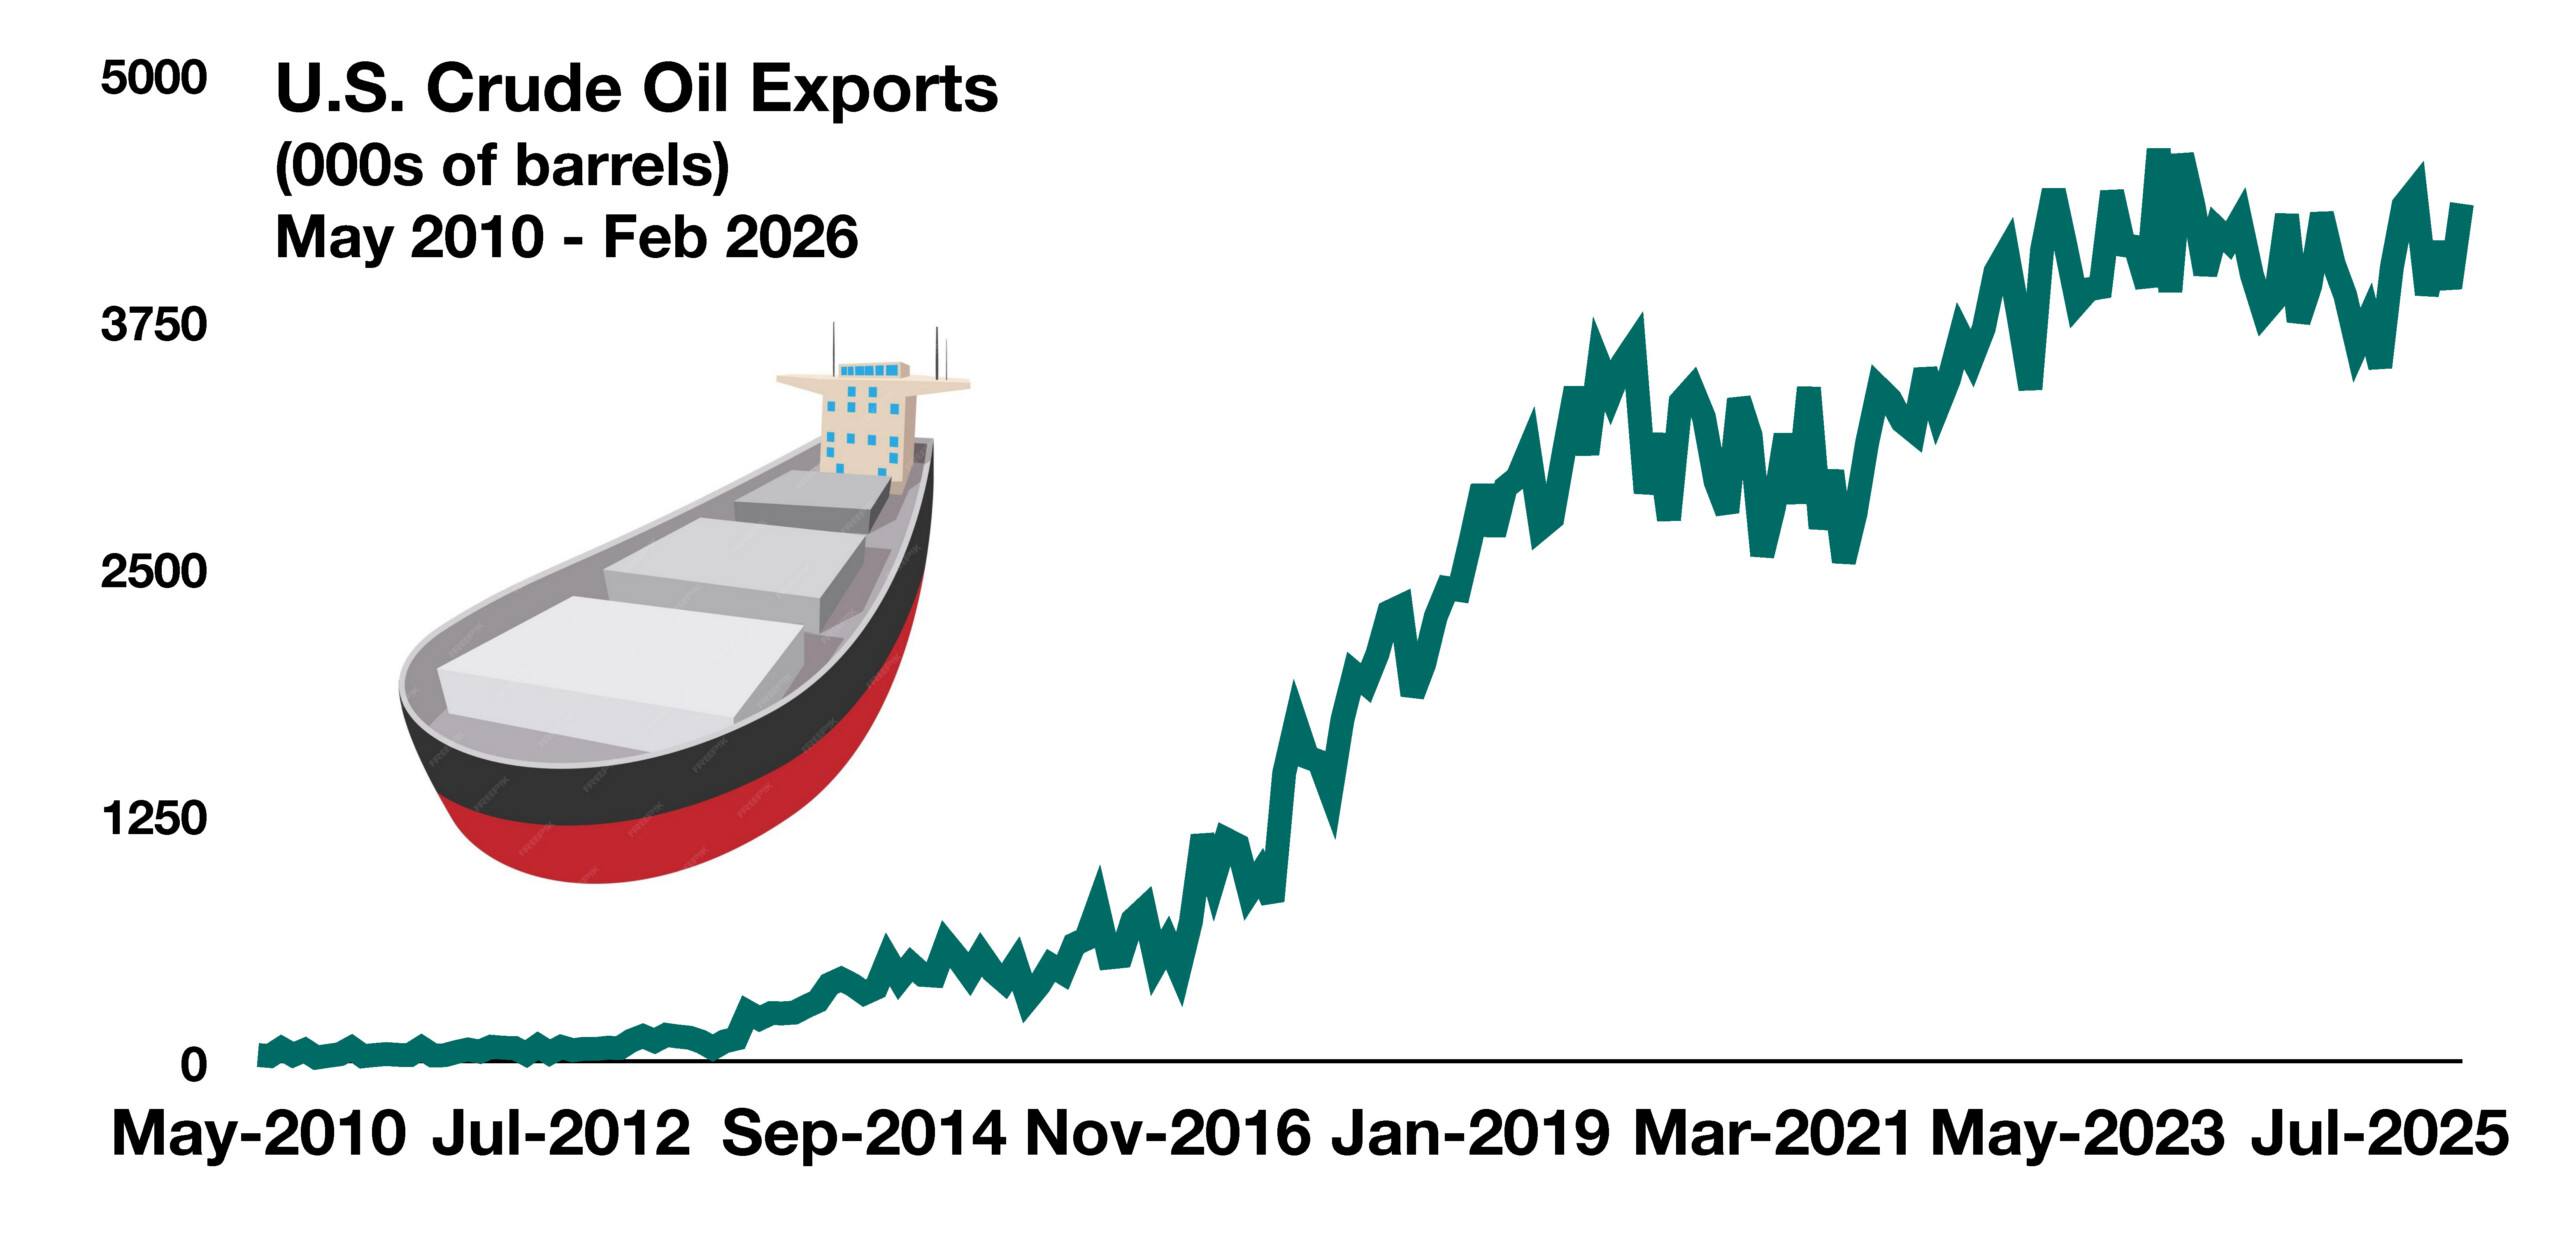
 
the U.S. is currently exporting 5.2 million barrels of oil per day

Equities Remain Resilient During Conflict – Domestic Equity Markets

A broad-based rally lifted stocks in April as markets shrugged off geopolitical tensions, oil-price volatility and inflation concerns. Strong corporate earnings and solid economic growth pushed equities across sectors higher, marking a sharp rebound from the brink of correction territory.

Technology shares rebounded in April as sustained investment in artificial intelligence drove improved growth prospects. Energy stocks also advanced, though they remain highly volatile amid continued uncertainty surrounding developments in the Middle East. (Sources: Dow Jones, S&P, Nasdaq)

Rates Under Pressure As Fed Grapples With Uncertainty – Fixed Income Update

Treasury yields rose in April as persistent inflation concerns and resilient economic growth pushed Treasury prices lower. The 10-year Treasury yield climbed to 4.40% at the end of March, up from 4.19% at the start of the year. Europe’s central bank, the European Central Bank, is considering raising interest rates to combat inflationary pressures stemming from the war in Ukraine and the conflict with Iran. Natural gas prices across Europe surged 70% in March following the closure of the Strait of Hormuz.

Anticipation regarding a newly appointed Fed chair has generated mixed expectations among fixed-income analysts and economists. Some expect Kevin Warsh to hold rates steady in light of underlying domestic growth and inflation data, while others believe the new chair may pursue rate cuts to ease the strain many consumers face from elevated borrowing costs. Fed officials remain divided on whether to reduce rates or keep them unchanged, a decision ultimately determined by the Federal Open Market Committee. (Sources: FOMC, Federal Reserve, U.S. Treasury)

U.S. Crude Oil Exports Rising – Domestic Energy Sector

The closure of the Strait of Hormuz has triggered a global shortage of crude oil, affecting Europe, Africa, the Americas and Asia. The disruption has effectively blocked about 15.8 million barrels per day of oil and refined products—roughly 15% of global supply—marking the largest supply shock since the 1973 oil embargo.

U.S. oil exports surged following the Consolidated Appropriations Act of 2016, bipartisan legislation that repealed a 40-year ban on crude oil exports established by the 1975 Energy Policy and Conservation Act. The nation’s production and export capacity has grown rapidly since the widespread adoption of hydraulic fracturing in the early 2000s. U.S. oil production now exceeds 14 million barrels per day, with roughly 5.2 million barrels exported daily. Industry experts estimate exports could ultimately be capped at 5 million to 6 million barrels per day due to constraints in infrastructure and port capacity for loading tankers.
(Sources: EIA, World Bank, U.S. Congress)


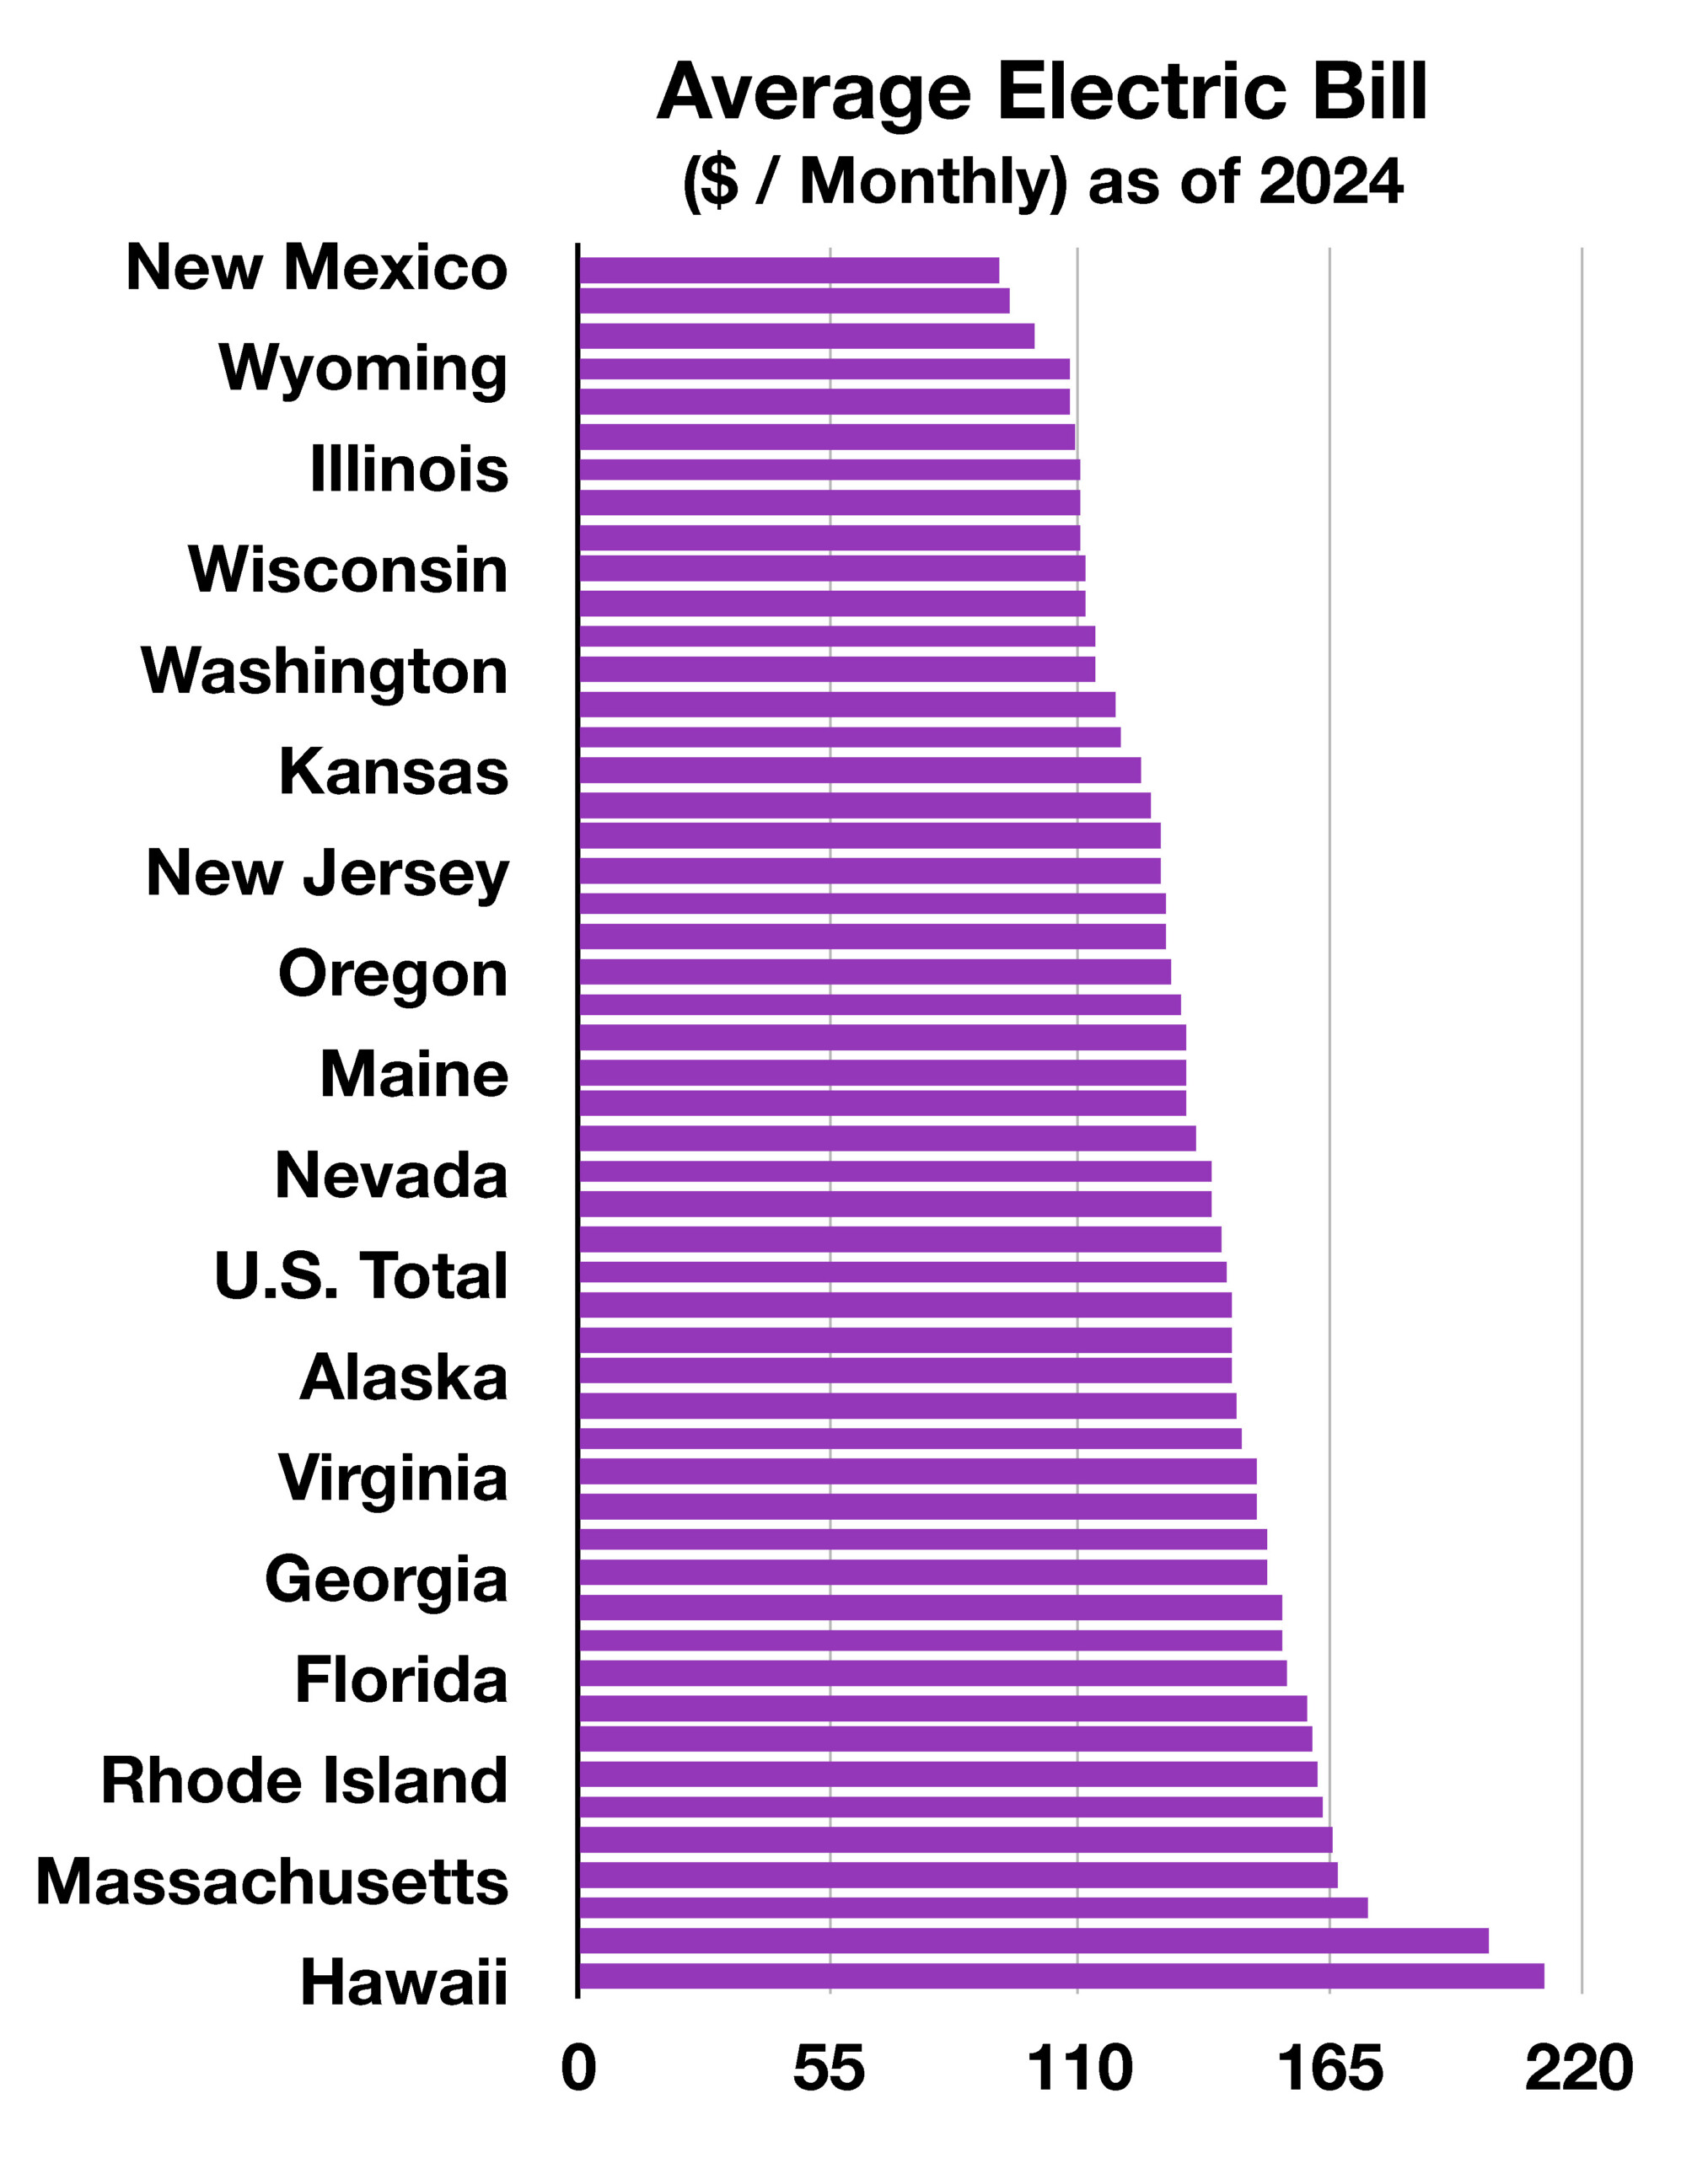
average electric bill nationally is $136 per month

How To Better Protect Your Accounts – Consumer Cybersecurity

Passwords are becoming increasingly vulnerable to hacking and security breaches as technological advances have made it easier to compromise what was once a secure process.

Passkeys are stored credentials that reside on user devices and are activated through authentication methods such as Face ID or Touch ID. These passkeys are also synchronized across all devices linked to the same user account, housed within a single system that associates each website or subscription with its corresponding login information.

Forgetting passwords, entering incorrect credentials or becoming locked out of accounts is no longer an issue with passkeys. The convenience and security they provide are gaining traction, with broader availability expanding across devices as updates continue. (Source: Cybersecurity and Infrastructure Security Agency (CISA))

How Electricity Costs Vary From State To State – Consumer Utilities Overview

Electricity use varies widely across states due to differences in regulatory frameworks and local climate conditions, both of which directly influence consumer demand. Utility bills also differ by state, reflecting the distinct costs of generating and delivering power in each region. Key factors include the mix of energy sources, the extent of transmission and distribution infrastructure required, state-level regulations, and overall household electricity consumption.

States that rely more heavily on low-cost hydropower, nuclear energy or natural gas typically have lower electricity bills than those dependent on imported fuels or expensive peak-power generation. Long transmission lines, storm hardening, wildfire mitigation, and aging infrastructure all contribute to higher delivery costs. Some states tightly regulate utilities, while others operate competitive retail markets, influencing how costs are passed on to consumers. Rural or sparsely populated states have fewer customers to share fixed grid costs, while dense urban areas often require more complex delivery systems. Weather is an increasingly important factor, as hot climates, cold winters and seasonal tourism can drive higher usage.

Hawaii and Alaska tend to have especially high electricity costs due to limited grid connectivity and reliance on imported fuels. California’s rates are shaped in part by wildfire-related grid investments and liability expenses, while northeastern states are often affected by natural gas constraints and winter demand surges. (Sources: EIA, Dept. of Energy)

 
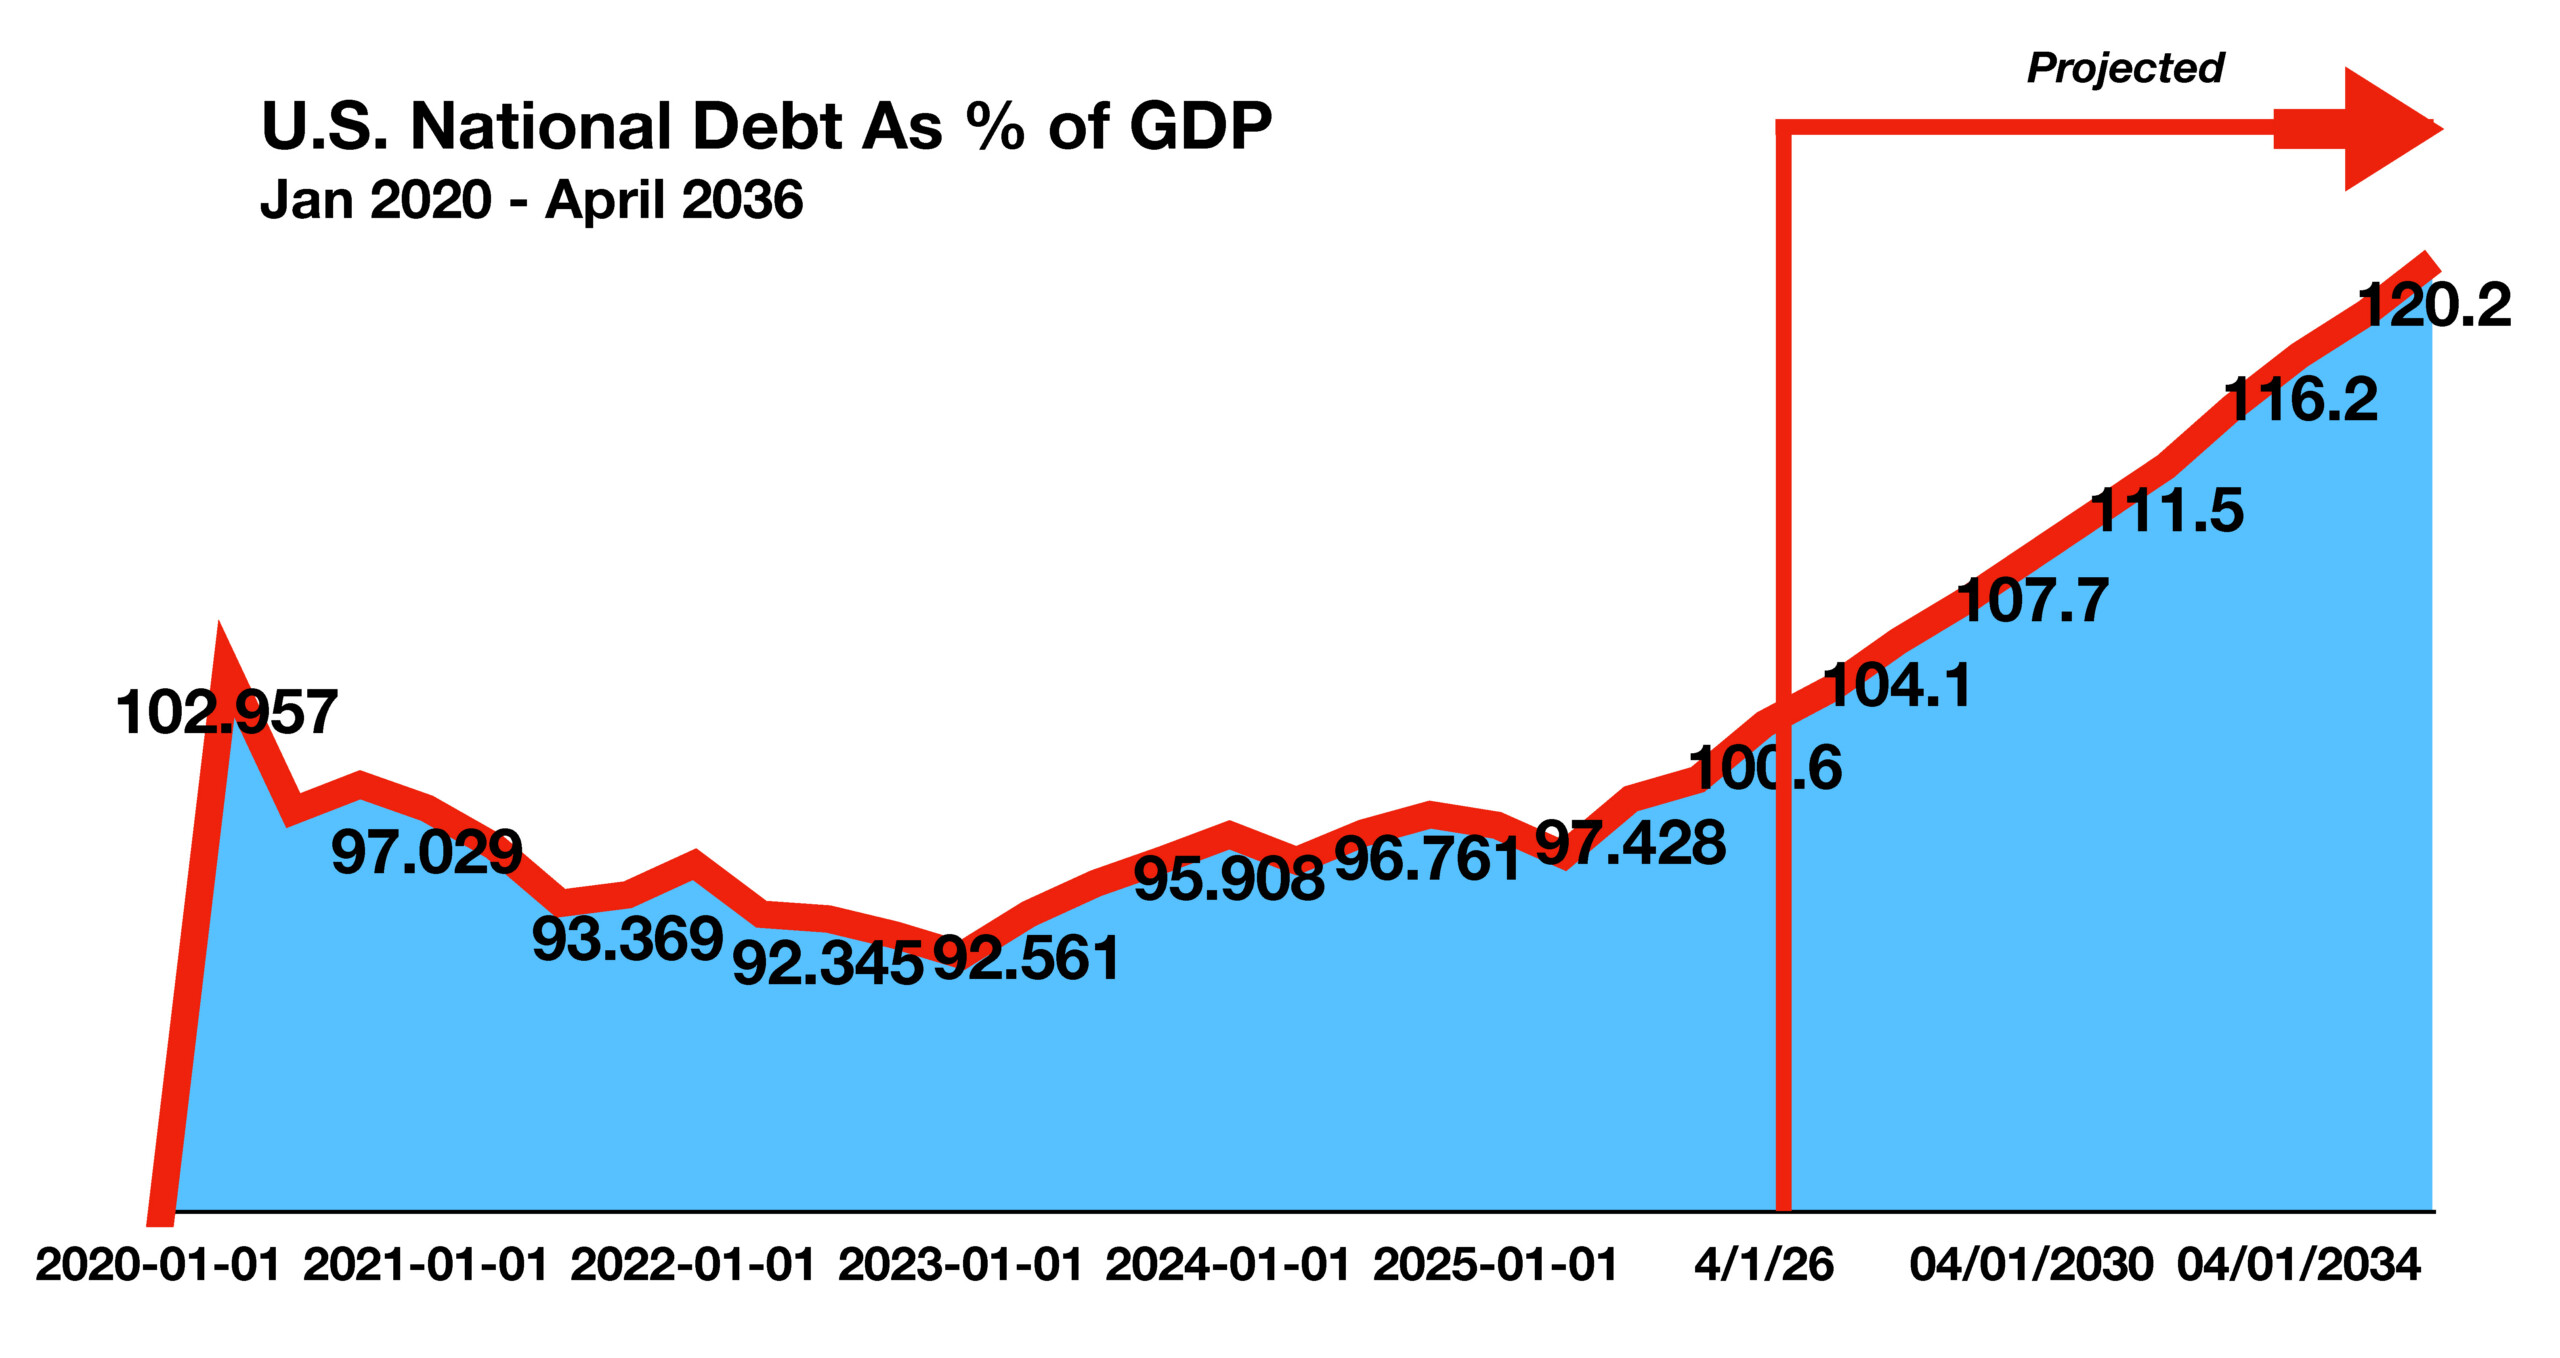
the U.S. government is spending $1.33 for every dollar it collects in revenue

U.S. Debt Surpasses 100% of GDP – Fiscal Policy

The national debt reached 100.2% of gross domestic product at the end of March 2026, the highest level since the end of World War II. Government debt held by the public totaled $31.27 trillion as of March 31, while GDP for the preceding 12 months was $31.22 trillion. The U.S. government is spending $1.33 for every dollar it collects in revenue.

Various factors are expected to influence the level of debt and projected revenue in the coming months, including the cost of the war with Iran, tariff reimbursements and the pace of economic growth. Historically, increases in exports have helped reduce the nation’s debt burden.

Economists monitor the debt-to-GDP ratio as a measure of how heavily the country’s obligations weigh on the broader economy. Rising debt can divert resources from other priorities, including education, defense, social programs and potential tax relief.

The debt briefly exceeded 100% of GDP during the pandemic in 2020, when economic output contracted and the government sharply increased borrowing to support households through relief payments totaling more than $800 billion.

Sources: U.S. Treasury, U.S. Government Accountability Office (GAO), Committee for a Responsible Federal Budget