
Ocean Park Capital Management

2503 Main Street

Santa Monica, CA 90405

Main: 310.392.7300

Daily Performance Line:  310.281.8577

April 2026
Market Update
(all values as of 03.31.2026)

Stock Indices:

Dow Jones 46,341
S&P 500 6,528
Nasdaq 21,590

Bond Sector Yields:

2 Yr Treasury 3.79%
10 Yr Treasury 4.30%
10 Yr Municipal 3.08%
High Yield 7.25%

YTD Market Returns:

Dow Jones -3.58%
S&P 500 -4.63%
Nasdaq -7.11%
MSCI-EAFE -1.12%
MSCI-Europe -3.54%
MSCI-Far East 2.45%
MSCI-Emg Mkt -0.10%
 
US Agg Bond 0.29%
US Corp Bond 0.11%
US Gov’t Bond 0.11%

Commodity Prices:

Gold 4,692
Silver 75.43
Oil (WTI) 102.43

Currencies:

Dollar / Euro 1.14
Dollar / Pound 1.32
Yen / Dollar 159.66
Canadian /Dollar 0.71

Portfolio Overview

April was an extraordinary month for Ocean Park Investors Fund, which gained 17.87%* while the S&P 500 rose 10.42% and the NASDAQ Composite rose 15.29%.  The fund’s outperformance was driven by a concentrated group of holdings in memory storage and optical networking — two technology subsectors indispensable to the buildout of AI infrastructure and data center applications.

Astera Labs, provider of connectivity solutions to AI and cloud data centers, surged 77%. Seagate Technology, whose hard disk drives provide storage for AI training datasets, gained 72%. Western Digital, a supplier of both hard disk and flash storage, advanced 60%. Micron Technology, which manufactures memory components crucial to every AI accelerator system, rose 53%.  Optical networking stocks also contributed as Lumentum (up 28%), Coherent (up 34%), and Ciena (up 36%) reported orders extending into 2027 and 2028.

For each of these positions, our research identified a mismatch between consensus expectations and what we believed were the true growth trajectories of these businesses. That caused us to hold these positions through periods of uncertainty earlier in the year, and to reap the benefits when the market came around to our view.
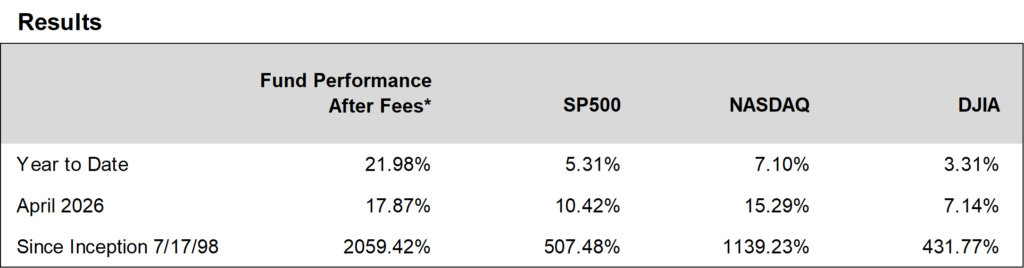
*These results are pro forma. Actual results for most investors will vary. Daily updates on our activity are available on our Results Line, at 310-281-8577, and on our website at www.oceanparkcapital.com. Enter password opcap. Past performance does not guarantee future results.



Equity Overview

Equity Overview

The S&P 500 and the NASDAQ Composite reached all-time highs in April, completely reversing the losses in March.  Nine of eleven sectors in the S&P 500 rose, with Technology the big winner and Energy the worst loser.  Growth stocks outperformed value.  Volatility was moderate as the S&P 500 moved more than 1% on 5 of 21 trading days.

First quarter earnings reported in April were stellar.  With 63% of S&P 500 companies reporting, aggregate earnings are 20.7% above analyst expectations. Similarly, 84% of companies have beaten consensus earnings expectations and 81% have beaten consensus revenue expectations.  All of these results are dramatically above the one-year and five-year averages.


Macro Overview

Macro Overview

 Two competing forces defined the macroeconomic backdrop in April: the ongoing strain of the Iran conflict on energy prices and global growth, and an unexpectedly powerful surge in corporate earnings. The IMF warned that the war had “halted” global economic momentum, revising its 2026 growth forecast down to 3.1% while raising its inflation forecast. Oil prices spiked above $126 per barrel intraday before closing the month near $109 — more than 60% above pre-conflict levels.

The Federal Reserve held interest rates steady at its April meeting, in what may prove to be Jerome Powell’s final meeting as Chairman. The accompanying commentary signaled that a rate hike has joined a rate cut as a live possibility, as the Fed weighs resilient growth and sticky inflation against the risk of deceleration from sustained high energy prices. Treasury yields rose on the announcement, with the 2-year closing at 3.93% and the 10-year at 4.42%.


Additional Disclosures

Additional Disclosures

Performance data for OPI reflect the reinvestment of dividends and other earnings on the fund’s assets.  Performance data for the major indices reflect only changes in the value of those indices, and would be higher if dividends were included. However, the index data do not reflect fees that would be paid to index fund managers and transaction costs that would be incurred when their component stocks are bought or sold, while OPI’s data do reflect quarterly fees and expenses incurred by the fund.  The information provided is believed to be reliable, but its accuracy or completeness is not warranted. This material is not intended as an offer or solicitation for the purchase or sale of any stock, bond, mutual fund, or any other financial instrument. The views and strategies discussed herein may not be appropriate and/or suitable for all investors. This material is meant solely for informational purposes, and is not intended to suffice as any type of accounting, legal, tax, or estate planning advice. Any and all forecasts mentioned are for illustrative purposes only and should not be interpreted as investment recommendations.