Alex Gregory Garcia
AGG Asset Management, LLC
875 S. Westlake Blvd, Suite 218
Westlake Village, CA 91361
805.496.3344
| Dow Jones | 49,652 |
| S&P 500 | 7,209 |
| Nasdaq | 24,892 |
| 2 Yr Treasury | 3.88% |
| 10 Yr Treasury | 4.40% |
| 10 Yr Municipal | 2.96% |
| High Yield | 6.87% |
| Dow Jones | 3.31% |
| S&P 500 | 5.31% |
| Nasdaq | 7.10% |
| MSCI-EAFE | 5.04% |
| MSCI-Europe | 2.95% |
| MSCI-Far East | 9.09% |
| MSCI-Emg Mkt | 13.94% |
| US Agg Bond | 0.07% |
| US Corp Bond | -0.09% |
| US Gov’t Bond | -0.08% |
| Gold | 4,641 |
| Silver | 74.65 |
| Oil (WTI) | 105.76 |
| Dollar / Euro | 1.16 |
| Dollar / Pound | 1.34 |
| Yen / Dollar | 159.95 |
| Canadian /Dollar | 0.73 |
Macro Overview
Economic growth increased in the first quarter primarily driven by continued massive investment in artificial intelligence by major technology companies. Concurrently, consumer sentiment weighed on expenditures as the Middle East conflict stirred uneasiness and uncertainty among consumers.
Equity markets maintained a resilient stance in April as the Middle East conflict continued. Earnings growth and artificial intelligence investment drove optimism as consumers struggled with rising gasoline prices and elevated interest rates.
A newly appointed Fed Chair, Kevin Warsh, is expected to take the helm at the Federal Reserve on May 15th, following the exit of current Chair, Jerome Powell. The Fed will need to grapple with how to counter rising fuel costs and the inflationary factors hindering consumers.
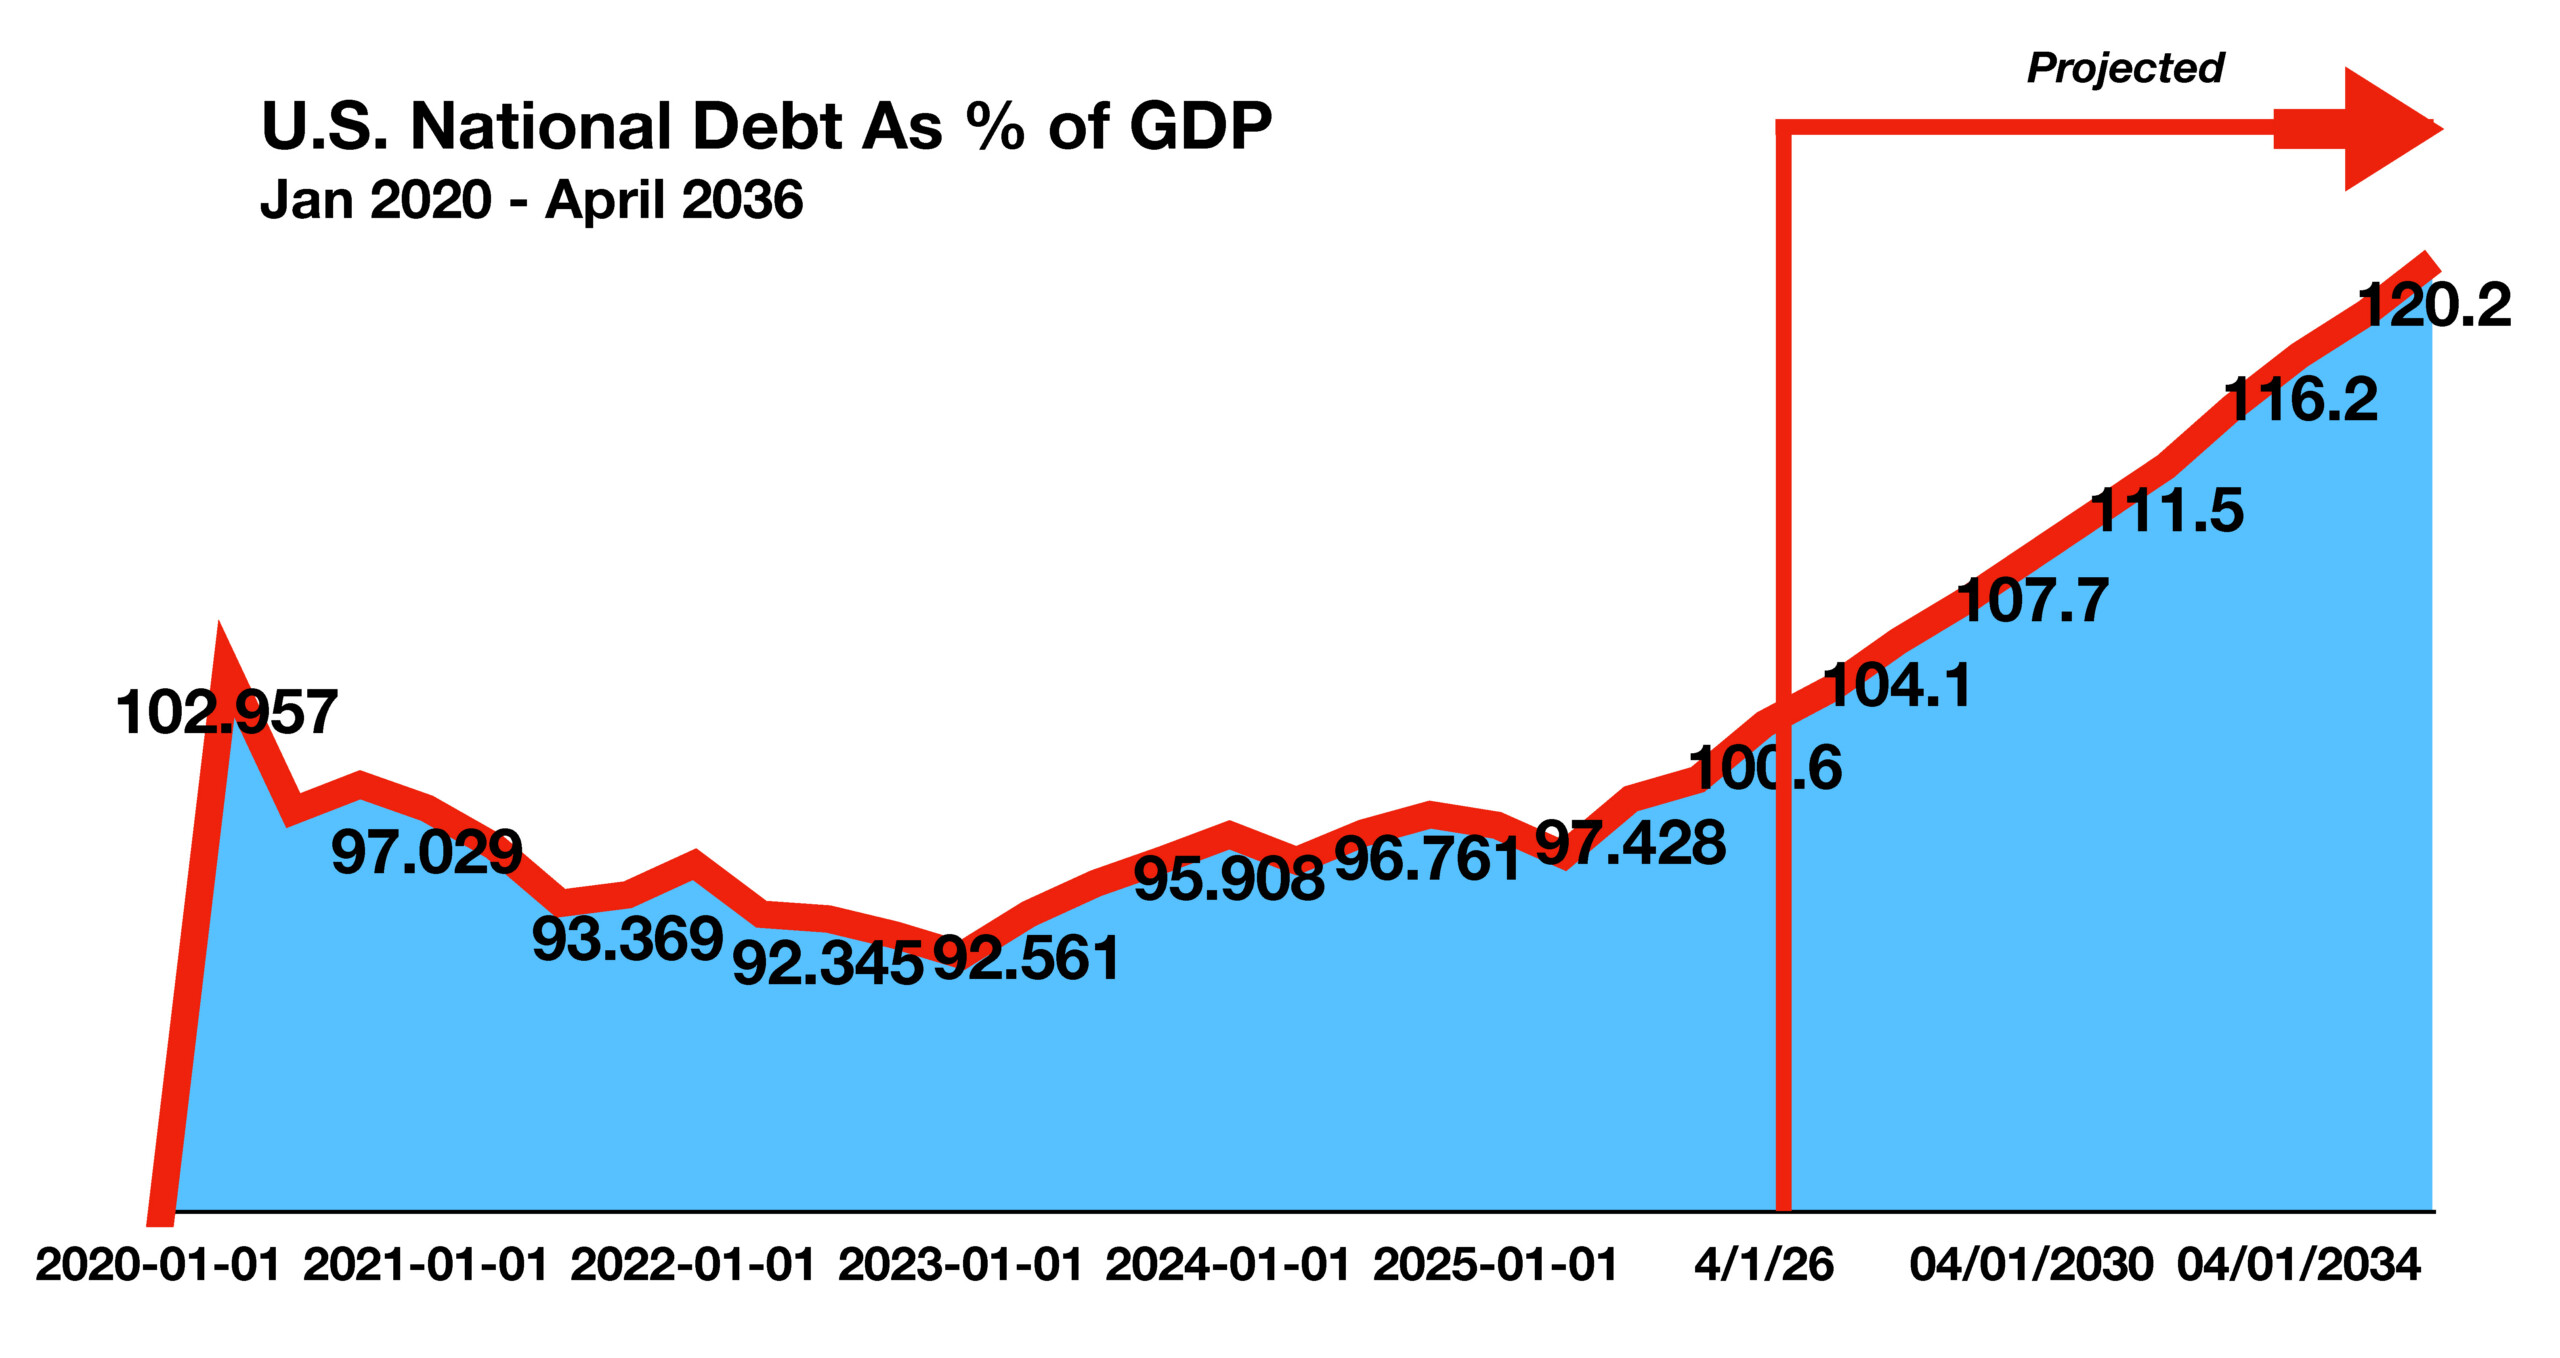
The nation’s debt surpassed 100 percent of GDP in April for the first time since the end of World War II. The U.S. government is currently spending $1.33 for every dollar it collects in tax and tariff revenue.
OPEC was dealt another setback in April, as one of its primary members, United Arab Emirates (UAE), announced its exit from the intergovernmental cartel effective May 1st. The collapse of Venezuela’s government and the war with Iran have seriously affected the oil industries and output for both Iran and Venezuela, each OPEC members. Numerous oil sector analysts believe that OPEC’s continuance is dim and on the eventual verge of collapse.
Rising gasoline and diesel prices resulting in soaring transportation costs, have added to consumer anxiety. The University of Michigan consumer sentiment index fell to its lowest level in nearly 75 years. Credit card debt has risen to a record $1.3 trillion this past month and more consumers are falling behind on payments, suggesting growing stress in an increasingly bifurcated economy. Additional areas of concern are surfacing with rising auto loan delinquencies and home foreclosures.
Government data showed that consumers were spending more in April, usually a positive sign for the economy, yet dependent on where it is spent. Careful review of the data reveals that consumers spent $81.3 billion more on gasoline and energy in March 2026 than before the war with Iran began on February 28th, with gasoline prices rising by over 40% since the conflict erupted. Higher gasoline and diesel costs are expected to curtail company earnings as increased fuel costs filter through company operations and finances.
Airfares were up 15% in March from a year ago as reported by the U.S. Travel Association. Rising jet fuel costs are hampering airline profitability and cost management, with fuel costs amounting to 30-40% of airliners’ total operating expenses.
The Chinese government ordered companies to ignore U.S. sanctions on several Chinese refiners associated with oil from Iran. China’s actions are considered an act of defiance, further aggravating an already strained relationship with the U.S. (Sources: U.S. Treasury, EIA, Federal Reserve, U.S. Travel Association, Univ. of Michigan)
Equities Remain Resilient During Conflict – Domestic Equity Markets
A broad-based advancement propelled stocks higher in April, as markets shook off tensions surrounding geopolitical concerns, oil price volatility, and inflationary fears. Strong corporate earnings and robust economic growth drove equities across various sectors higher, in a dramatic turnaround from approaching the precipice of correction territory.
Technology sector stocks rebounded in April as continued investment in artificial intelligence (AI) drove future growth prospects higher. Energy and oil sector stocks performed well, but are still subject to tremendous volatility due to the uncertainty of events in the Middle East. (Sources: Dow Jones, S&P, Nasdaq)
Rates Under Pressure As Fed Grapples With Uncertainty – Fixed Income Update
Treasury yields rose in April as persistent inflationary anxiety and tenacious economic growth drove Treasury prices lower. The 10-year Treasury Bond yield rose to 4.40% at the end of March, up from 4.19% at the beginning of the year. The equivalent of the Fed in Europe, the ECB, is considering raising interest rates in Europe to combat inflationary pressures brought about by the war with Ukraine and the conflict with Iran. Natural gas prices throughout Europe spiked 70% in March following the closure of the Strait of Hormuz.
The anticipation of a newly appointed Fed Chair drew mixed expectations among fixed income analysts and economists. Some believe that Kevin Warsh may hold rates steady due to underlying domestic growth and inflation data, while others expect the new Chair to attempt to cut rates in order to help minimize the duress many consumers are experiencing with elevated rates. Fed members are currently at odds as to cutting rates or holding them steady, which is eventually decided on by the Federal Open Market Committee (FOMC). (Sources: FOMC, Federal Reserve, U.S. Treasury)
U.S. Crude Oil Exports Rising – Domestic Energy Sector
The closure of the Strait of Hormuz has created a global shortage of crude oil affecting Europe, Africa, the Americas, and Asia. The effective closure of the Strait of Hormuz has blocked approximately 15.8 million barrels per day of oil and refined products, representing about 15% of the global oil supply, amounting to the largest supply shock since the 1973 oil embargo.
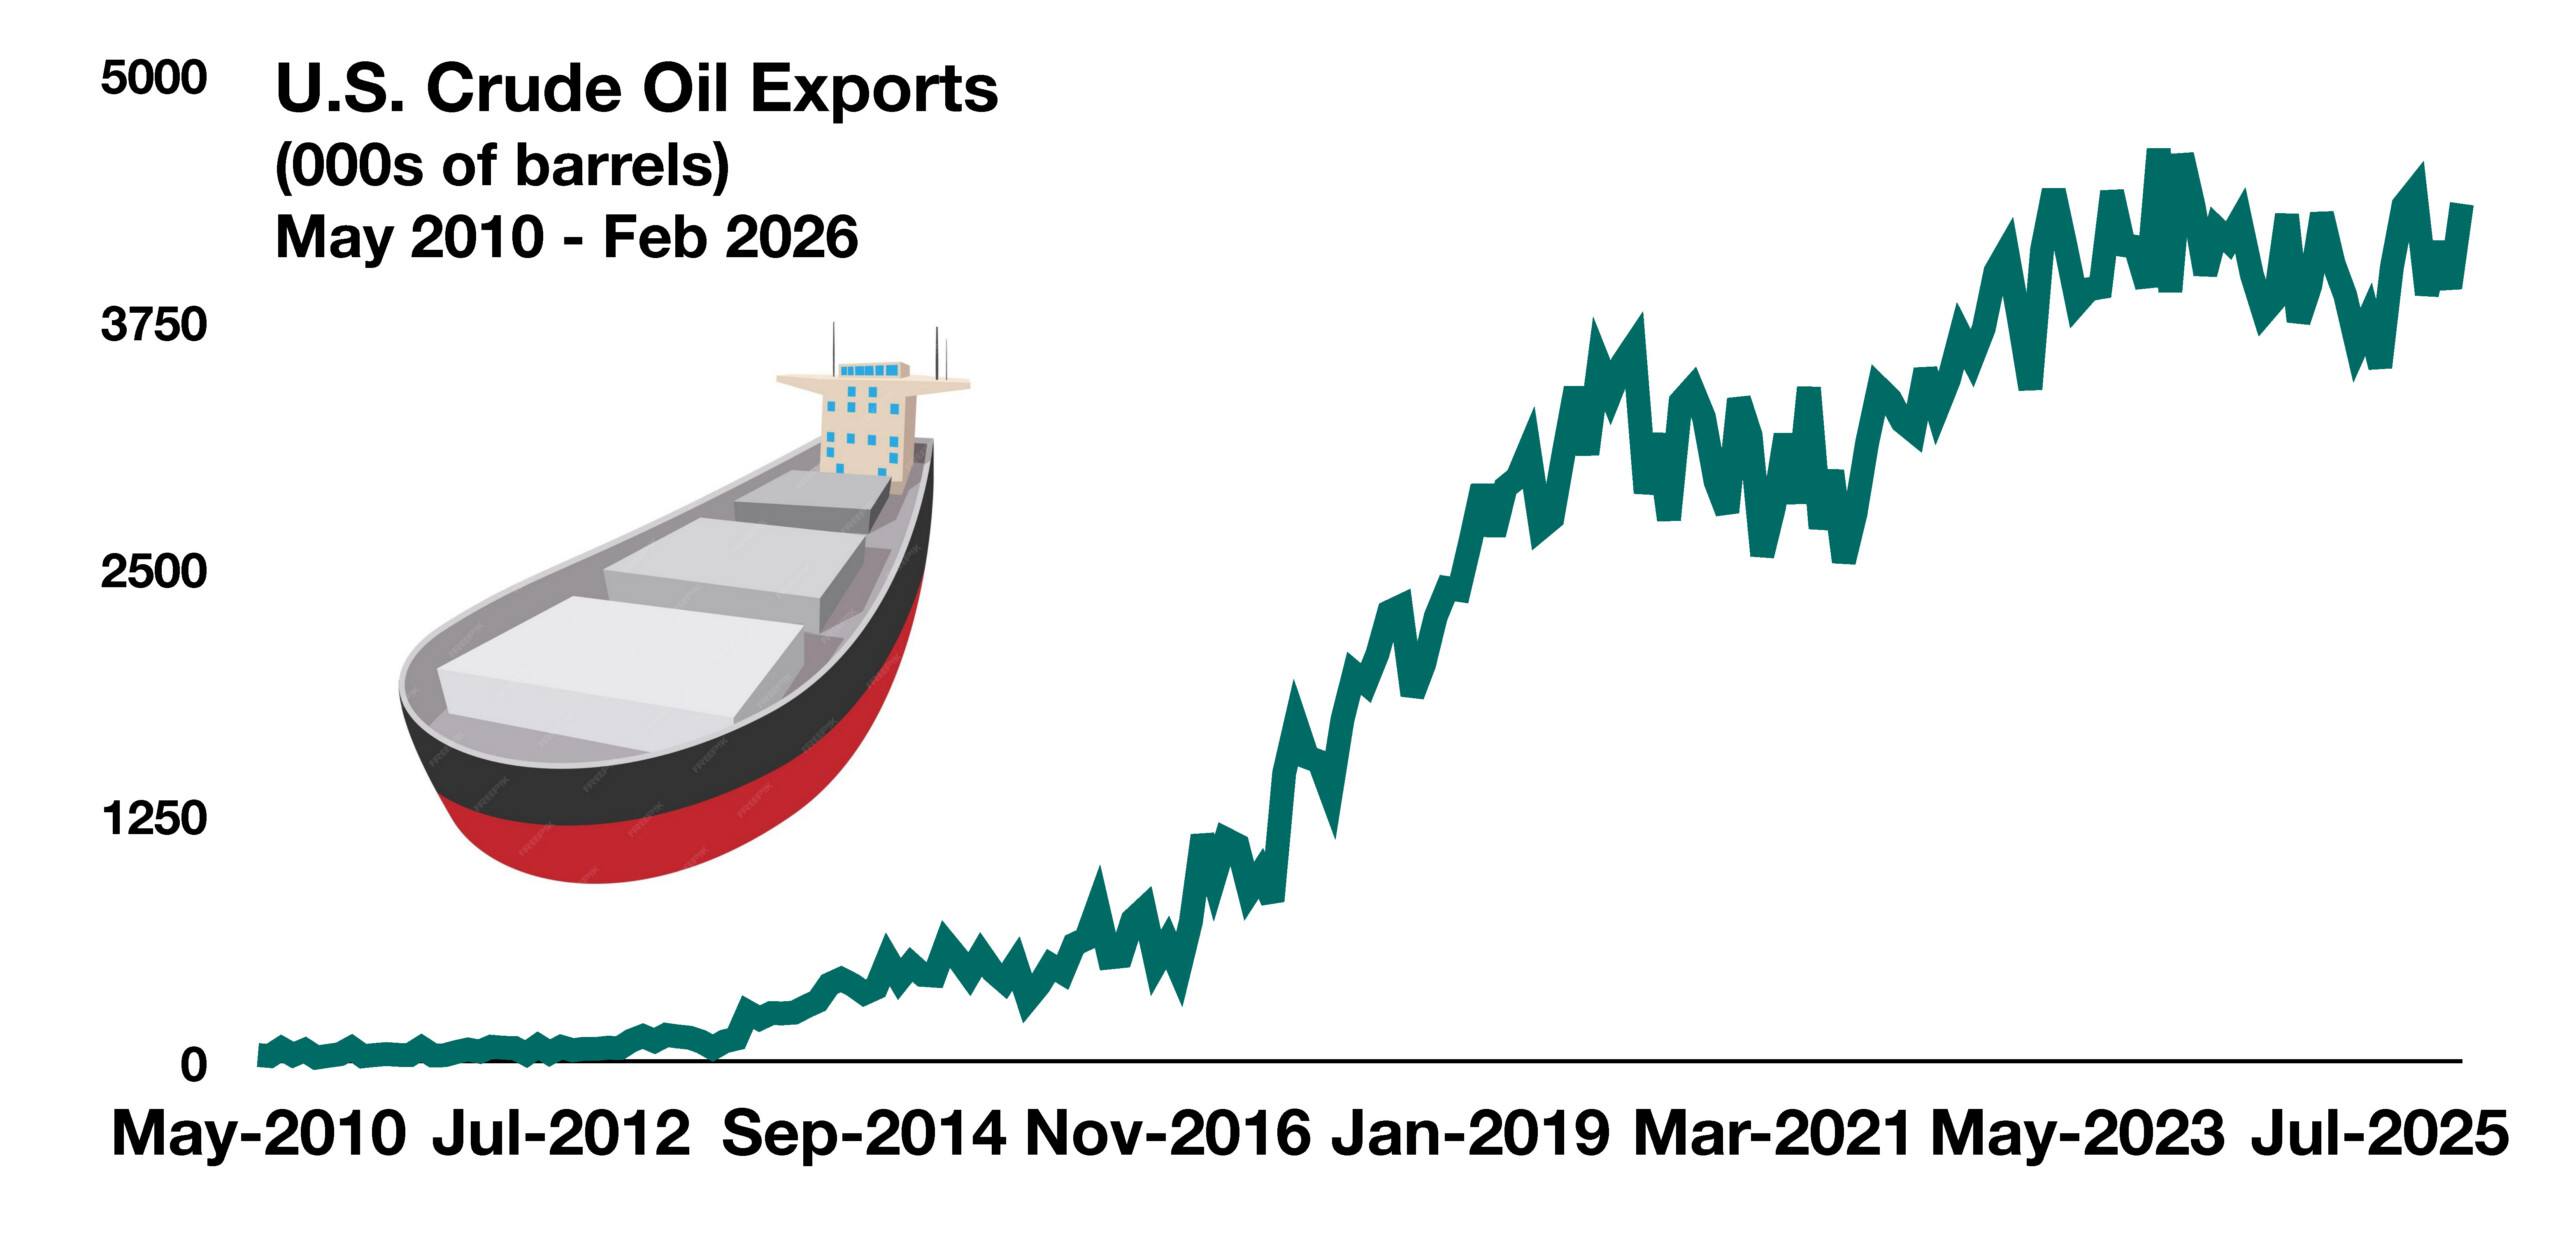
U.S. oil exports exploded following the Consolidated Appropriations Act of 2016, a bipartisan legislation that repealed a 40-year-old ban on crude oil exports instituted by the 1975 Energy Policy and Conservation Act. The country’s production and exporting capability has risen exponentially since the wide spread utilization of hydraulic fracking in the early 2000s. U.S. oil production is currently eclipsing 14 million barrels per day, with roughly 5.2 million barrels being exported per day. Oil industry experts estimate that oil exports will eventually be constrained to 5-6 million barrels per day, due to limited infrastructure and port availability to load exporting tankers. (Sources: EIA, World Bank, U.S. Congress)
How To Better Protect Your Accounts Instead Of Using Passwords – Consumer Cybersecurity
Passwords are becoming more susceptible to hackers and security breaches as technological advancements have facilitated the compromise of a once secure process.
Passkeys are saved passwords that appear on user devices and are activated with some form of identification by Face ID or Touch ID technology. Additionally, these passkeys are shared among all devices under the same username, housed in a single system that lists each website or subscription to its according log-in information.
Forgetting passwords or guessing the wrong password and being locked out no longer becomes an issue with passkeys. The ease and security of using passkeys is growing and becoming available on more devices as updates occur. (Source: Cybersecurity and Infrastructure Security Agency (CISA))
How Electricity Costs Vary From State To State – Consumer Utilities Overview
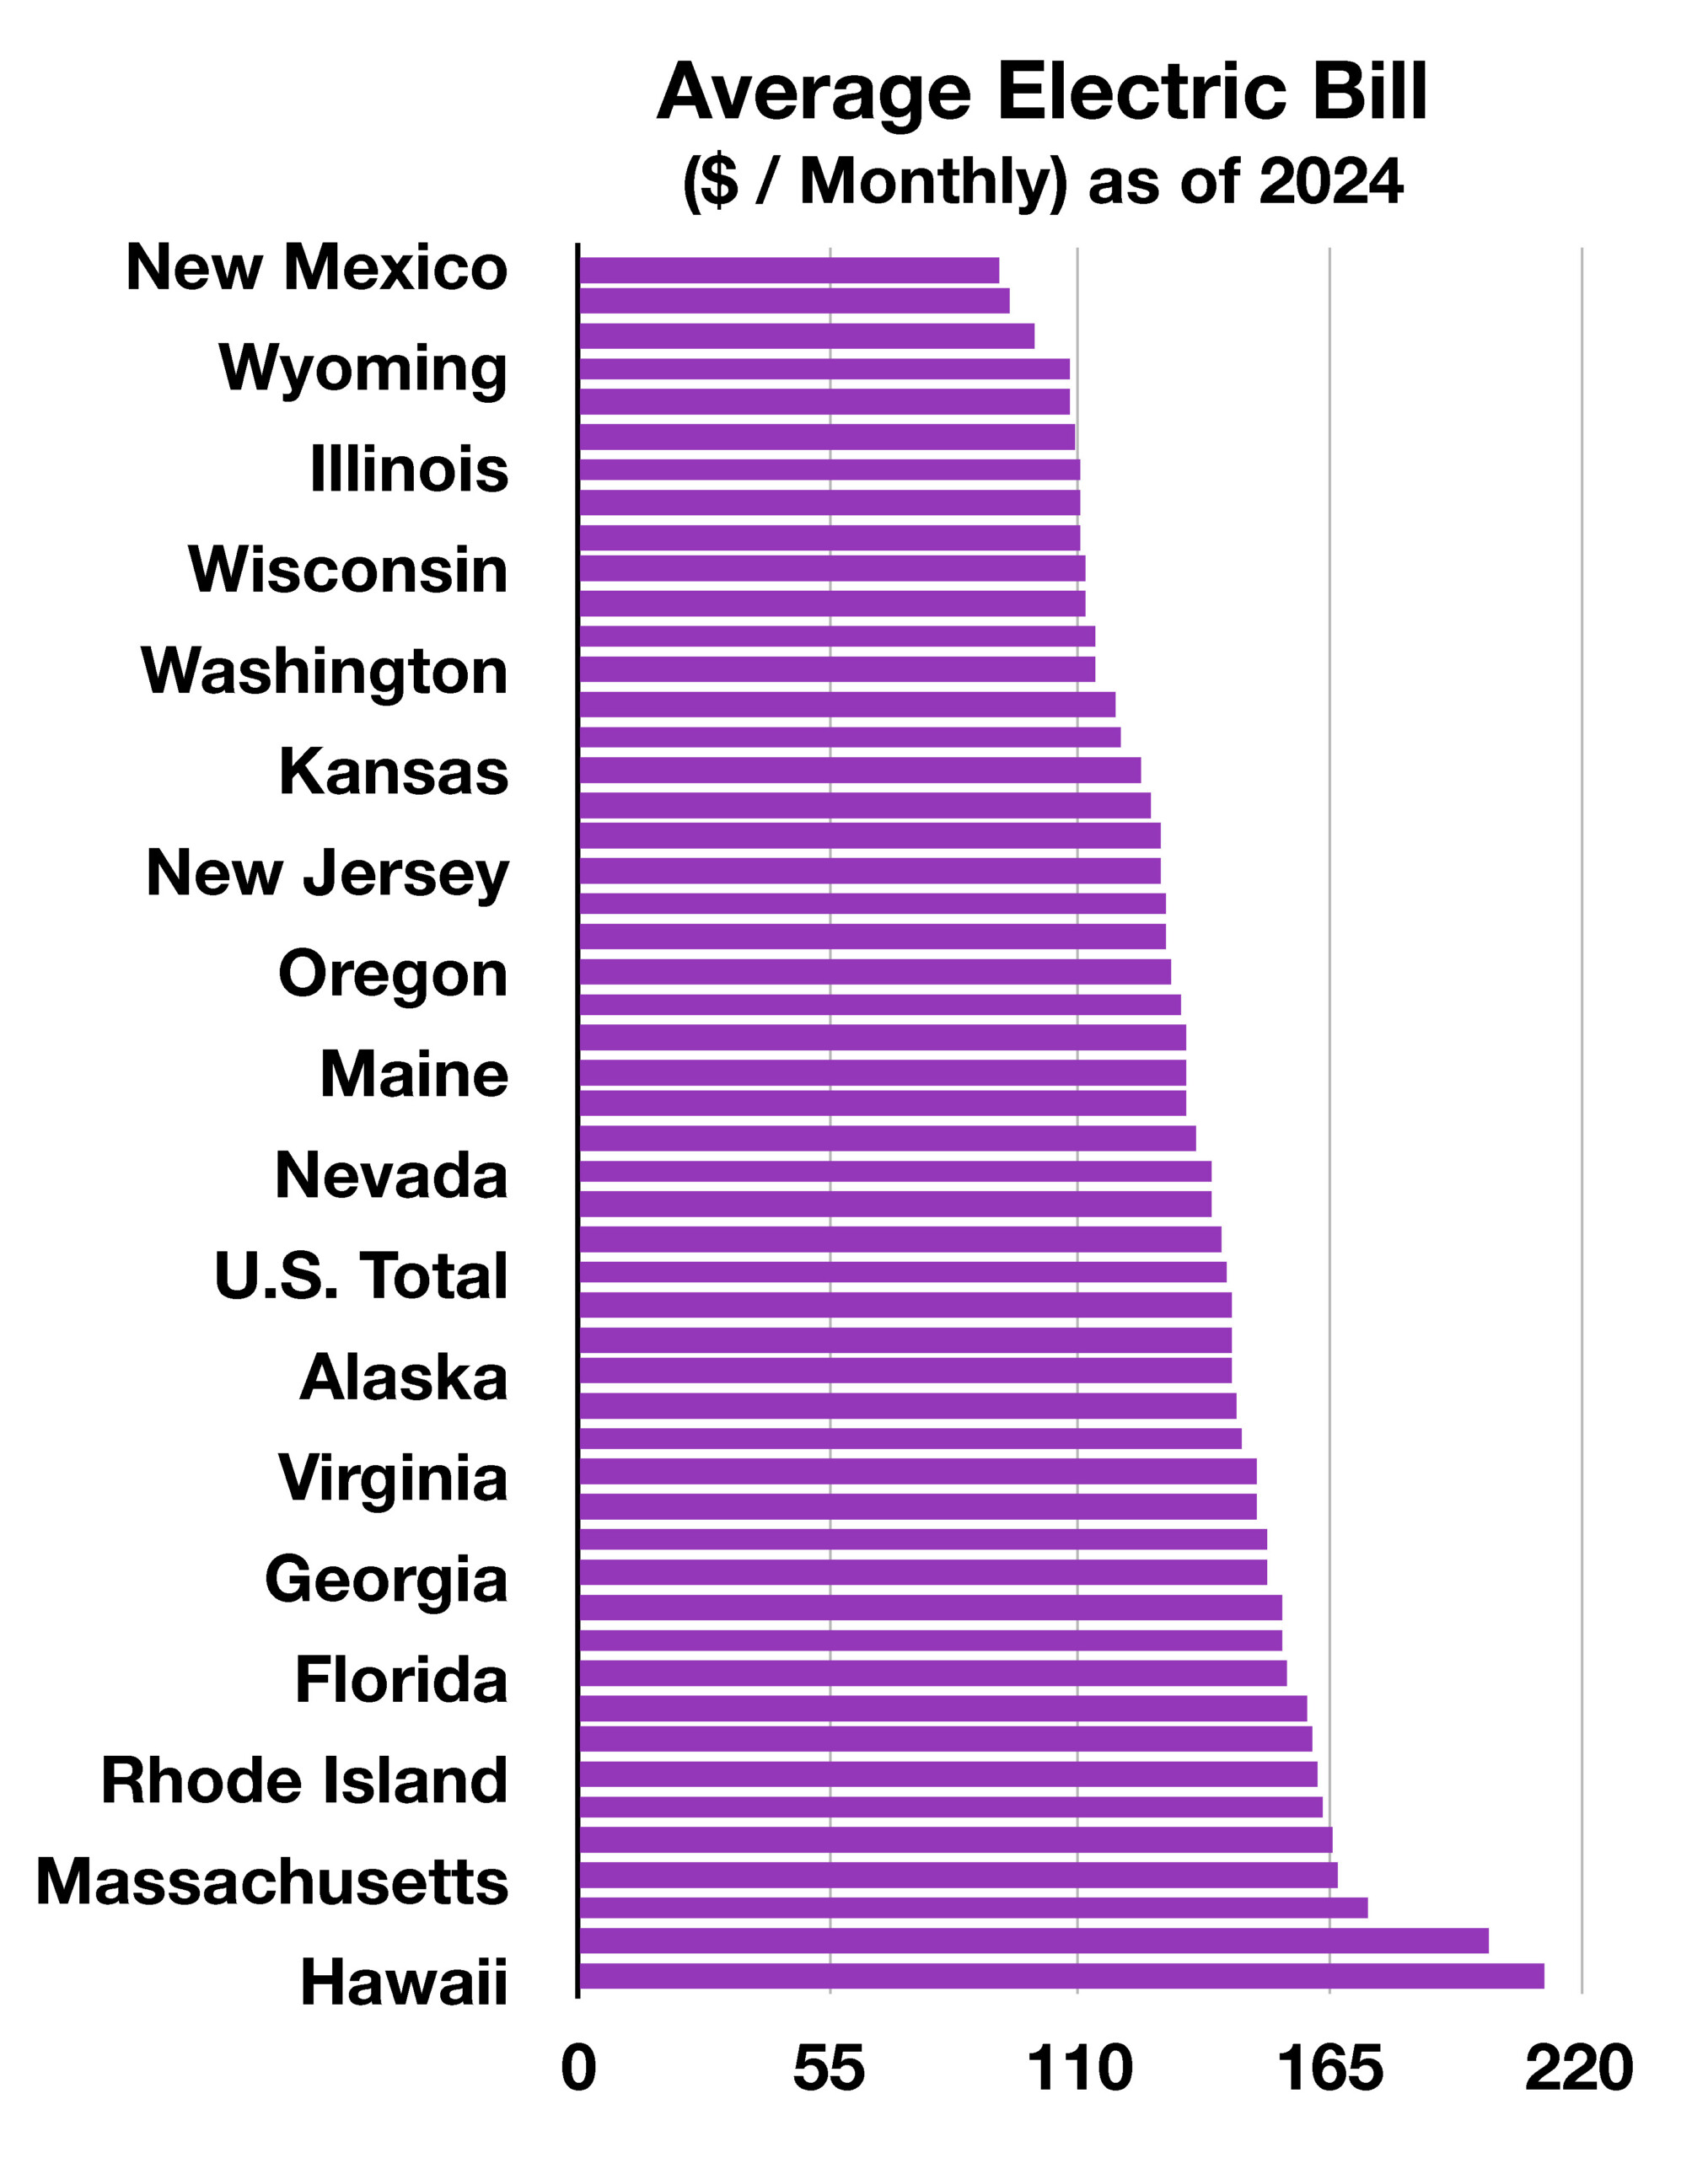
Each state has its own regulations and weather characteristics that directly affect the usage of electricity by consumers. Consumer electricity bills also vary by state depending on the cost of making and delivering power, which is distinctive everywhere. The most significant factors include local generation types, how much transmission and distribution infrastructure is needed, state regulations, and how much electricity households consume.
States that rely more on low-cost hydropower, nuclear, or natural gas often have lower bills than states that depend on imported fuels or expensive peak power rates. Long transmission lines, storm hardening, wildfire mitigation, and aging poles and wires are factors that raise delivery costs. Some states tightly regulate utilities, while others use competitive retail markets, ultimately changing how costs are passed through to customers. Rural or spread-out states have fewer customers sharing fixed grid costs, while dense urban areas can have more complex delivery systems. Weather is becoming more of a determinant in the costs of electricity, as hot climates, cold winters, or seasonal tourism can raise monthly usage, overall elevating bills.
Hawaii and Alaska tend to have especially high bills because they have limited grid connections and often depend on imported fuel. California’s bills are shaped by wildfire-related grid spending and liability costs, while northeastern states are often affected by natural gas constraints and winter demand spikes. (Sources: EIA, Dept. of Energy)
U.S. Debt Surpasses 100% of GDP – Fiscal Policy
The national debt reached 100.2% of Gross Domestic Product (GDP) at the end of March 2026, the largest amount since the end of World War II. Government debt held by the public stood at $31.27 trillion on March 31st, while GDP for the prior 12 months stood at $31.22 trillion on March 31st. Essentially, the U.S. government is spending $1.33 for every dollar it collects in revenue.
Various factors will continue to affect the amount of debt and projected revenue over the next few months, including the cost of the war with Iran, tariff reimbursements, and economic growth. Historically, previous increases in exports have contributed to reducing the country’s debt.
Economists track the debt-to-GDP ratio as an indication as to how much the country’s debt is weighing on the economy. Expanding debt consumes resources that could be used for other needs, such as education, defense, social programs and even lowering taxes.
The debt briefly exceeded 100% of GDP during the pandemic in 2020, which temporarily shrank GDP and prompted steep government borrowing in order to subsidize households via economic relief payments totaling over $800 billion.
Sources: U.S. Treasury, U.S. Government Accountability Office (GAO), Committee for a Responsible Federal Budget