Fortis Wealth Management

(888) 336-7847 (3FORTIS)

www.investfortis.com

November 2022
Market Update
(all values as of 04.30.2024)

Stock Indices:

Dow Jones 37,815
S&P 500 5,035
Nasdaq 15,657

Bond Sector Yields:

2 Yr Treasury 5.04%
10 Yr Treasury 4.69%
10 Yr Municipal 2.80%
High Yield 7.99%

YTD Market Returns:

Dow Jones 0.34%
S&P 500 5.57%
Nasdaq 4.31%
MSCI-EAFE 1.98%
MSCI-Europe 2.05%
MSCI-Pacific 1.82%
MSCI-Emg Mkt 2.17%
 
US Agg Bond 0.50%
US Corp Bond 0.56%
US Gov’t Bond 0.48%

Commodity Prices:

Gold 2,297
Silver 26.58
Oil (WTI) 81.13

Currencies:

Dollar / Euro 1.07
Dollar / Pound 1.25
Yen / Dollar 156.66
Canadian /Dollar 0.79
 

Macro Overview

The Federal Reserve continued on its steepest rate increase path since the early 1980s. Political pushback against the Fed built as criticism regarding the rate hikes became a focal issue. October saw a weaker U.S. dollar helping to propel stocks higher, as multi-national U.S. companies benefit due to overseas sales.

The U.S. Bureau of Economic Analysis released third-quarter results for real GDP, revealing a 2.6% annualized quarterly growth rate that followed two consecutive quarters of negative growth, which by many economists’ standards is the official definition of a recession. The recent growth numbers don’t necessarily mean that the economy shifted to growth mode, but rather that GDP is simply holding steady. With consumer spending accounting for nearly 70% of GDP, inflation is placing additional pressure on American consumers.

Recent comments by the Federal Reserve indicate that it may consider a more cautious pace of rate hikes as economic activity reacts to the rapid rise in interest rates. With uncertainty regarding the Fed’s interest rates increases and the growing expectation for them to pivot, the dollar has slightly fallen from all-time highs relative to the euro and pound.

The International Monetary Fund’s most recent World Economic Outlook projected that the global economy has become “gloomy and more uncertain” as a result of inflation, rising rates, and the war in Europe. Revised projections heading into 2023 show less economic growth for most countries, with Russia expecting negative growth. U.S. growth estimates show minimal economic expansion over the next year.


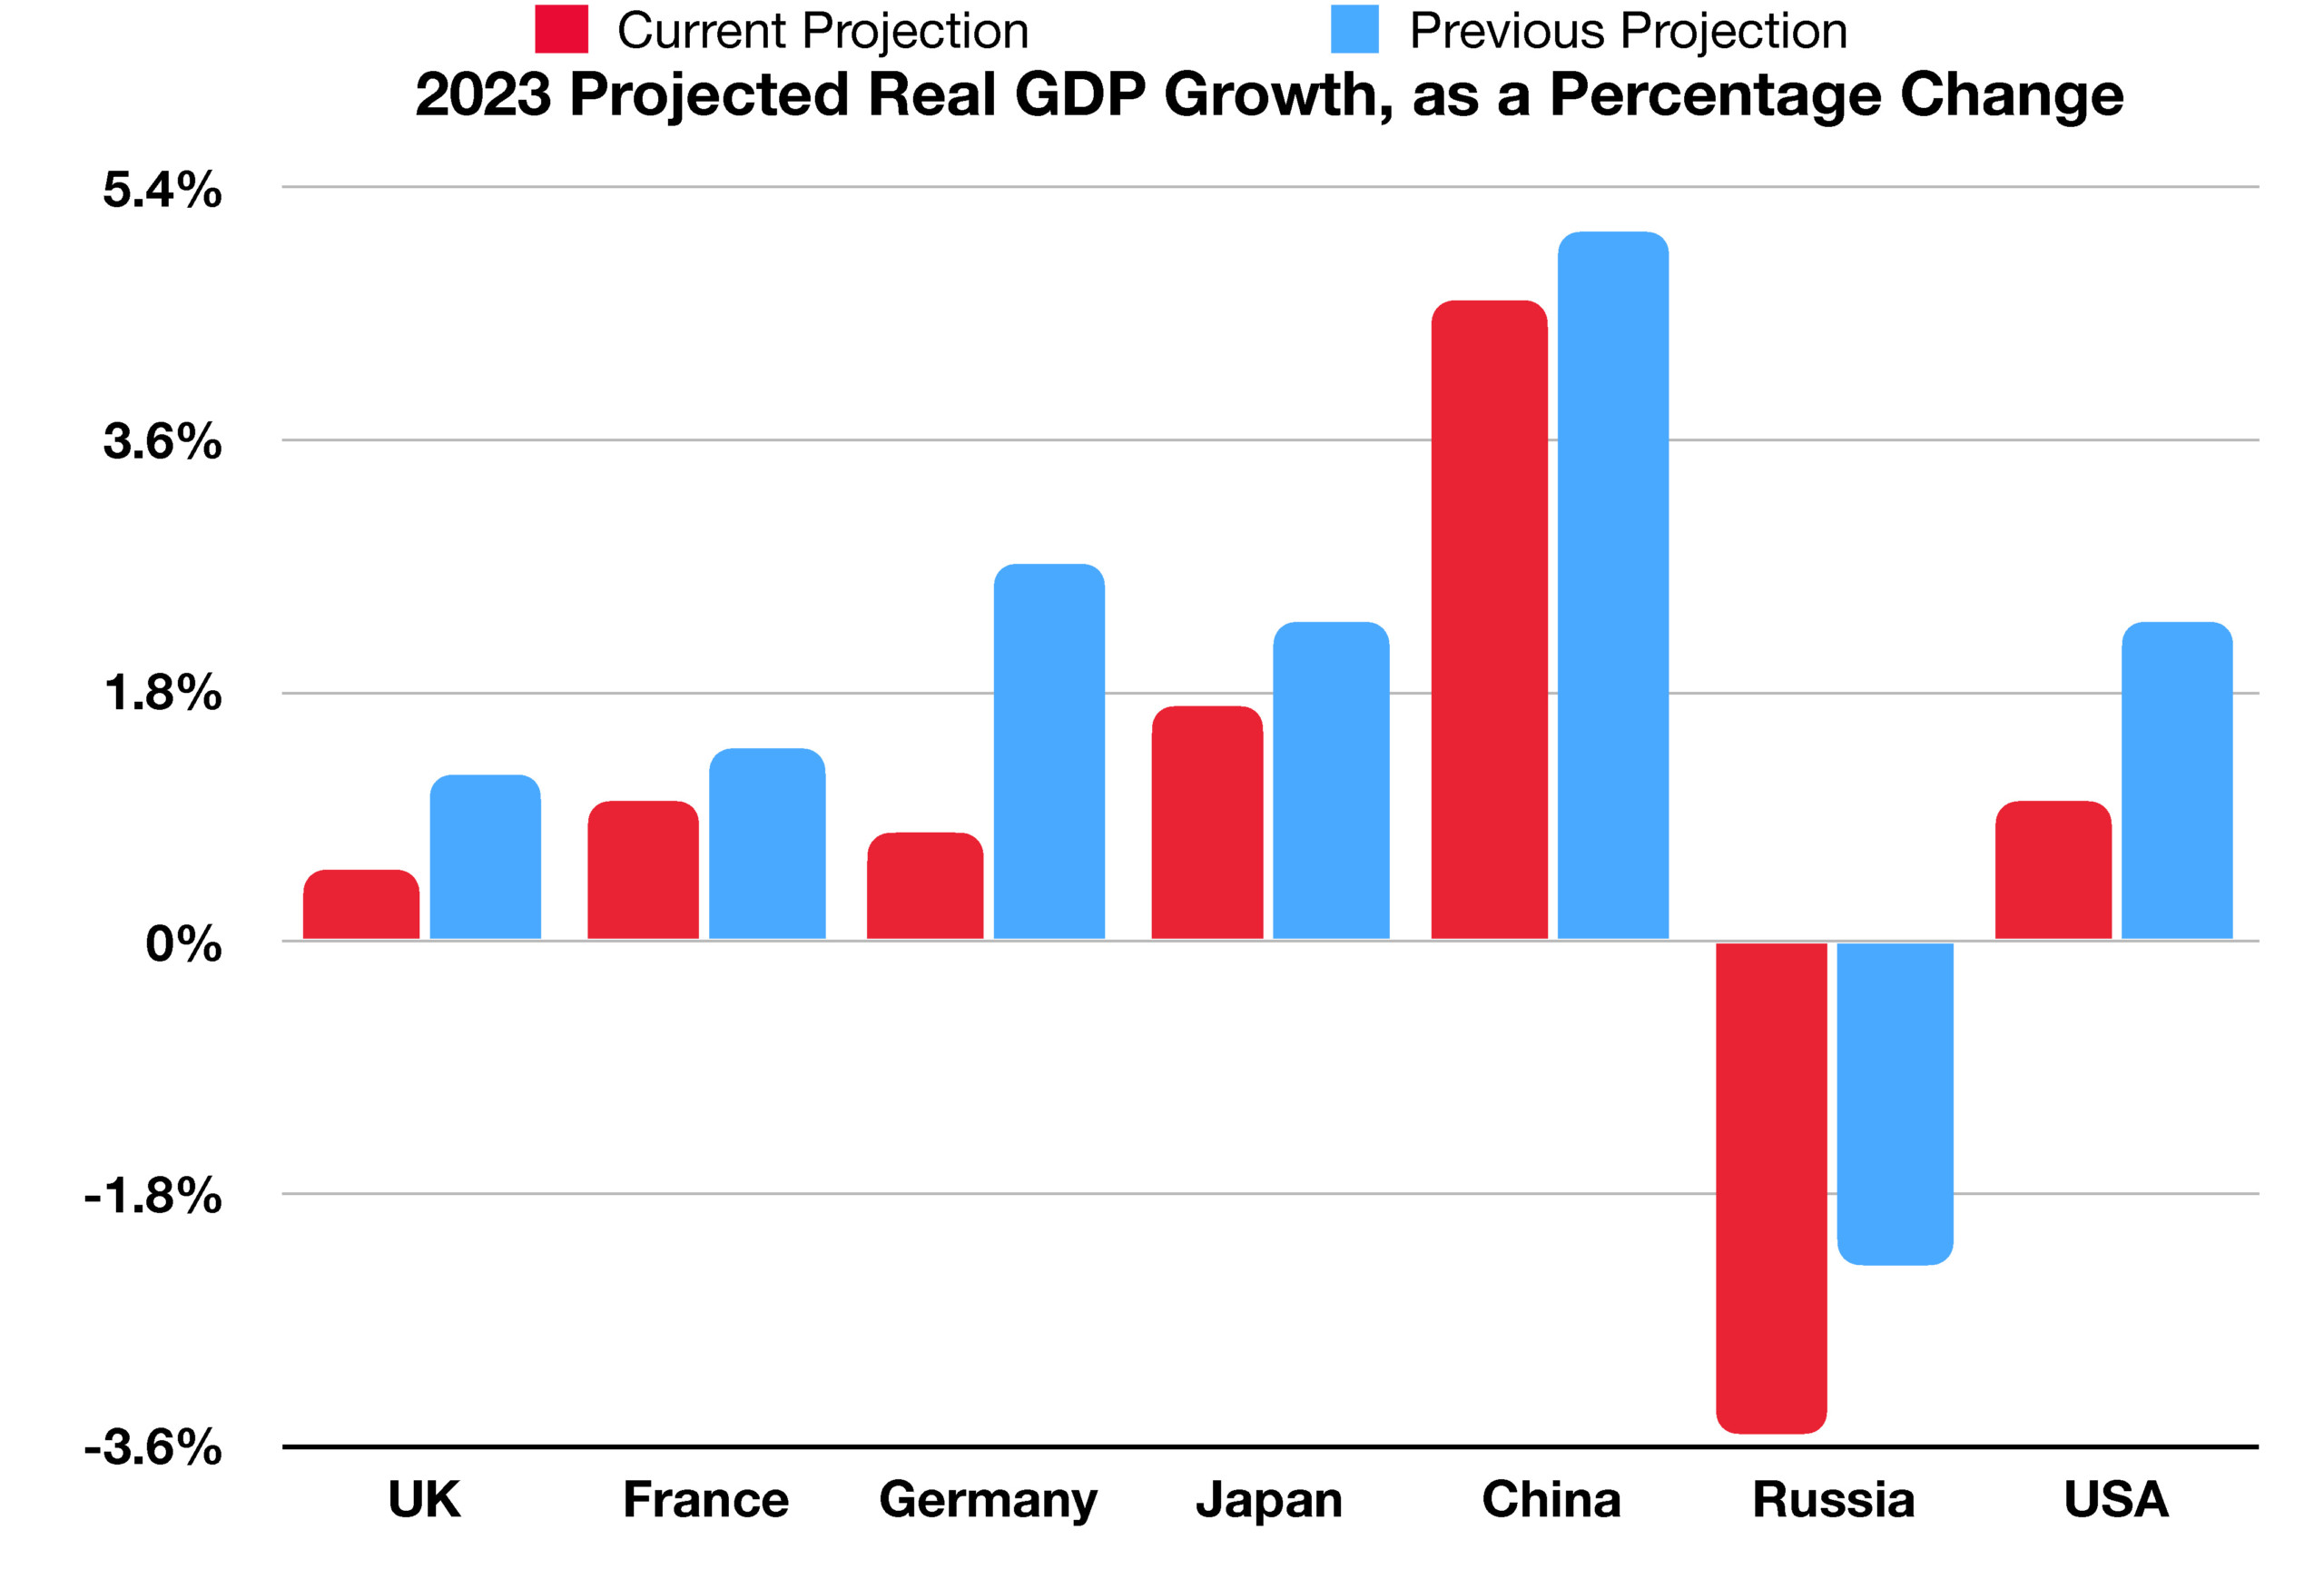
Sources: Federal Reserve, IMF World Economic Outlook Oct 2022, Treasury Dept., Bureau of Labor Statistics, Bloomberg


self-employed workforce down nearly 6.2% from its 2021 highs

Stocks Gain In October – Equity Overview

U.S. equity markets rebounded in October with the Dow Jones, S&P 500, and Nasdaq indices all posting positive gains for the month. Technology, health care, and financial stocks were the largest contributors to the monthly S&P 500 Index gains, although these sectors have encountered headwinds over the past couple of weeks.

A weaker U.S. dollar added to gains as equity earnings typically improve as a result of a weaker dollar. Overseas sales are more nominally profitable for U.S. companies when the U.S. dollar is weaker, due to the effect on relative exchange rates. (Sources: S&P, Dow Jones, Bloomberg)

Rates Hold Steady – Fixed Income Review

Short-term Treasury bonds continued to post higher yields than longer-term Treasury bonds. Six-month maturity bonds yielded 4.57% at the end of October, higher than 30-year maturity bonds at 4.22%. Analysts term this dynamic as an inverted yield curve, which is often indicative of a recessionary environment.

Mortgage and consumer loan rates held steady in October; these rates have recently put pressure on the housing and consumer markets. FreddieMac reported the average rate on a 30-year fixed mortgage above 7% at the end of October, a level not seen since 2002.(Sources: Freddie Mac, U.S. Treasury, Federal Reserve)

Self-Employed Workforce Falling From Largest In 13 Years – Employment Trends

During the Great Resignation in 2021, when uncommonly high numbers of employees quit their jobs, a key driver was confidence in the ability to work remotely and to be self-employed. This confidence led to historically high growth of the self-employed workforce as professionals left their employers.

Late 2021 was the first time the self-employed workforce expanded to consistently over 10 million people since 2008. Job quits per month reached a historically high level during the Great Resignation, jumping from 2,000,000 people in April 2020 to over 4,500,000 people choosing to leave their jobs each month in November 2021. Over 47.8 million people quit their jobs in 2021 alone, as the pandemic ushered in an era of remote work.

An increasingly popular form of work, remote work disrupted the standard 5-day, in-office work week. However, the recent decline in confidence in the economy and historical inflation are creating barriers for the self-employed workforce. Self-employment fell from its highs as many workers became concerned about the economy due to recessionary pressures. In August of this year, the self-employed workforce fell to an 18-month low, down nearly 6.2% from its 2021 highs.

Sources: Bloomberg, U.S. Bureau of Labor Statistics, Federal Reserve Bank of St. Louis

 
M2 had the largest single-year jump since 1943.

Housing Affordability / Series 2 of 2: Home Prices Fall for the First Time in 10 Years – Housing Update

After the housing market cratered in the 2008 Great Recession, home prices proceeded to skyrocket in price. The average home price in the U.S. is currently over $525,000, an increase of $325,000 since 2000 and about $265,000 more expensive than in 2009. In a state like California, where real estate prices are much higher, the average home price is around $925,000, a $665,000 increase since 2000.

According to new research, a home purchase costs more than 8 years of average purchaser income, up from an average of 5 years of income over the past 54 years. However, real wages are declining due to inflation, and the median U.S. personal income is $44,225. For someone making this income, the average U.S. home is worth almost 12 years of work.

Recent data from an index that tracks home prices across 20 major cities just showed its first contraction since March of 2012. This means that home prices have fallen, ending a decade-long surge by recording a -0.44% index price movement from June to July of 2022. The index is down 2.8% from its February high. Real estate prices remain historically high for now, but rising mortgage rates weigh on housing prices and may lead to further price contraction. (Sources: U.S Census Bureau, U.S. Federal Housing Finance Agency, S&P Dow Jones Indices, Rosenberg Research, World Population Review, Federal Reserve Bank of St. Louis)

A Hidden Reason for Inflation – Monetary Policy

The Fed increased interest rates by 3% over the course of 3 months, the largest increase since 1982, in an attempt to combat the highest inflation in over 40 years. The root of this inflation, in the opinion of many economists, is the historic growth of money supply over the pandemic and global turmoil. A barometer of inflation, the M2 money supply, which includes cash, checking deposits, and money market funds, expanded significantly since the pandemic began in 2020 with an increase of 26% in 2020-2021, the largest single-year jump in the money supply since 1943.

Money supply and inflation are often highly correlated, with large increases in the money supply tending to result in heightened inflation. With the U.S. money supply’s recent spike, inflation has begun to rise, reaching 9% in June of this year. 
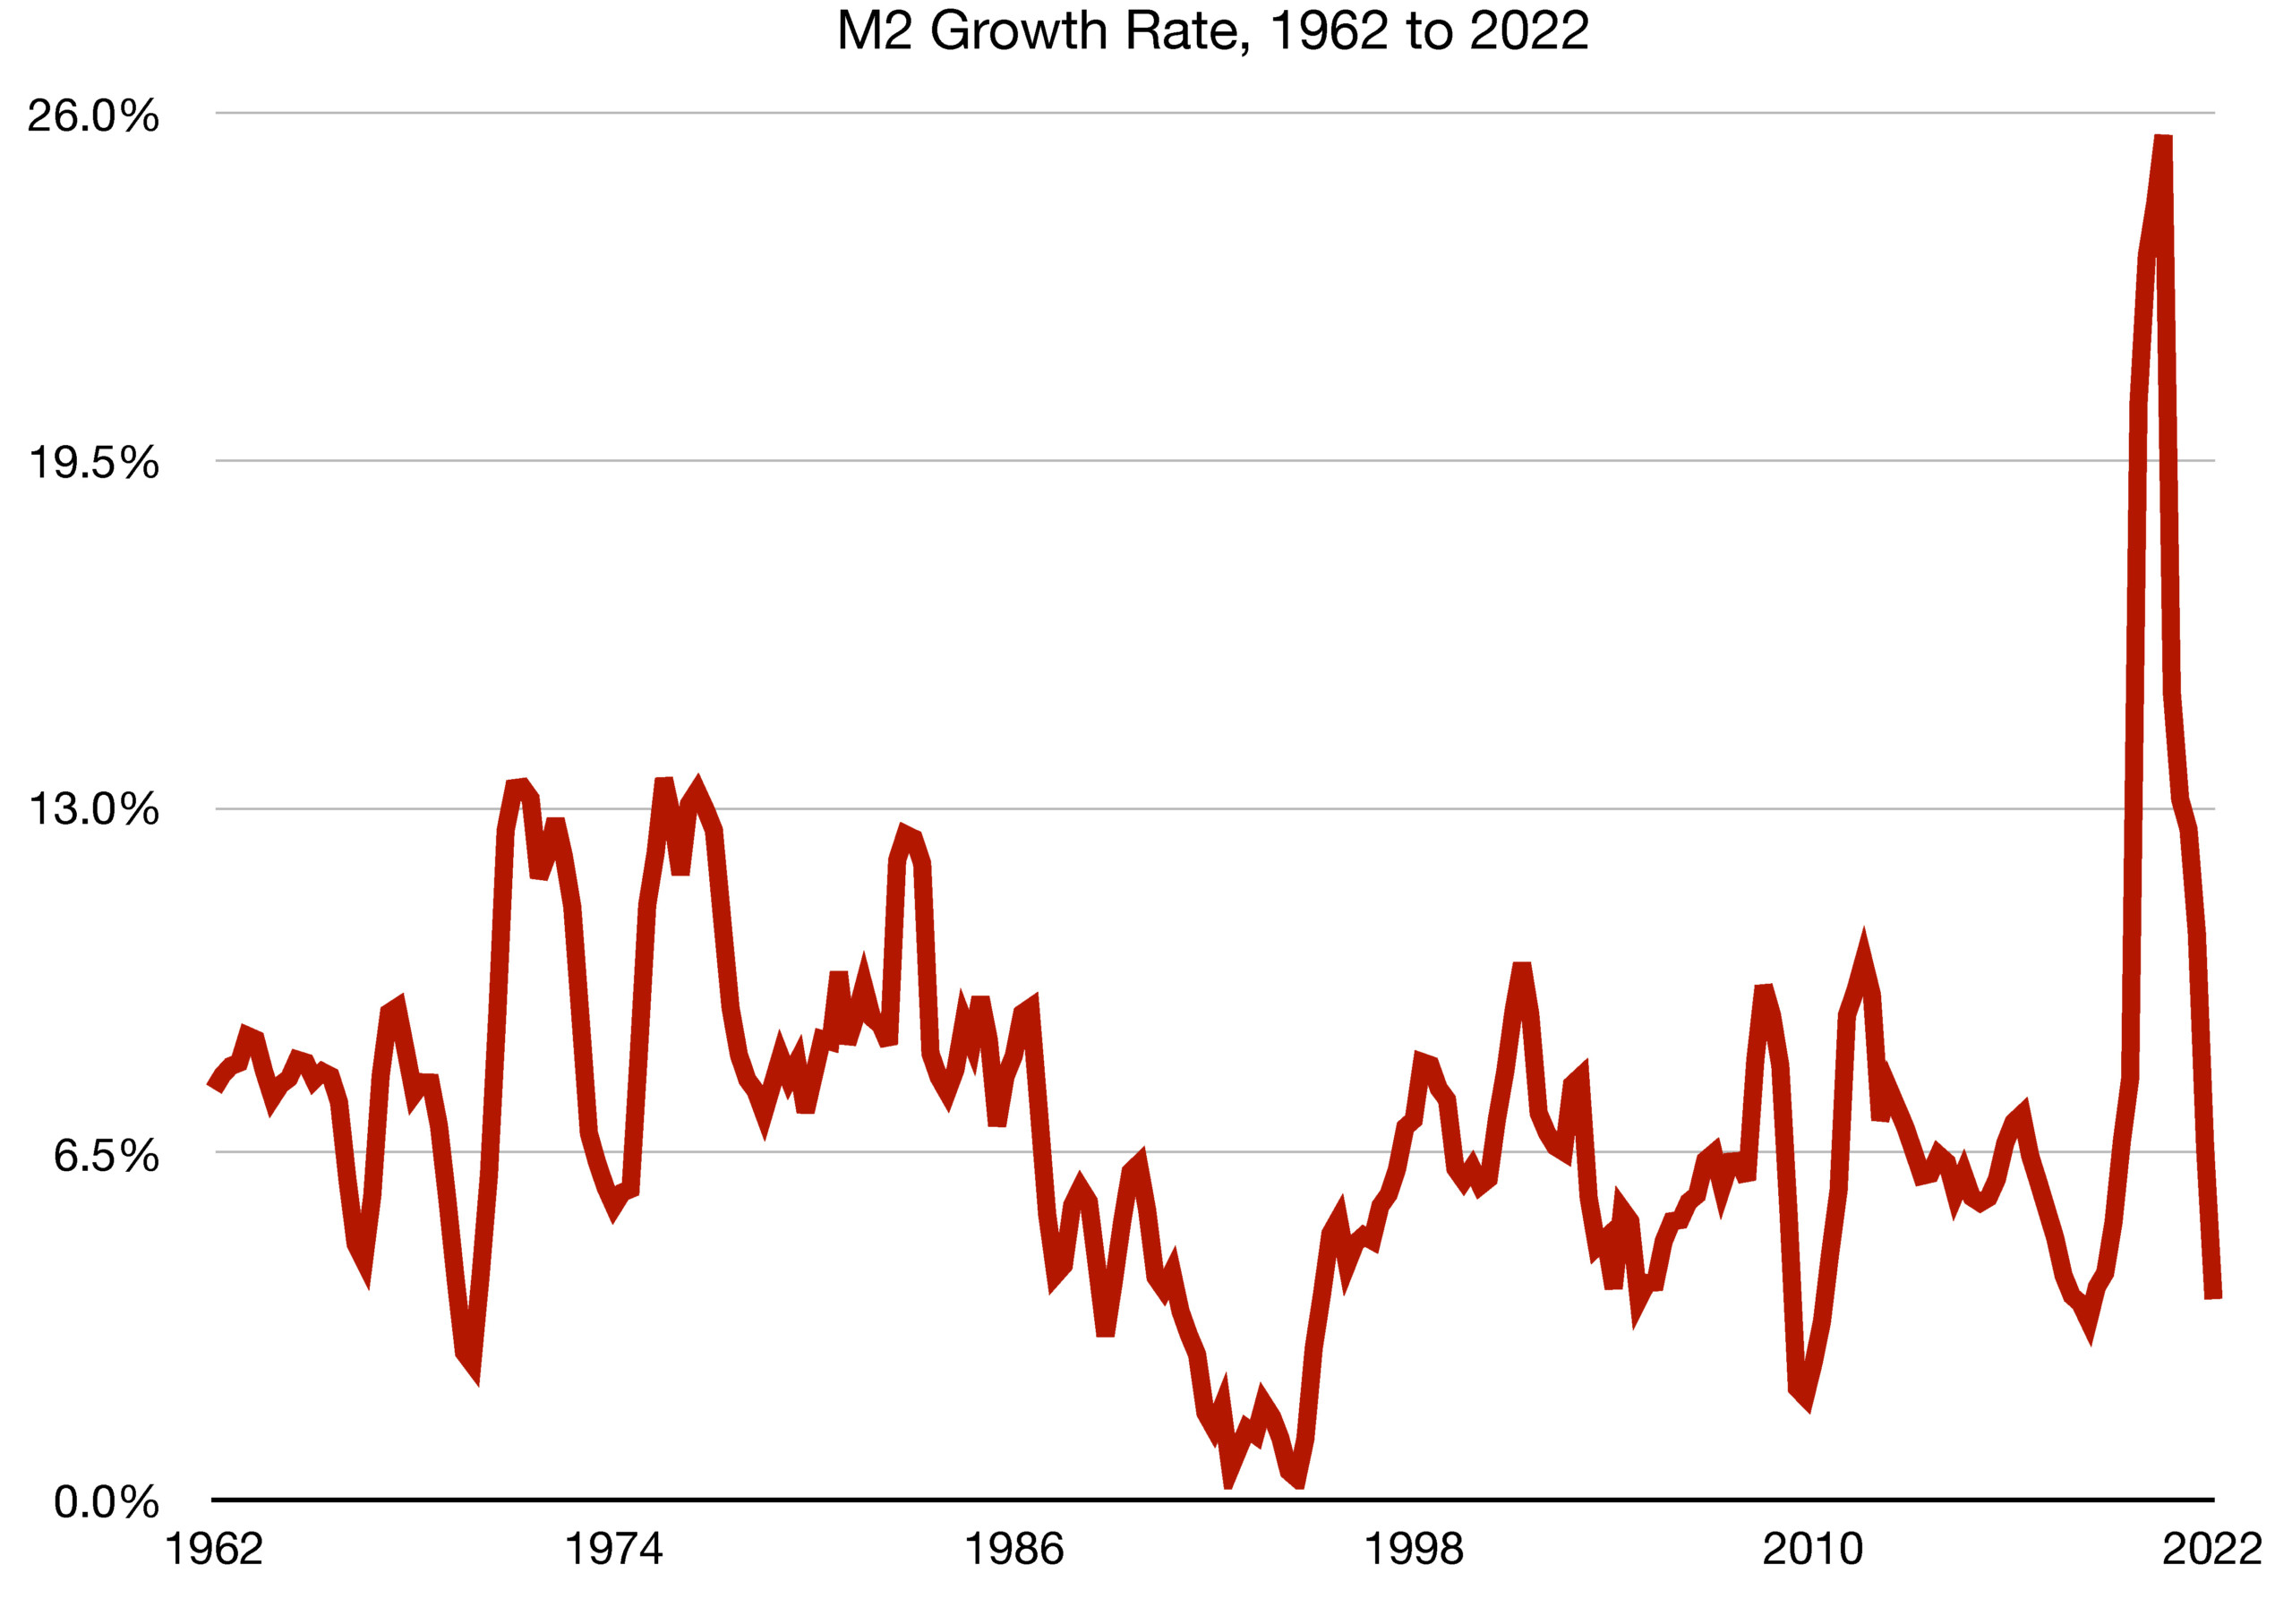
To combat this inflationary pressure, the Fed constrained M2 growth, with the inflation rate surpassing M2 growth in the second quarter of 2022 when inflation reached upwards of 9%. This constraint on M2 contributed to the emergence of a recessionary environment, as evidenced by two consecutive quarters of negative GDP growth. Yet inflation remains at 40-year highs, having measured in at 8.2% recently, just a 0.8% fall from this year’s highs. The Fed signaled it is willing to continue raising short-term interest rates to bring inflation under control, but such increases may be tempered in the future by the Fed’s motivation to avoid an extensive recession. (Sources: BLS, Federal Reserve Bank of St. Louis)

 
each tax bracket for the marginal tax rate will go up 7%

IRS Raises 2023 Tax Brackets Due To Inflation – Tax Planning

The Internal Revenue Service (IRS) controls the periodic adjustments of tax brackets and standard deductions, and annually makes tax code adjustments based on cost-of-living factors, congressional demands, and inflation. The adjustment for 2023, due to 40-year highs in inflation (with inflation currently sitting at 8.2%), was abnormally high.

Thresholds for each tax bracket for the marginal tax rate will go up 7%, and the standard deduction will rise accordingly. Marginal tax rates will remain the same but will apply to incomes 7% higher rather than in 2022. For example, the top marginal tax rate of 37% previously applied for individual income above $539,900, and in 2023 will apply to income above $578,125. These income threshold increases apply to all income tax brackets, with each bracket threshold rising by 7%. The reasoning behind this is to recognize the effects of high inflation on tax-payer cash flows.

Notably, current tax rates are lower than historical averages. The top income tax rate, currently at 37%, is 20 percentage points lower than the average top income tax since its introduction in 1913. The top income bracket tax rate reached as high as 94% in the 1940s and its 100-year average is about 57%.

The standard deduction, which now stands at $27,700 for married couples and $13,850 for individuals, will increase 7% next year, allowing taxpayers to shield more of their income from taxes. The annual gift tax exclusion, which is the amount an individual can give as a gift to another individual without affecting the untaxed lifetime limit, will increase by $1,000 to reach $17,000 in 2023.

These changes all apply for 2023, so taxpayers will see them when filing taxes in early 2024.

Sources: Internal Revenue Service, Wall Street Journal, Tax Policy Center, U.S. Department of the Treasury, Federal Reserve Bank of St. Louis