Ocean Park Capital Management
2503 Main Street
Santa Monica, CA 90405
Main: 310.392.7300
Daily Performance Line: 310.281.8577
Stock Indices:
| Dow Jones | 37,815 |
| S&P 500 | 5,035 |
| Nasdaq | 15,657 |
Bond Sector Yields:
| 2 Yr Treasury | 5.04% |
| 10 Yr Treasury | 4.69% |
| 10 Yr Municipal | 2.80% |
| High Yield | 7.99% |
YTD Market Returns:
| Dow Jones | 0.34% |
| S&P 500 | 5.57% |
| Nasdaq | 4.31% |
| MSCI-EAFE | 1.98% |
| MSCI-Europe | 2.05% |
| MSCI-Pacific | 1.82% |
| MSCI-Emg Mkt | 2.17% |
| US Agg Bond | 0.50% |
| US Corp Bond | 0.56% |
| US Gov’t Bond | 0.48% |
Commodity Prices:
| Gold | 2,297 |
| Silver | 26.58 |
| Oil (WTI) | 81.13 |
Currencies:
| Dollar / Euro | 1.07 |
| Dollar / Pound | 1.25 |
| Yen / Dollar | 156.66 |
| Canadian /Dollar | 0.79 |
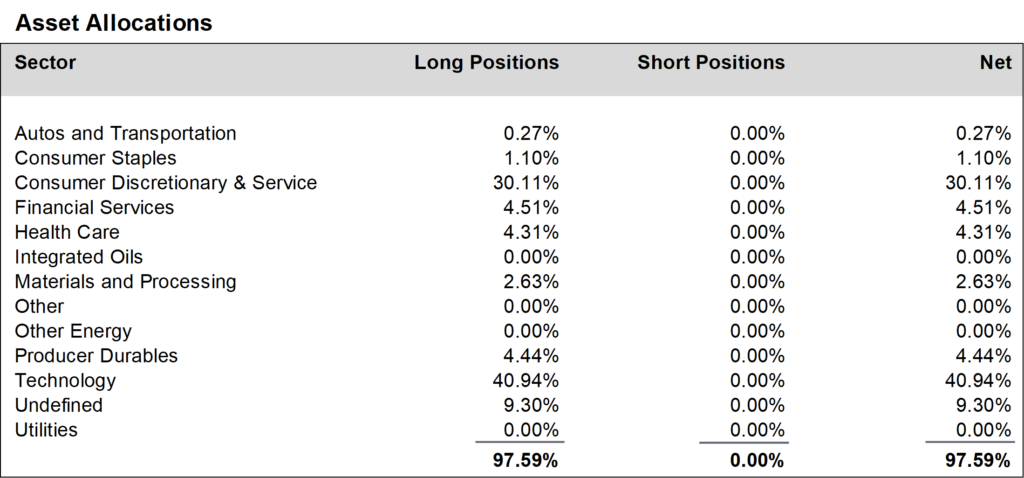
Portfolio Overview
Ocean Park Investors Fund fell 2.94%* in October, while the S&P 500 fell 2.20% and the NASDAQ Composite fell 2.78%. While technology stocks were generally weak, there were some bright spots in the portfolio as Microsoft gained 7% and Crowdstrike gained 5%.
During the month, we reduced positions in the producer durables sector and increased exposure to the QQQ ETF. In anticipation of disappointing earnings, we sold Match Group, OSO Systems, and Unity Software. We initiated new positions in companies with brighter prospects including Zscaler, Gap, and Shift4 Payments. We finished the month at about 97% net long, unchanged from September.

Daily updates on our activity are available on our Results Line, at 310-281-8577, and current information is also maintained on our website at www.oceanparkcapital.com. To gain access to the site enter password opcap.
*These results are pro forma. Actual results for most investors will vary. See additional disclosures on page 4. Past performance does not guarantee future results.


