KCG Investment Advisory Services

Kimberly Good

315 Commercial Drive, Suite C1

Savannah, GA 31416

912.224.3069

www.kcginvestmentadvisory.com

Market Update
(all values as of 03.29.2024)

Stock Indices:

Dow Jones 39,807
S&P 500 5,254
Nasdaq 16,379

Bond Sector Yields:

2 Yr Treasury 4.59%
10 Yr Treasury 4.20%
10 Yr Municipal 2.52%
High Yield 7.44%

YTD Market Returns:

Dow Jones 5.62%
S&P 500 10.16%
Nasdaq 9.11%
MSCI-EAFE 5.06%
MSCI-Europe 4.60%
MSCI-Pacific 5.82%
MSCI-Emg Mkt 1.90%
 
US Agg Bond -0.78%
US Corp Bond -0.40%
US Gov’t Bond -0.72%

Commodity Prices:

Gold 2,254
Silver 25.10
Oil (WTI) 83.12

Currencies:

Dollar / Euro 1.08
Dollar / Pound 1.26
Yen / Dollar 151.35
Canadian /Dollar 0.73

Macro Overview

A federal government shutdown was averted on September 30th, when Congress voted to fund government operations until mid-November. Volatility in the financial markets increased during September, as uncertainty surrounding a resolution persisted. The possibility of a shutdown will evolve again in November, as Congress once again deliberates on the passage of the federal budget. Should a shutdown occur, the impact on the economy would initially be mild as previous shutdowns, and possibly expanding as millions of government workers go without salary. Private sector contractors would also be impacted with delayed payments, while consumer uncertainty hinders spending.

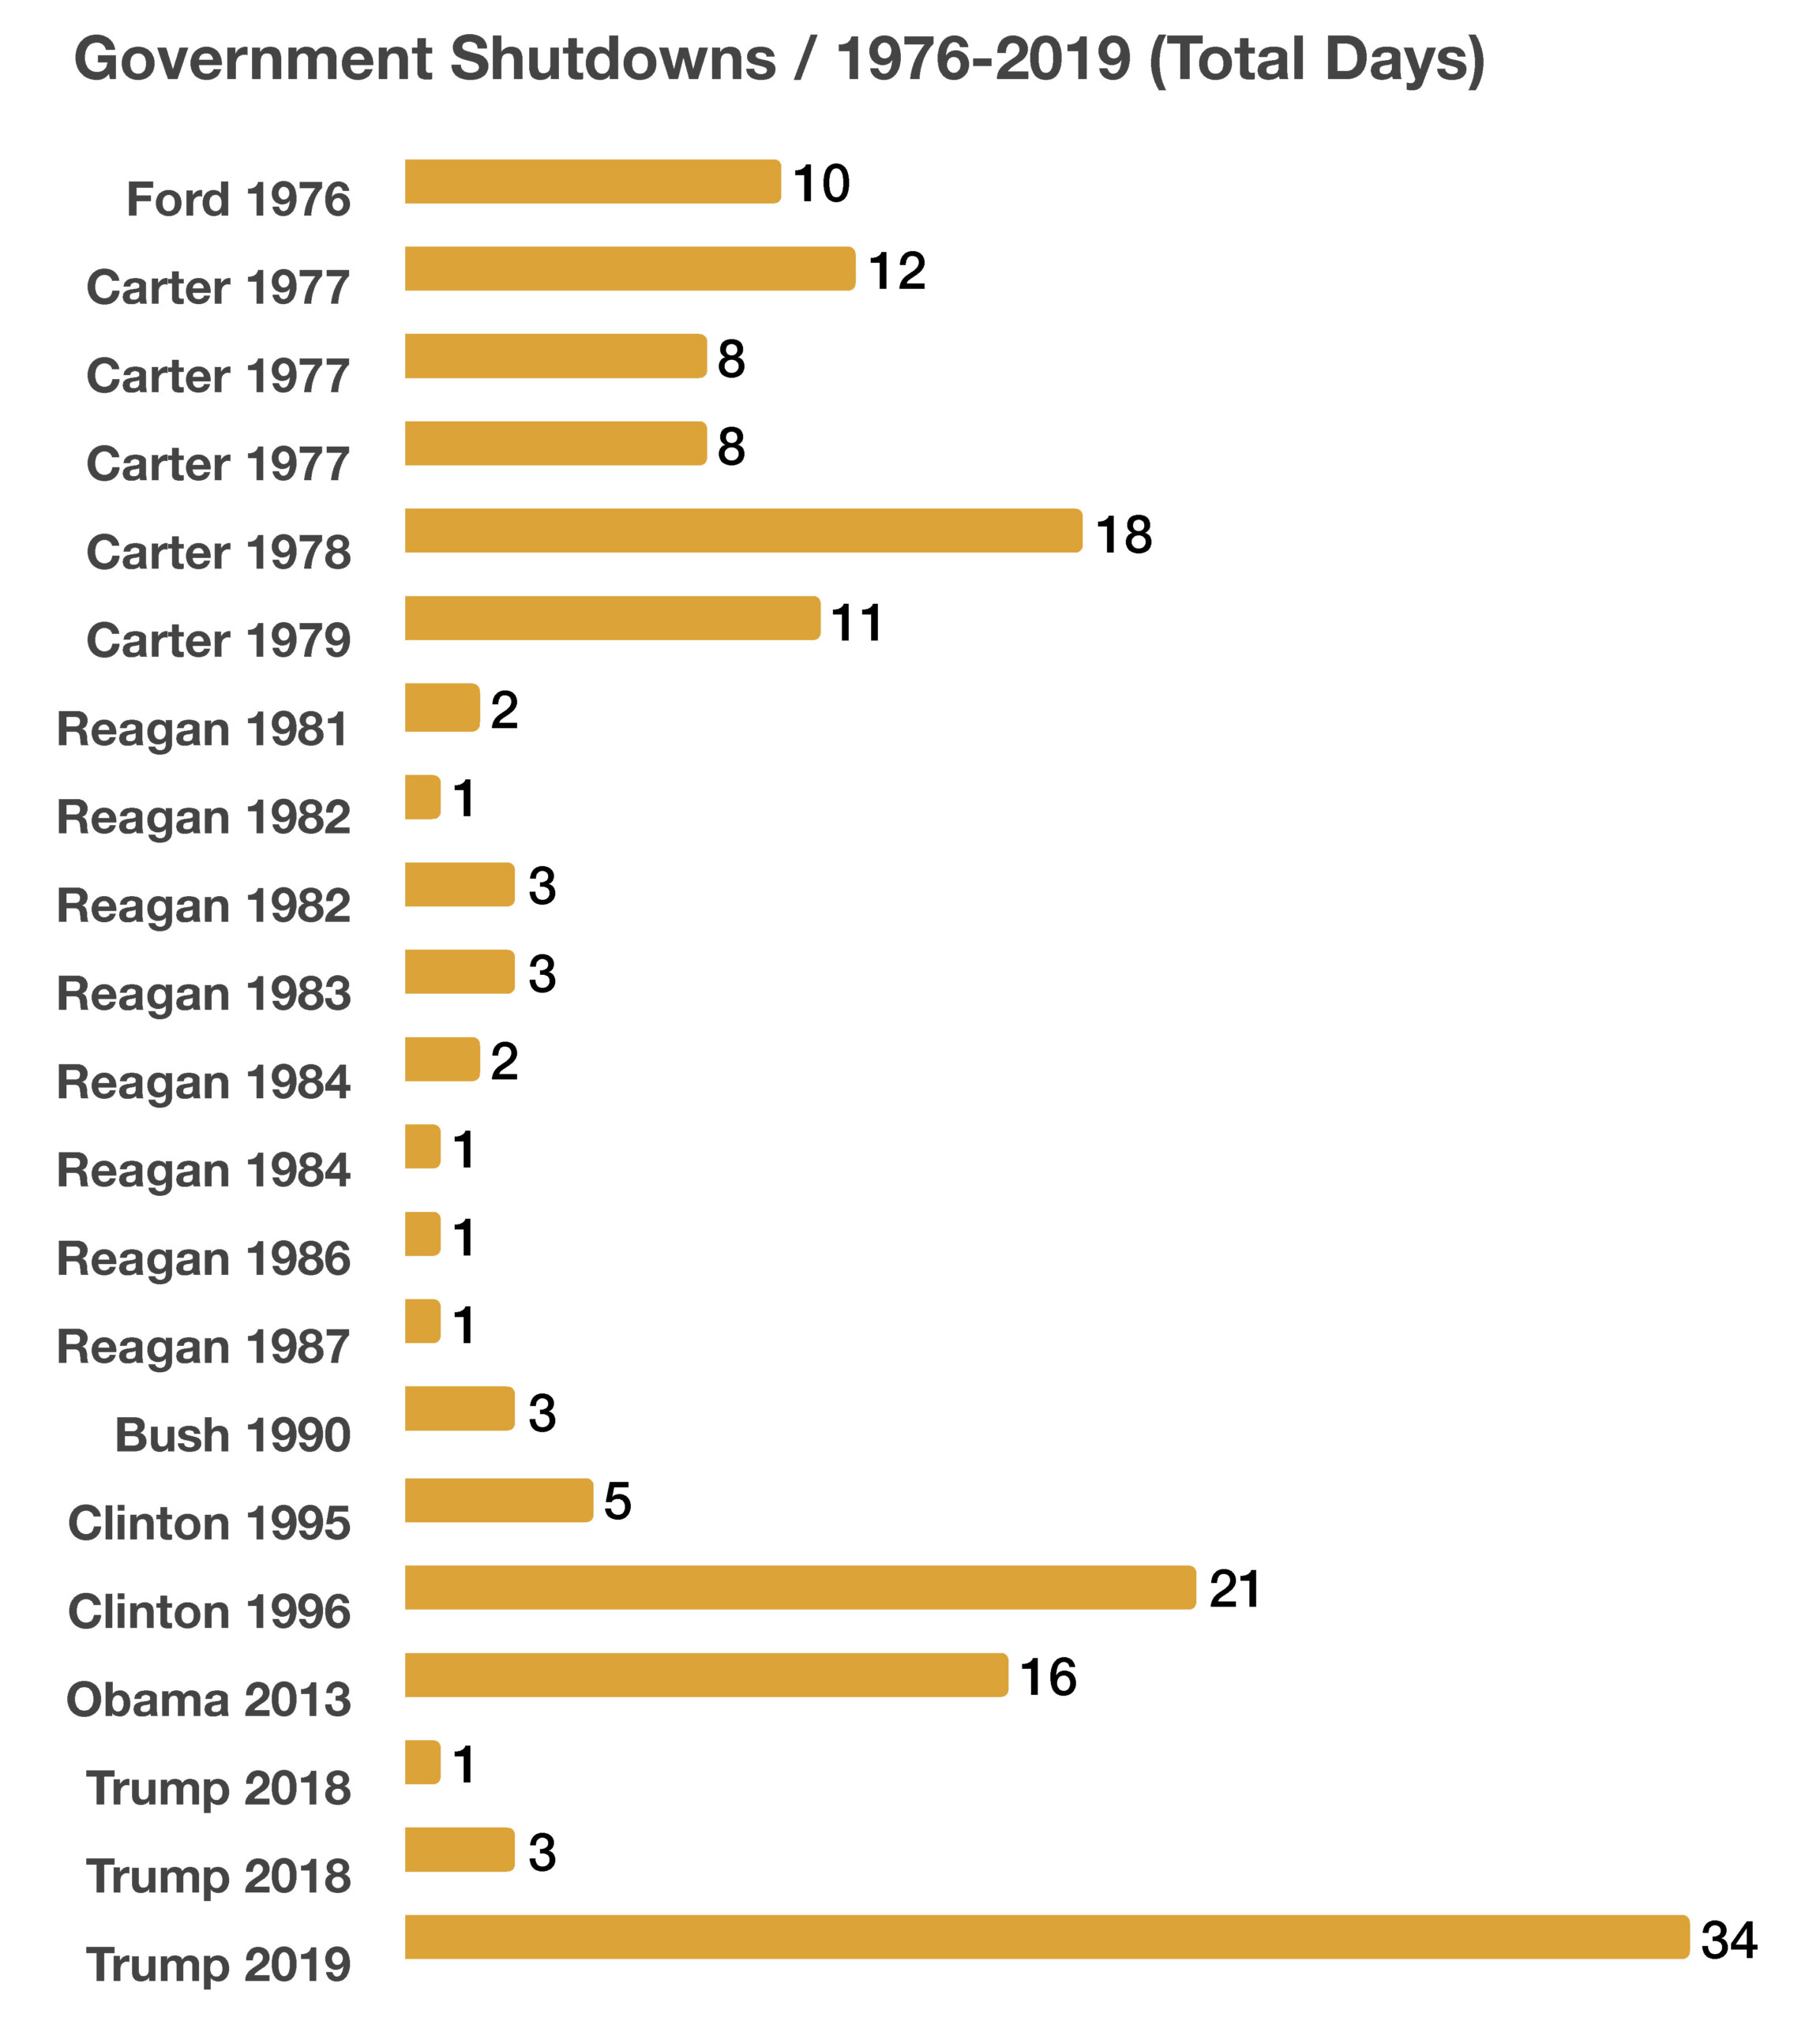
The federal government shutdown dilemma has increased the possibility of a credit downgrade by Moody’s, the last agency with a AAA rating on government debt. Credit agencies S&P and Fitch have already lowered their ratings on U.S. government debt to AA+, down from the top tier rating of AAA. Another downgrade is expected to make it more costly for the government to borrow funds and maintain already excessive debt levels. The last downgrade was on August 1st when Fitch lowered its rating to AA+ from AAA.

A shutdown of the federal government is expected to affect only government operations and payments that are not funded by permanent appropriations. Those funded by permanent appropriations such as the Postal Service, entitlement programs such as Social Security and Medicare, will not be affected. Other essential and critical departments and agencies of the government would also continue operations, such as the Defense Department and the Treasury Department. Scheduled debt payments such as on Treasury bills, notes and bonds would also continue to be made.

Relentless rising oil prices are hindering portions of the economy, inflicting rising costs on transportation, manufacturing, and food distribution. Equity analysts believe that some companies may see compressed earnings as lofty fuel costs continue to wear on operating expenses. Higher costs can eventually be passed on to consumers in the form of higher prices.

Medicare open enrollment is from October 15th to December 7th, allowing changes for existing medicare recipients and enrollments for new members. Any changes and new enrollments are effective January 1, 2024. The Centers for Medicare & Medicaid Services (CMS) reports that there are currently over  65.7 million people enrolled in Medicare. (Sources: Social Security Administration, Medicare.gov, Treasury Dept., Federal Reserve)


Equities React To Congressional Uncertainty – Global Equity Overview

Domestic equities were off in September and in the third quarter, as stocks retracted further with shutdown concerns increasing towards the end of the quarter. Rising interest rates and the labor union strikes also contributed to market anxiety, as uncertainty drove volatility higher throughout the month.

The energy and communication services sector were the only positive sectors for the third quarter. Elevated fuel prices along with improving technology earnings supported the rise in the sectors. Pessimism amid renewed inflation concerns hindered equity momentum during the quarter.

Developed and emerging market equities also pulled back in September and the quarter as uncertainty surrounding the U.S. dollar and elevated fuel prices drove valuations lower.  (Sources: S&P, Dow Jones, Nasdaq, MSCI, Bloomberg)

Yields On The Rise – Fixed Income Overview

Looming government shutdown threats hindered the bond markets as concerns surrounding heightened funding costs for the government came into focus. Yields on U.S. Treasury bills, notes, and bonds rose in September as confidence regarding reaching a compromise diminished. Analysts expect the rise in government debt yields to be short-term unless another impasse materializes in mid-November as Congress deliberates the federal budget again. The yield on the 10 year Treasury bond surpassed 4.5% at the end of September, luring investors as equity volatility continued to dampen performance. (Sources: Treasury Dept., Congress.gov)

Consumption Decreases As Environment Changes – Economic Dynamics

Over 65% of the country’s economic growth, as measured by Gross Domestic Production (GDP) is driven by consumers. Sentiment and confidence are critical components to consumer spending behavior, influencing spending patterns and habits. Recently released data from the Bureau of Economic Analysis reveals that consumers are spending less than they have been.

Factors affecting consumer spending include income, sentiment, job status, and confidence. Once consumers realize a change in their status, they’ll modify spending to accommodate what they need.

As retail stores and restaurants began to reopen in 2021, consumers were ready to spend funds that had been sitting idle for nearly a year. Consumer consumption fell dramatically in April 2020, as stay-at-home mandates and retail closures were in effect, only to elevate to new highs in April 2021 as consumers were able to spend freely again. The most recent data trends validate that consumers are spending less and perhaps with greater caution as economic uncertainty takes hold. (Sources: Labor Dept.,BEA)


Medicare Coverage Heading Into 2024 – Retirement Planning

With open enrollment upon us, millions of Americans will be deciding on which, if any, changes to make to their Medicare coverage. The Open Enrollment Period for 2024 coverage is from October 15, 2023 to December 7, 2023. Coverage for any changes or new plans begins January 1, 2024.

Since Medicare doesn’t cover all medical expenses, the decision to buy supplemental insurance coverage or to obtain a Medicare Advantage Plan is important for millions of Medicare recipients. Medicare Advantage Plans allow a recipient to get both Medicare Part A and Part B coverage. Medicare Advantage Plans are sometimes called Part C or MA Plans, and are offered by Medicare-approved private companies. Medicare Supplemental Insurance or Medigap helps pay for gaps in coverage not paid for by Medicare. Even though Medicare does pay for many procedures and services, some remaining expenses such as copayments, coinsurance, and deductibles are covered by supplemental plans. Some Medigap policies also cover services that are not covered at all by Medicare, such as coverage while traveling abroad. So it’s worth shopping and determining what expenses are covered by the various supplemental insurance policies. (Source: medicare.gov)

Consumers Are Saving Less – Consumer Behavior

According to the Bureau of Economic Analysis, data has revealed that Americans are saving less than initially thought. From 2017 through 2022, American consumers were thought to have saved an average of 9.4% of their disposable income. However, revised data figures have identified that the actual savings rate was 8.3%. Various possible explanations as to why such a drop may have occurred include higher fuel prices, recently implemented student loan repayments, lower real wages, and exhaustion of pandemic relief funds.
 
Economists view decreased savings as a signal that consumers may be shifting expenditure patterns thus altering where their funds are being spent. Inflationary pressures over the past two years have already redirected some consumer funds from non-essential goods and services to more essential items such as food and gasoline. Spending habits adjusted during the pandemic, as government stimulus funds padded consumer savings for millions. The National Bureau of Economic Research found that roughly 30% of stimulus checks went to consumer savings, while another 30% went to pay off debt. Personal savings reached a historical high in the midst of the pandemic, as retail stores and restaurants were shuttered and stimulus checks went unspent. The savings rate reached 32% of disposable income in April 2020, yet has fallen to 3.9% as of this past August. (Sources: National Bureau of Economic Research, BEA)


The Common Occurrence Of Government Shutdowns – Fiscal Policy

Government shutdowns have been a common occurrence over the years under most every president. The length of the shutdowns have varied from 2 days in 1981 under President Reagan, 21 days in 1995 under President Clinton, and 34 days in 2019 under President Trump. A shutdown occurs when Congress fails to pass or the President refuses to sign legislation funding federal government operations and agencies.

Estimated costs of the most recent government shutdown are still unknown, with lost wages, exports, and government services essential to the operation of private sector businesses being affected. How much the shutdown may have weighed on the economy may not be known until later in the year. Government shutdowns entail partial closure of certain agencies and departments, not complete closures. Departments affected during the most recent shut down include Homeland Security, Housing & Urban Development, Commerce, FCC, Coast Guard, FEMA, Interior, Transportation, and the Executive Office of the President.

Federal employees deemed as “essential” among the various departments are required to work without pay until a funding bill is passed by Congress. The closures affect numerous private businesses that rely and adhere to regulatory rules imposed by the Federal government, such as mortgage loans and Housing & Urban Development.

Sources: Congressional Records, https://www.congress.gov/congressional-record/2018/12/22

America’s Bridges Need Repair – Fiscal Expenditures

As Congress deliberates the federal budget for 2024, decisions as to where to allocate funds can be crucial. The vast landmass and distances between cities and population centers in the United States demands an expansive and organized network of highways. As the population of the country has grown, so has the number of automobiles and trucks traversing the enormous national highway system. As the highways expanded to accommodate more traffic and heavier loads, roads and bridges have become integral components to the nation’s transportation system. Of the 117,483 bridges covering the nation’s highways, The Department of Transportation has identified over 5,230 as structurally deficient. The District of Columbia alone has over 16% of its highway bridges deemed structurally deficient.

According to the Department of Transportation, there are over 254 million registered automobiles traversing the highways of America, the largest passenger vehicle population of any country worldwide. The Environmental Protection Agency (EPA) has estimated the average weight of passenger vehicles and light trucks to be approximately 4,000 pounds. Large tractor-trailers and commercial vehicles can weigh in excess of 150,000 pounds, with 80,000 pounds as a maximum for many states. Over the years, automobiles and transport trucks have actually gotten heavier as engines have become stronger ,more efficient, and capable of hauling much heavier loads. The combination of increased weight and erosion from weather has hindered the structural integrity of thousands of bridges over the years. In addition to weight and erosion, fault lines and earthquakes have also taken a toll on bridges due to frequent seismic occurrences. (Source: Department of Transportation)