Ocean Park Capital Management
2503 Main Street
Santa Monica, CA 90405
Main: 310.392.7300
Daily Performance Line: 310.281.8577
Dow Jones | 46,397 |
S&P 500 | 6,688 |
Nasdaq | 22,660 |
2 Yr Treasury | 3.60% |
10 Yr Treasury | 4.16% |
10 Yr Municipal | 2.92% |
High Yield | 6.56% |
Dow Jones | 9.06% |
S&P 500 | 13.72% |
Nasdaq | 17.34% |
MSCI-EAFE | 22.34% |
MSCI-Europe | 24.64% |
MSCI-Pacific | 17.97% |
MSCI-Emg Mkt | 25.16% |
US Agg Bond | 6.13% |
US Corp Bond | 6.88% |
US Gov’t Bond | 5.93% |
Gold | 3,882 |
Silver | 46.77 |
Oil (WTI) | 62.52 |
Dollar / Euro | 1.17 |
Dollar / Pound | 1.34 |
Yen / Dollar | 148.71 |
Canadian /Dollar | 0.71 |
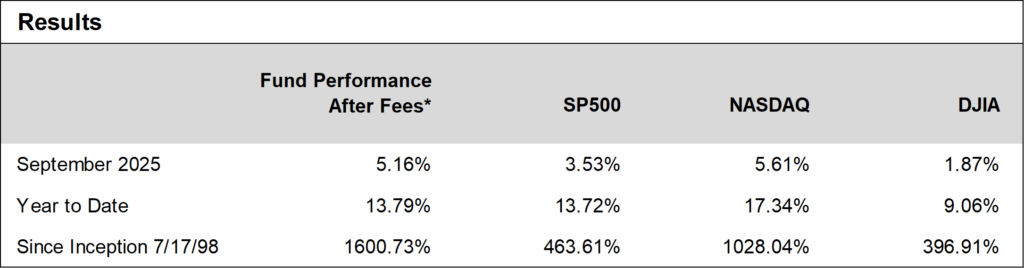
Ocean Park Investors Fund delivered another strong result in September, advancing 5.16%* for the month while the S&P 500 returned 3.53% and the NASDAQ Composite rose 5.61%. Once again technology stocks led the way with Corning, Lumentum, and Taiwan Semiconductor each gaining more than 20%.
Notable new positions based on analyst earnings estimate increases included Applied Materials, General Motors, Seagate Technology and Western Digital.
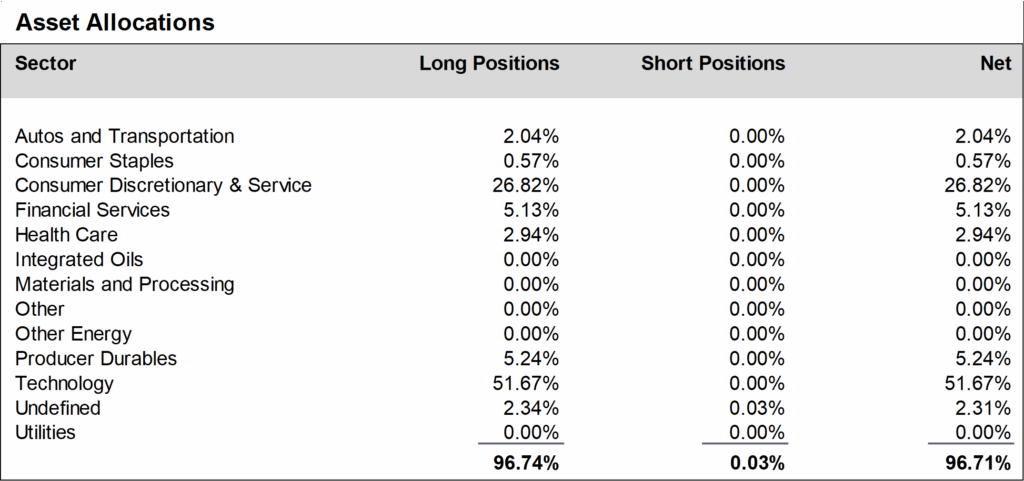
We modestly reduced our position in Nvidia, as it became outsized due to price appreciation, bringing sizing closer to our risk parameters. In addition, we exited positions in Zebra Technologies and Monster Beverage following lackluster analyst reaction to company fundamentals. We finished the month at about 97% net long, down from about 98% at the end of August.
Daily updates on our activity are available on our Results Line, at 310-281-8577, and current information is also maintained on our website at www.oceanparkcapital.com. To gain access to the site enter password opcap.
*These results are pro forma. Actual results for most investors will vary. See additional disclosures on page 4. Past performance does not guarantee future results.
U.S. equities generated strong gains in September, with the S&P 500 and the NASDAQ Composite posting their best September returns in 15 years. The rally was supported by broadly positive earnings, with continued leadership in technology and industrial names. Market breadth remained healthy, with eight of eleven S&P 500 sectors advancing. Technology was the big winner and consumer staples the worst loser. Volatility was unusually low, as the S&P 500 never moved more that 1% on any of the 21 trading days.
Both growth and value stocks participated, though mega-cap technology leadership narrowed. Semiconductor and AI stocks, in particular, saw active trading on earnings and analyst upgrades, with significant sector rotation as the month progressed. Defensive sectors were more muted as investor risk appetite improved.
The Federal Reserve headlined economic news in September as it lowered the benchmark interest rate by 0.25%, its first reduction in 9 months. The Fed also signaled the likelihood of two more cuts of 0.25% each this year and another one next year. Chairman Powell cited “the risks that we’re seeing to the labor market” as the reason for the cut, suggesting that weak employment numbers now concern the Fed more than the risk of inflation.
Economic indicators showed steady consumer spending and improving services activity, alongside mixed manufacturing reads and continued moderation in hiring; unemployment hovered near 4.2% with wage growth supporting investor sentiment. Financial conditions eased modestly following the policy move, supporting risk assets and credit. Against this backdrop, positioning remained focused on earnings momentum, positive estimate revisions, and selective exposure to AI‑enabled demand trends into the final quarter of the year.
Performance data for OPI reflect the reinvestment of dividends and other earnings on the fund’s assets. Performance data for the major indices reflect only changes in the value of those indices, and would be higher if dividends were included. However, the index data do not reflect fees that would be paid to index fund managers and transaction costs that would be incurred when their component stocks are bought or sold, while OPI’s data do reflect quarterly fees and expenses incurred by the fund. The information provided is believed to be reliable, but its accuracy or completeness is not warranted. This material is not intended as an offer or solicitation for the purchase or sale of any stock, bond, mutual fund, or any other financial instrument. The views and strategies discussed herein may not be appropriate and/or suitable for all investors. This material is meant solely for informational purposes, and is not intended to suffice as any type of accounting, legal, tax, or estate planning advice. Any and all forecasts mentioned are for illustrative purposes only and should not be interpreted as investment recommendations.